138 Sunnymeade Rd · Rustburg, VA
Flood risk No data
- FEMA flood zone
- —
- Chance of flooding over 30 yrs
- —
- Est. flood insurance / yr
- —
Fire risk No data
- Est. fire insurance / yr
- —
Heat risk No data
- Hot days now (above threshold)
- —
- Hot days in 30 yrs
- —
Wind risk No data
- Chance of severe wind over 30 yrs
- —
Air-quality risk No data
- Unhealthy air days now
- —
- Unhealthy air days in 30 yrs
- —
Risk factors via First Street. Map © Google.
Why this score? — see what drove the F grade
The composite is a weighted blend of 9 inputs, each scored 0–100. Each bar is that input's sub-score; the figure is the points it added to the 100-point composite (weight × sub-score).
- Cash flow +7.3/30.0
- ARV discount +6.0/15.0
- Schools +5.2/10.0
- Appreciation +5.0/10.0
- Livability +3.8/5.0
- Rent growth +2.5/5.0
- Condition / age +2.5/5.0
- DSCR +1.5/10.0
- 1% rule +0.8/10.0
$339,900
🖨 Deal sheet 📄 Offer letter ✓ Due diligence
Listing remarks
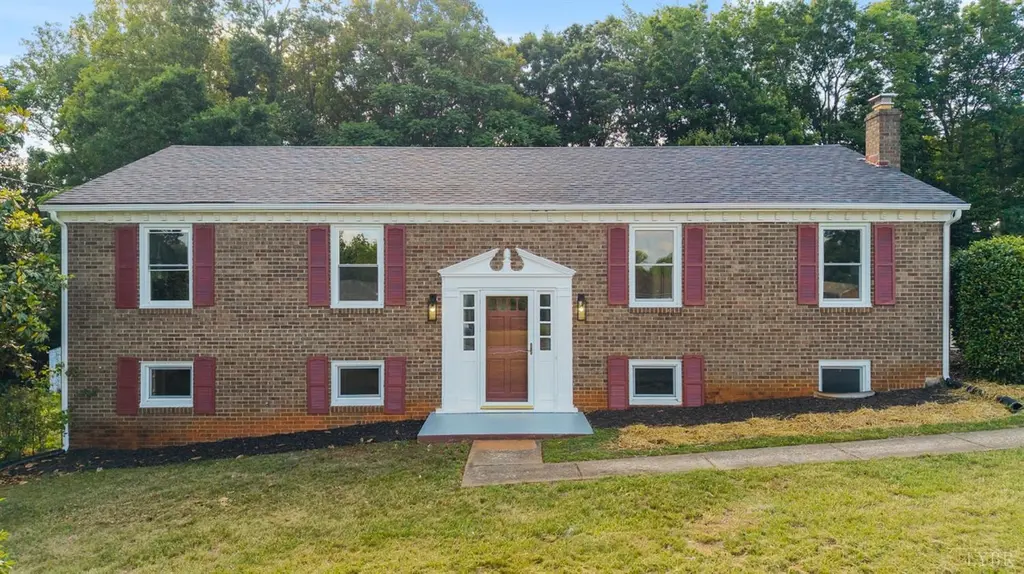
Welcome to this beautifully updated brick home in Rustburg, VA where nearly every detail has been thoughtfully refreshed from top to bottom! From the moment you arrive, you'll notice the new roof, new windows, and classic brick exterior that give this home tremendous curb appeal. Step inside through the inviting split foyer and discover brand new flooring, fresh paint throughout, and all new light fixtures that create a bright, modern feel in every room. The stunning new kitchen is ready for its first home chef, and the updated bathrooms add a polished, move-in-ready finish. There's plenty of room for the whole family! Out back, enjoy the freshly updated deck overlooking a large, flat back
Key facts
- Brick exterior
- Fresh paint
- New flooring
Tags
Property features AI
Finance
- Financial info: Annual tax: $1,048
Exterior
- Parking: Paved off-street parking
- Utilities: Well water; Septic; Electric power
- Home design: Single family residence; Residential property
- Construction: Brick construction; Shingle roof
- Exterior features: Garden; Deck
Interior
- Kitchen: Dishwasher; Electric range; Refrigerator; Microwave
- Flooring: Vinyl flooring
- Bathrooms: 2 full bathrooms
- Heating & cooling: Heat pump
- Interior features: Finished walk-out basement; Garden view; Deck
- Laundry & utility: Washer hookup; Laundry room; Laundry in basement; Electric water heater
Neighborhood map
What this means for you Summary
Snapshot
- This is a 3-bed/2.0-bath single-family listed at $340k.
Deal economics
- At list price, monthly cash flow is $-452 ($-5k/yr) — negative.
- To cash-flow at today's rent, offer at most $260k (23.5% below list).
- To meet the 1% rule (rent ≥ 1% of price), the offer needs to be $196k (42.4% below list).
- Recommended offer: $196k (42.4% below list) — sets the bar for 1% rule.
- Cap rate 4.7% vs local median 3.0% in Rustburg — top-decile yield for the area; either an underpriced asset or a hidden risk that comps aren't pricing in. Stress-test before assuming the spread holds.
Location & tenants
- Location reads 75/100 on livability (#135 in VA, #4,322 nationally) — a middle-class / working-renter tenant base. Strengths: crime A+, cost of living A+, housing A+; Watch: amenities F, commute F.
- Campbell County Public School District (rural): math 55% / reading 68% proficiency, ranked #55 of 131 in VA (top 42%) — acceptable for families but not a draw, mixed tenant base, ~2y average lease.
- Zoned schools: Yellow Branch Elementary (math 60% / reading 63%, grade B, #516 of 1,108 statewide, top 47%, 573 students, 74% FRL); Rustburg Middle (math 49% / reading 65%, grade B, #178 of 342 statewide, top 53%, 606 students, 74% FRL); Rustburg High (math 77% / reading 67%, grade B+, #134 of 319 statewide, top 45%, 828 students, 67% FRL) — zoned schools average 72% FRL vs 37% district-wide (35 pts higher); higher-poverty schools than district average — tighter screening recommended.
- Market conditions: 1 active listings in the ZIP; 9 comparable units currently listed for rent nearby; rentals lingering (median 44d on market — plan ~5-8 weeks vacancy on turnover, expect pricing pressure); 56% of comp listings sitting > 30 days — soft ceiling on asking rent; 315 units permitted in Campbell County in 2024 (51 in 5+ unit buildings).
Forward outlook
- In year one you build about $13k of equity ($2k loan paydown + $10k appreciation (3.0% local appreciation)).
- Campbell County population projected to shrink 6% by 2050 — rents likely to lag national; underwrite the cash flow, not the appreciation.
- By year 3, paydown + projected appreciation supports a ~$31k cash-out refi (75% LTV) — recoverable capital for the next deal without selling this one.
Negotiation context
- Only 13 days on market — expect competitive offers; lowballing is unlikely to land.
- Current owner paid $165k; list at $340k implies a 106% gain — meaningful room to come down on a strong offer.
Questions for the listing agent
- What do current leases actually rent for vs. the listed asking? Can we see a recent rent roll and the last 12 months of T-12 income?
- Built in 1976 — when were the roof, HVAC, electrical panel, plumbing, and water heater last replaced?
- Is there a deadline driving the sale (1031 exchange, divorce, estate, relocation)? That informs how much negotiation room exists.
- Schools are B-rated — typically a magnet for longer-tenancy family renters. What's the average tenant stay here, and is there a school-zone premium baked into asking?
- The area grade is low — what's the realistic commute time and amenity access for the typical tenant pool here? Any planned neighborhood developments (good or bad) we should know about?
- What's the average days-on-market for RENTAL listings here right now (not sales)? A rising rental-DOM trend means longer vacancies and softer asking-rent achievability than the comps imply.
- What's the recent tenant-quality profile in this submarket — average credit score on applications, eviction rate, late-payment / NSF rate, and stable-employment percentage? A property-management company in the area should have these aggregated.
- How much new for-sale + rental construction is in the pipeline within 1–3 miles? Heavy new supply typically softens prices + rents 12–24 months out; constrained supply supports both.
Investment metrics
- 1% rule
- 0.58% ✗
- Cap rate
- 4.70%
- Cash-on-cash
- -5.70%
- DSCR
- 0.75
- GRM
- 14.5
CMA / ARV
- ARV (on-the-fly)
- $328,711
- Comps found
- 4
Show comp detail 4 sales within ~0.75 mi
| Address | Dist | Beds/Ba | Sqft | Sold | Price | $/sf | Match |
|---|---|---|---|---|---|---|---|
| 409 Sunnymeade Rd | 0.27mi | 3/2.0 | 1,856 (+8%) | 1mo | $279,900 | $151 | 74 |
| 319 Mantle Dr | 0.42mi | 3/2.0 | 1,811 (+5%) | 2mo | $352,900 | $195 | 70 |
| 67 Ford Terrace Ter | 0.51mi | 3/2.5 | 1,828 (+6%) | 23mo | $350,000 | $191 | 45 |
| 958 Sunnymeade Rd | 0.73mi | 3/2.0 | 1,537 (-11%) | 14mo | $257,500 | $168 | 36 |
Match score weights: distance 35% · size 25% · config 20% · recency 20%. Top-matched comps best support the ARV.
Projected returns pro-forma
3.0% appreciation · 3.0% rent growth · sell at horizon
- IRR
- 2.2%
- Equity multiple
- 1.13×
- Total profit
- $11,970
- Equity at exit
- $152,834
- IRR
- 5.7%
- Equity multiple
- 1.87×
- Total profit
- $82,758
- Equity at exit
- $235,535
Cash invested: $95,172 (down + closing). Projections, not guarantees.
Landlord ↔ Tenant lean methodology
- Overall (STATE)
- 55 Moderately Landlord-Leaning
- State Virginia
- 55 Moderately Landlord-Leaning · D+2
- County
- — inherits STATE
- City
- — inherits STATE
ZIP-level market 23588
- Active inventory
- 1
- Price-to-rent
- 14.5×
Monthly cashflow live
- Estimated rent
- $1,957 high interval (Pro) →
- Mortgage (P&I)
- −$1,782
- Tax from tax record
- −$74 /mo · $890/yr
- Insurance
- −$142
- HOA
- −$0
- Vacancy / Maint / Mgmt
- −$411
- Net cashflow
- $-452
Break-even live
UW: 25.0% down · 7.5% · 30yr · 1.5% tax · 5.0% vac · 8.0% maint · 8.0% mgmt
Financing live
Cash to close
- Down payment
- $84,975
- Closing costs
- $10,197
- Reserves months
- —
- Total cash needed
- —
Loan-product check · same deal, 3 products live
Conventional
25% down · 7.5% · 30yr
- Down + closing
- —
- Monthly P&I
- —
- Monthly cashflow
- —
- DSCR
- —
- Eligible?
- —
Personal DTI + credit; lowest rate.
DSCR
20% down · 8.5% · 30yr
- Down + closing
- —
- Monthly P&I
- —
- Monthly cashflow
- —
- DSCR
- —
- Eligible?
- —
No personal income docs; deal must DSCR.
Hard money
10% down · 12.0% · 12mo
- Down + closing
- —
- Monthly P&I
- —
- Monthly cashflow
- —
- DSCR
- —
- Eligible?
- —
Short-term bridge; refi at stabilization.
Rent comps 9 comps
| Address | Beds | Baths | Sqft | Rent | $/sqft | DOM | Units | Dist |
|---|---|---|---|---|---|---|---|---|
| 87 High St Unit 87 Lynchburg, VA | 4.0 | 3.5 | 2175 | $2,295 | $1.06 | 43d | 1 | 0.53mi |
| 87 High St Lynchburg, VA | 4.0 | 4.0 | 2175 | $2,295 | $1.06 | 43d | 1 | 0.53mi |
| 76 High St Lynchburg, VA | 2.0 | 2.5 | 1333 | $1,795 | $1.35 | 21d | 1 | 0.53mi |
| 32 Allure Dr Rustburg, VA | 3.0 | 2.5 | 1508 | $2,000 | $1.33 | 21d | 1 | 0.83mi |
| 126 Allure Dr Rustburg, VA | 3.0 | 2.5 | 1508 | $1,900 | $1.26 | 13d | 1 | 0.84mi |
| 81 Catherine Ct Lynchburg, VA | 2.0 | 2.5 | 1328 | $1,500 | $1.13 | 13d | 1 | 1.23mi |
| 108 Old Tavern Cir Lynchburg, VA | 2.0 | 1.5 | 1080 | $1,450 | $1.34 | 43d | 1 | 1.27mi |
| 9 Gloucester Dr Lynchburg, VA | 4.0 | 3.5 | 1748 | $1,850 | $1.06 | 43d | 1 | 1.30mi |
| 104 Squire Cir Lynchburg, VA | 3.0 | 3.0 | 1296 | $1,700 | $1.31 | 43d | 1 | 1.39mi |
Listing history 12 events
-
2026-06-13statusdays on market $339,900 Pending 13 DOM
-
2026-06-10days on market $339,900 Active 12 DOM
-
2026-06-09days on market $339,900 Active 11 DOM
-
2026-06-08days on market $339,900 Active 10 DOM
-
2026-06-07days on market $339,900 Active 9 DOM
-
2026-06-05days on market $339,900 Active 6 DOM
-
2026-06-02days on market $339,900 Active 4 DOM
-
2026-06-01days on market $339,900 Active 3 DOM
-
2026-05-31days on market $339,900 Active 2 DOM
-
2026-05-29$339,900 Active
-
2026-04-08soldstatus $165,000
-
1990-10-09soldstatus $74,900
ⓘ Source: listings_history table (triggers on properties + properties_extension) + one-shot
backfill from property_details.listing_events for pre-trigger history.
Tax reassessment forecast VA · Resets to sale price
- Current annual tax
- $890 · $74/mo
- Projected year-2 tax
- $2,787 · $232/mo
- Expected delta
- +$1,897/yr (+$158/mo · 213.1%)
ⓘ Screening estimate from a state-policy table — verify with the county assessor before closing.
Nearby sold comps map
Loading sold comps map…
Walkable amenities ~0.75 mi
Loading nearby amenities…
Taxation est. · year 1
- Rental income
- $23,487
- − Mortgage interest
- −$19,040
- − Property taxes
- −$890
- − Insurance
- −$1,700
- − Repairs & maintenance
- −$1,879
- − Management
- −$1,879
- − Depreciation
- −$9,888
- Taxable loss
- −$11,788
- Est. tax savings @ 24.0%
- +$2,829
- After-tax cash flow
- $-2,595/yr
For passive investors: Depreciation is non-cash, so a rental often shows a tax loss while cash-flowing — sheltering income. Rental losses are passive: they offset passive income freely, and up to $25,000/yr can offset ordinary (W-2) income if you actively participate and your MAGI is under $100k (phasing out to $0 by $150k); unused losses carry forward. On sale, claimed depreciation is recaptured at up to 25%, and gains may owe capital-gains tax (a 1031 exchange can defer both). Figures are a year-1 estimate at your 24.0% rate — not tax advice; consult a CPA.
Schools (NCES district)
- District
- Campbell County Public School District
- NCES district ID
- 5100600
- Math proficiency
- 55% ▼ -29.00%
- Reading proficiency
- 68% ▼ -11.00%
- Median HH income
- $45,915
- Composite
- 51.88/100
- National rank
- #1656
- State rank
- #55 of 131 in VA
Livability — Rustburg
- Score
- 75/100
- State rank
- #135
- US rank
- #4322
Category grades
Schools grade is shown separately in the Schools card above.
Census & demographics
No demographic data for this ZIP.
Market trends
- HPI YoY
- —
- Current HPI
- —
- Rent YoY
- —
- Metro
- —
- State GDP YoY
- ▲ 2.40%
- F500 in state
- 50
Industry mix (Fortune 500 HQ in VA)
| Industry | F500 HQs | Revenue |
|---|---|---|
| Aerospace / Defense | 4 | $236B |
|
||
| Technology / Defense | 3 | $32B |
|
||
| Financial Services | 2 | $176B |
|
||
| Utilities | 2 | $27B |
|
||
| Insurance | 2 | $25B |
|
||
| Technology | 2 | $15B |
|
||
Price history
+353.8% since first listed3 events — show timeline
- 2026-05-29 Listed $339,900 LMLS
- 2026-04-08 Sold (Public Records) $165,000 Public Records
- 1990-10-09 Sold (Public Records) $74,900 Public Records
Property tax history
+1.6%/yrLatest (2025): $890 · +0.0% YoY. Source: county tax records.
Cash-flow waterfall
monthlySold comps — $/sqft
last 12 mo · ≤1 miLoading sold comps…