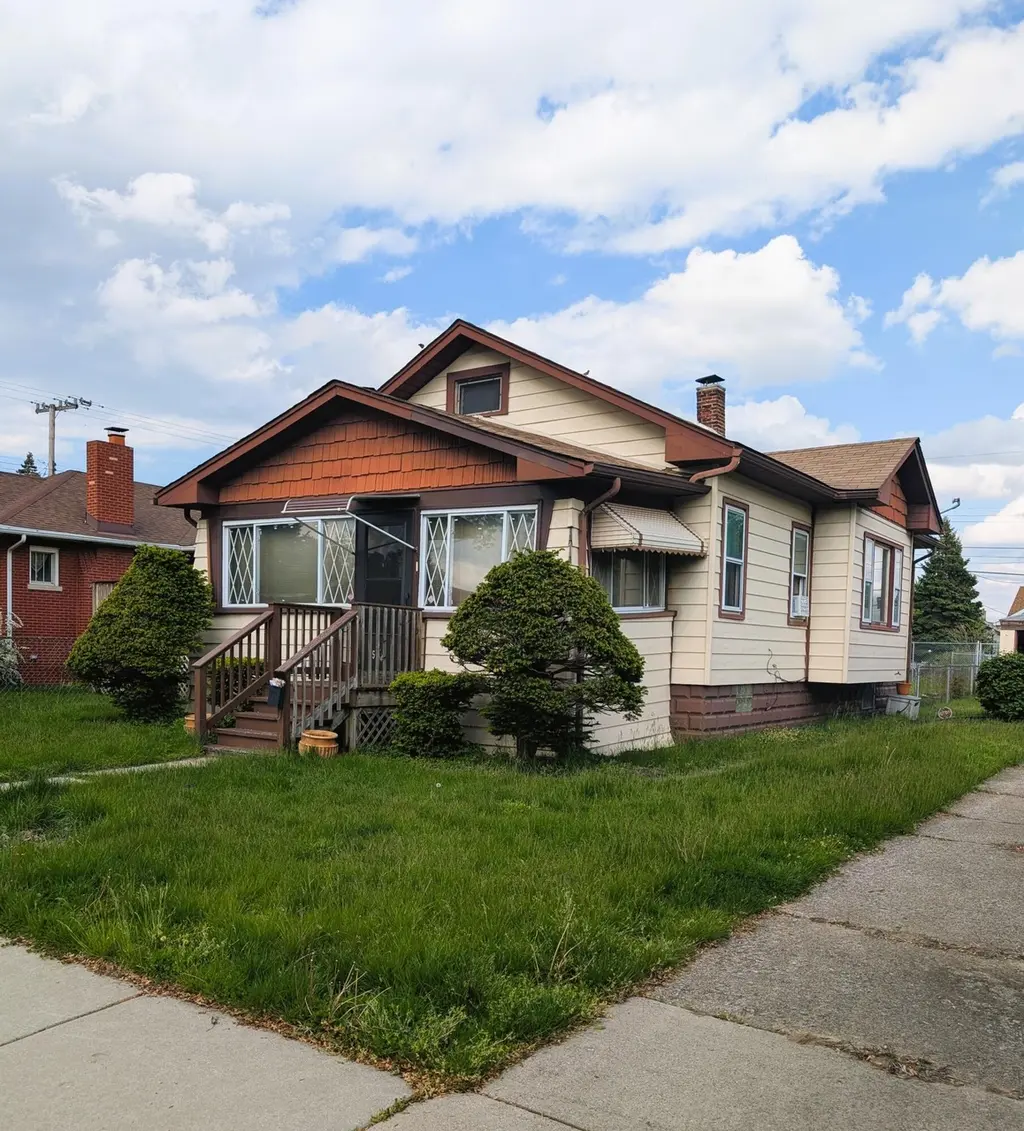
6521 Arkansas Ave · Hammond, IN
Flood risk 1/10 · Minimal
- FEMA flood zone
- X (unshaded)
- Chance of flooding over 30 yrs
- 0.0%
- Est. flood insurance / yr
- $473 – $860
Fire risk 3/10 · Minor
- Est. fire insurance / yr
- $717 – $1,331
Heat risk 3/10 · Minor
- Hot days now (above 102°F)
- 7 days/yr
- Hot days in 30 yrs
- 15 days/yr
Wind risk 2/10 · Minimal
- Chance of severe wind over 30 yrs
- 1.0%
Air-quality risk 4/10 · Minor
- Unhealthy air days now
- 5 days/yr
- Unhealthy air days in 30 yrs
- 6 days/yr
Risk factors via First Street. Map © Google.
Why this score? — see what drove the B- grade
The composite is a weighted blend of 9 inputs, each scored 0–100. Each bar is that input's sub-score; the figure is the points it added to the 100-point composite (weight × sub-score).
- Cash flow +27.9/30.0
- ARV discount +15.0/15.0
- DSCR +9.9/10.0
- 1% rule +6.6/10.0
- Livability +3.5/5.0
- Rent growth +2.5/5.0
- Condition / age +2.5/5.0
- Schools +1.1/10.0
- Appreciation +0.0/10.0
$120,000
🖨 Deal sheet 📄 Offer letter ✓ Due diligence
Listing remarks
INVESTOR SPECIAL!! Come take a look at this little bungalow in Hessville, waiting for a new owner to bring it back to life. This 2 bedroom, 2 bath ranch has hardwood floors, a den in the basement, and a family room in the basement as well. 2 car detached garage with a long driveway. Boiler heat. Fenced in yard. Enclosed front porch. The potential to make this a beautiful home is waiting for the right person. AS-IS Cash, Hardmoney or rehab loan.
Key facts
- Den in the basement
- Hardwood floors
- Fenced in yard
Tags
Property features AI
Finance
- Other: Occupant status: Vacant
Exterior
- Parking: Detached garage; Driveway access; Garage door opener; 2-car garage
- Utilities: Public water; Public sewer
- Home design: One level (with finished basement); Property built in 1930; Property currently described as fixer
- Construction: 1930 construction
- Exterior features: Neighborhood view; Chain link fencing
Interior
- Kitchen: Gas Range
- Bedrooms: Primary bedroom; Second bedroom
- Flooring: Hardwood flooring
- Bathrooms: One full bathroom; One three-quarter bathroom
- Heating & cooling: Hot water heating; Other cooling system
- Interior features: No notable built-in interior features listed; Basement is full and partially finished with bath stubbed
- Laundry & utility: Basement has plumbing stubbed for bath (utility-ready)
Neighborhood map
What this means for you Summary
Snapshot
- This is a 2-bed/1.0-bath single-family listed at $120k.
Deal economics
- At list price, monthly cash flow is $369 ($4k/yr) — positive.
- The deal already cash-flows at list — no discount required.
- Meets the 1% rule at list price ($1k rent vs $120k).
- Cap rate 10.0% vs local median 5.8% in Hammond — top-decile yield for the area; either an underpriced asset or a hidden risk that comps aren't pricing in. Stress-test before assuming the spread holds.
Location & tenants
- Location reads 70/100 on livability (#143 in IN) — a middle-class / working-renter tenant base. Strengths: cost of living A+, housing A+, commute A; Watch: health & safety D+, employment D, schools F.
- School City Of Hammond (suburban): math 8% / reading 18% proficiency, ranked #289 of 301 in IN (top 96%) — low school quality limits family demand, transient renter base, plan for 1-2y turnover; 74% free/reduced lunch — lower-income household profile, screen leases tightly.
- Market conditions: 59 active listings in the ZIP; 10 comparable units currently listed for rent nearby; rentals leasing fast (median 7d on market — plan ~1-2 weeks tenant-placement turnaround); 1,642 units permitted in Lake County in 2024 (14 in 5+ unit buildings).
Forward outlook
- Local home prices are declining (-3.0%/yr); year-one equity from $830 of loan paydown is wiped out by about $4k of value loss. Plan a longer hold.
- Lake County population projected to shrink 7% by 2050 — rents likely to lag national; underwrite the cash flow, not the appreciation.
- At projected returns (-3.0% appreciation + 3.0% rent growth), your $34k cash investment doubles in ~9 years — after that, you're playing with house money.
Negotiation context
- Only 9 days on market — expect competitive offers; lowballing is unlikely to land.
Risks & watch-outs
- Watch-outs: built in 1930 — expect roof / HVAC / electrical / plumbing capex.
Questions for the listing agent
- Built in 1930 — when were the roof, HVAC, electrical panel, plumbing, and water heater last replaced?
- Is there a deadline driving the sale (1031 exchange, divorce, estate, relocation)? That informs how much negotiation room exists.
- Schools are F-rated, which usually means shorter tenancies and higher turnover. Who's the typical renter profile here, and what's been the actual vacancy rate?
- Crime grade is F in this area — have there been break-ins, vandalism, or insurance claims at this property in the last 3 years? What carrier currently insures it and at what premium?
- What's the average days-on-market for RENTAL listings here right now (not sales)? A rising rental-DOM trend means longer vacancies and softer asking-rent achievability than the comps imply.
- What's the recent tenant-quality profile in this submarket — average credit score on applications, eviction rate, late-payment / NSF rate, and stable-employment percentage? A property-management company in the area should have these aggregated.
- How much new for-sale + rental construction is in the pipeline within 1–3 miles? Heavy new supply typically softens prices + rents 12–24 months out; constrained supply supports both.
Investment metrics
- 1% rule
- 1.16% ✓
- Cap rate
- 9.98%
- Cash-on-cash
- 13.18%
- DSCR
- 1.59
- GRM
- 7.2
CMA / ARV
- ARV (on-the-fly)
- $148,896
- Comps found
- 12
Show comp detail 12 sales within ~0.75 mi
| Address | Dist | Beds/Ba | Sqft | Sold | Price | $/sf | Match |
|---|---|---|---|---|---|---|---|
| 6538 Alexander Ave | 0.35mi | 2/1.0 | 825 (+4%) | 4mo | $155,000 | $188 | 73 |
| 2715 164th Pl | 0.32mi | 2/1.0 | 736 (-7%) | 3mo | $150,000 | $204 | 71 |
| 6522 California Ave | 0.04mi | 2/1.5 | 875 (+10%) | 13mo | $203,000 | $232 | 68 |
| 3044 Crane Pl | 0.40mi | 3/1.0 (+1) | 816 (+3%) | 5mo | $80,000 | $98 | 67 |
| 6730 Carolina Ave | 0.35mi | 2/1.0 | 816 (+3%) | 15mo | $90,000 | $110 | 66 |
| 6839 Arkansas Ave | 0.39mi | 2/1.0 | 850 (+7%) | 4mo | $159,000 | $187 | 66 |
| 2612 Vine Pl | 0.45mi | 2/1.0 | 820 (+4%) | 14mo | $110,000 | $134 | 62 |
| 3149 Crane Pl | 0.49mi | 2/1.0 | 690 (-13%) | 0mo | $190,000 | $275 | 56 |
| 6711 Osborn Ave | 0.61mi | 2/1.0 | 756 (-4%) | 16mo | $115,000 | $152 | 51 |
| 2726 162nd Pl | 0.44mi | 3/1.5 (+1) | 874 (+10%) | 6mo | $195,000 | $223 | 50 |
| 7045 Alabama Ave | 0.70mi | 2/1.0 | 862 (+9%) | 8mo | $150,000 | $174 | 46 |
| 2913 Janet Pl | 0.40mi | 2/11.0 | 852 (+8%) | 9mo | $163,000 | $191 | 41 |
Match score weights: distance 35% · size 25% · config 20% · recency 20%. Top-matched comps best support the ARV.
Projected returns pro-forma
-3.0% appreciation · 3.0% rent growth · sell at horizon
- IRR
- 3.1%
- Equity multiple
- 1.12×
- Total profit
- $4,016
- Equity at exit
- $17,892
- IRR
- 12.6%
- Equity multiple
- 2.00×
- Total profit
- $33,605
- Equity at exit
- $10,375
Cash invested: $33,600 (down + closing). Projections, not guarantees.
Landlord ↔ Tenant lean methodology
- Overall (STATE)
- 90 Strongly Landlord-Friendly
- State Indiana
- 90 Strongly Landlord-Friendly · R+11
- County
- — inherits STATE
- City
- — inherits STATE
ZIP-level market 46323
- Home prices YoY
- -18.8%
- Active inventory
- 59
- Price-to-rent
- 7.2×
Monthly cashflow live
- Estimated rent
- $1,397 high interval (Pro) →
- Mortgage (P&I)
- −$629
- Tax from tax record
- −$56 /mo · $666/yr
- Insurance
- −$50
- HOA
- −$0
- Vacancy / Maint / Mgmt
- −$293
- Net cashflow
- $369
Break-even live
UW: 25.0% down · 7.5% · 30yr · 1.5% tax · 5.0% vac · 8.0% maint · 8.0% mgmt
Financing live
Cash to close
- Down payment
- $30,000
- Closing costs
- $3,600
- Reserves months
- —
- Total cash needed
- —
Loan-product check · same deal, 3 products live
Conventional
25% down · 7.5% · 30yr
- Down + closing
- —
- Monthly P&I
- —
- Monthly cashflow
- —
- DSCR
- —
- Eligible?
- —
Personal DTI + credit; lowest rate.
DSCR
20% down · 8.5% · 30yr
- Down + closing
- —
- Monthly P&I
- —
- Monthly cashflow
- —
- DSCR
- —
- Eligible?
- —
No personal income docs; deal must DSCR.
Hard money
10% down · 12.0% · 12mo
- Down + closing
- —
- Monthly P&I
- —
- Monthly cashflow
- —
- DSCR
- —
- Eligible?
- —
Short-term bridge; refi at stabilization.
Rent comps 10 comps
| Address | Beds | Baths | Sqft | Rent | $/sqft | DOM | Units | Dist |
|---|---|---|---|---|---|---|---|---|
| 2723 E 165th St Unit 3 Hammond, IN | 2.0 | 1.0 | 800 | $1,350 | $1.69 | 6d | 1 | 0.26mi |
| 3400 Stevens Ct Hammond, IN | 1.0 | 1.0 | 700 | $1,120 | $1.60 | 18d | 1 | 0.72mi |
| 7050 Idaho Ave Unit 3S Hammond, IN | 1.0 | 1.0 | 650 | $1,275 | $1.96 | 10d | 1 | 0.77mi |
| 7050 Idaho Ave Hammond, IN | 1.0 | 1.0 | 650 | $1,275 | $1.96 | 3d | 1 | 0.77mi |
| 7105 Parrish Ave Hammond, IN | 1.0 | 1.0 | 650 | $1,275 | $1.96 | 20d | 1 | 0.80mi |
| 7105 Parrish Ave Unit 3N Hammond, IN | 1.0 | 1.0 | 650 | $1,275 | $1.96 | 24d | 1 | 0.80mi |
| 3611 167th St Hammond, IN | 1.0–2.0 | 1.0 | 695 | $1,450 | $2.09 | 1d | 1 | 0.87mi |
| 6746 Forestdale Ave Hammond, IN | 3.0 | 1.0 | 900 | $1,860 | $2.07 | 1d | 1 | 0.95mi |
| 6610 Rhode Island Ave Hammond, IN | 3.0 | 1.0 | 1025 | $1,600 | $1.56 | 7d | 1 | 1.18mi |
| 6320 Rhode Island Ave Hammond, IN | 3.0 | 1.0 | 916 | $1,550 | $1.69 | 2d | 1 | 1.20mi |
Listing history 2 events
-
2026-05-22status Pending
-
2026-05-13$120,000 Active
ⓘ Source: listings_history table (triggers on properties + properties_extension) + one-shot
backfill from property_details.listing_events for pre-trigger history.
Tax reassessment forecast IN · Partial reset (capped growth)
- Current annual tax
- $666 · $56/mo
- Projected year-2 tax
- $843 · $70/mo
- Expected delta
- +$177/yr (+$15/mo · 26.5%)
ⓘ Screening estimate from a state-policy table — verify with the county assessor before closing.
Climate risk First Street
- Flood 1/10 Low FEMA zone X (unshaded) · 0% chance over 30 yrs
- Wildfire 3/10 Moderate
- Heat 3/10 Moderate 7 d/yr ≥102°F today · 15 d/yr by 30 yrs out
- Wind 2/10 Low 100% chance of damaging wind over 30 yrs
- Air quality 4/10 Moderate 5 unhealthy d/yr today · 6 by 30 yrs out
Nearby sold comps map
Loading sold comps map…
Walkable amenities ~0.75 mi
Loading nearby amenities…
Taxation est. · year 1
- Rental income
- $16,766
- − Mortgage interest
- −$6,722
- − Property taxes
- −$666
- − Insurance
- −$600
- − Repairs & maintenance
- −$1,341
- − Management
- −$1,341
- − Depreciation
- −$3,491
- Taxable income
- $2,604
- Est. tax owed @ 24.0%
- −$625
- After-tax cash flow
- $3,802/yr
For passive investors: Depreciation is non-cash, so a rental often shows a tax loss while cash-flowing — sheltering income. Rental losses are passive: they offset passive income freely, and up to $25,000/yr can offset ordinary (W-2) income if you actively participate and your MAGI is under $100k (phasing out to $0 by $150k); unused losses carry forward. On sale, claimed depreciation is recaptured at up to 25%, and gains may owe capital-gains tax (a 1031 exchange can defer both). Figures are a year-1 estimate at your 24.0% rate — not tax advice; consult a CPA.
Schools (NCES district)
- District
- School City Of Hammond
- NCES district ID
- 1804320
- Math proficiency
- 8% ▼ -18.00%
- Reading proficiency
- 18% ▼ -15.00%
- Median HH income
- $39,970
- Composite
- 11.11/100
- National rank
- #9730
- State rank
- #289 of 301 in IN
Livability — Hammond
- Score
- 70/100
- State rank
- #143
- US rank
- #7343
Category grades
Schools grade is shown separately in the Schools card above.
Census & demographics
- Census place
- Hammond, IN
- County
- Lake County · 422,878 people
- City population
- 58,809
- Metro
- Chicago-Naperville-Elgin, IL-IN-WI
- Population (ZIP)
- 23,047
- Household income
- $59,688
- Rent vs Own
- Severe rent burden
- 692.0
Population outlook (Lake County) Hauer SSP2
- Today (2025)
- 484,026 people
- By 2030
- 478,091 · -1.2%
- By 2040
- 462,974 · -4.3%
- By 2050
- 449,894 · -7.1%
- By 2075
- 436,169 · -9.9%
- By 2100
- 426,607 · -11.9%
Race, ethnicity, and origin ACS 2023
- Neighborhood character
- Diverse neighborhood (Simpson 0.68)
- Race & ethnicity
- Hispanic / Latino 38% White 36% Black 21% Two or more races 12% Asian 2% Native American 1%
- Hispanic origin (detail)
- Mexican 29% Puerto Rican 7%
- Common ancestry
- Romanian 6% Italian 2% Lithuanian 1%
- Foreign-born
- 8% · Canada, China
- Languages at home
- 78% English-only · Spanish 19% Chinese 1%
Political lean MEDSL · Lake
- 2024 margin
- Lean D (+5.6) · D 52.1% · R 46.5% · Other 1.5%
- 2008→2024 swing
- -28.6pp toward R · 2008: 34.3pp · 2024: 5.6pp
- All cycles
- 2024: D+5.6 2020: D+15.1 2016: D+20.6 2012: D+31.0 2008: D+34.3
Not yet ingested
- Civics
- —
Market trends
- HPI YoY
- ▼ -67.70%
- Current HPI
- 293.4702
- Rent YoY
- —
- Metro
- Chicago-Naperville-Elgin, IL-IN-WI
- State GDP YoY
- ▲ 2.90%
- F500 in state
- 18
Industry mix (Fortune 500 HQ in IN)
| Industry | F500 HQs | Revenue |
|---|---|---|
| Industrial Machinery | 2 | $37B |
|
||
| Healthcare | 1 | $177B |
|
||
| Pharmaceuticals | 1 | $45B |
|
||
| Metals / Steel | 1 | $18B |
|
||
| Agriculture | 1 | $17B |
|
||
| Packaging | 1 | $12B |
|
||
Price history
2 events — show timeline
- 2026-05-22 Pending — NIRA MLS as Distributed by MLS Grid
- 2026-05-13 Listed $120,000 NIRA MLS as Distributed by MLS Grid
Property tax history
-0.0%/yrLatest (2024): $666 · +2.0% YoY. Source: county tax records.
Cash-flow waterfall
monthlySold comps — $/sqft
last 12 mo · ≤1 miLoading sold comps…