3507 Southland Dr Unit N/A · Tallahassee, FL
Flood risk 1/10 · Minimal
- FEMA flood zone
- X (unshaded)
- Chance of flooding over 30 yrs
- 0.0%
- Est. flood insurance / yr
- $507 – $1,088
Fire risk 4/10 · Minor
- Est. fire insurance / yr
- $947 – $1,759
Heat risk 8/10 · Major
- Hot days now (above 109°F)
- 7 days/yr
- Hot days in 30 yrs
- 20 days/yr
Wind risk 9/10 · Severe
- Chance of severe wind over 30 yrs
- 99.0%
Air-quality risk 4/10 · Minor
- Unhealthy air days now
- 5 days/yr
- Unhealthy air days in 30 yrs
- 6 days/yr
Risk factors via First Street. Map © Google.
Why this score? — see what drove the C grade
The composite is a weighted blend of 9 inputs, each scored 0–100. Each bar is that input's sub-score; the figure is the points it added to the 100-point composite (weight × sub-score).
- Cash flow +22.9/30.0
- ARV discount +7.5/15.0
- DSCR +7.4/10.0
- 1% rule +6.0/10.0
- Schools +4.3/10.0
- Livability +4.3/5.0
- Condition / age +3.8/5.0
- Rent growth +2.5/5.0
- Appreciation +0.0/10.0
$169,900
🖨 Deal sheet 📄 Offer letter ✓ Due diligence
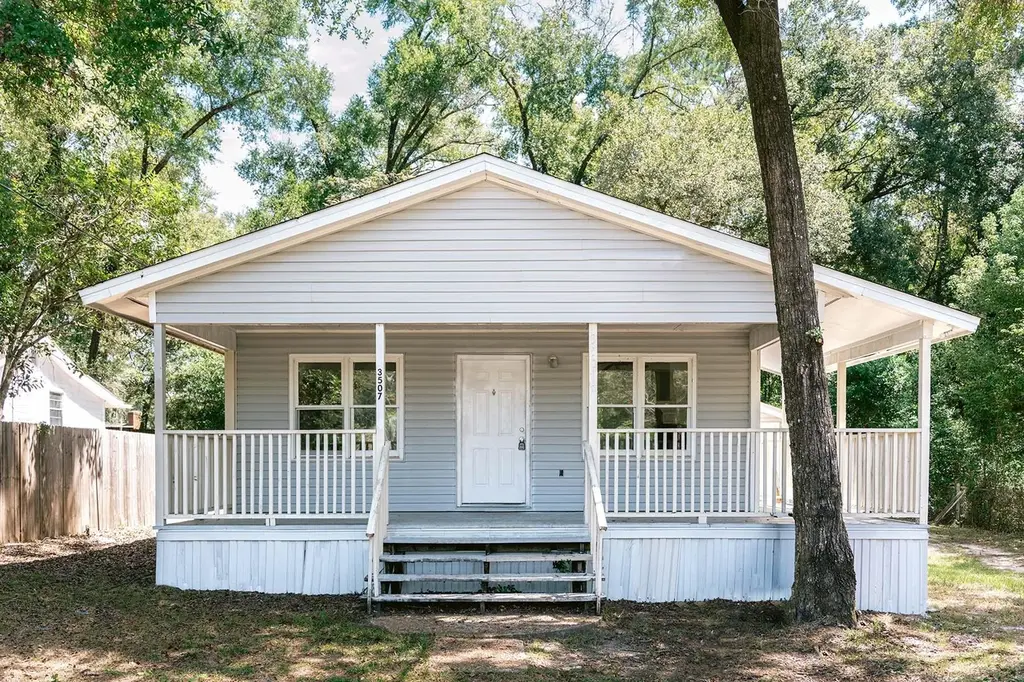
Listing remarks
Brand new architectural shingled roof! Spacious duplex on a large lot at the end of a dead-end street. Freshly painted with new flooring in both units.
Key facts
- Large lot
- Dead-end street
- Built 1973
Tags
Property features AI
Finance
- Financial info: Property is for sale; Twelve-month lease term indicated for rentals; Owner pays insurance, management, pest control, repairs, and taxes; Two-unit building with rental income shown (each unit currently rents for $1,000)
Exterior
- Parking: Unassigned parking
- Home design: Single-story building
- Construction: Frame construction; Vinyl siding; Wood siding
- Exterior features: Lot dimensions approximately 65 x 151 x 65 x 151
Interior
- Kitchen: Dishwasher; Microwave; Range; Refrigerator
- Bedrooms: Two-bedroom units (both units are 2 bedrooms)
- Bathrooms: Each unit has one full bathroom
- Heating & cooling: Central heating; Electric heating; Heat pump; Central air conditioning; Ceiling fans; Electric cooling
- Interior features: Fireplace
Neighborhood map
What this means for you Summary
Snapshot
- This is a 4-bed/2.0-bath condo listed at $170k. Condition is rated good.
Deal economics
- At list price, monthly cash flow is $299 ($4k/yr) — positive.
- The deal already cash-flows at list — no discount required.
- Meets the 1% rule at list price ($2k rent vs $170k).
- Recommended offer: $165k (3.0% below list) — sets the bar for market timing.
- Cap rate 8.4% vs local median 4.2% in Tallahassee — top-decile yield for the area; either an underpriced asset or a hidden risk that comps aren't pricing in. Stress-test before assuming the spread holds.
Location & tenants
- Location reads 86/100 on livability (#19 in FL, #429 nationally) — a professional / high-income tenant draw. Strengths: amenities A+, commute A+, health & safety A+; Watch: employment D.
- Leon (urban): math 48% / reading 53% proficiency, ranked #33 of 73 in FL (top 45%) — acceptable for families but not a draw, mixed tenant base, ~2y average lease.
- Market conditions: 105 active listings in the ZIP; 3 comparable units currently listed for rent nearby; rentals leasing fast (median 14d on market — plan ~1-2 weeks tenant-placement turnaround); 1,765 units permitted in Leon County in 2024 (975 in 5+ unit buildings).
- At $1,865/mo this rent would consume 47% of the median local household income ($48k/yr) (locally 654% of renters already pay >50% of income on rent) — very limited rent-growth headroom before tenants either downsize or default.
Forward outlook
- Local home prices are declining (-3.0%/yr); year-one equity from $1k of loan paydown is wiped out by about $5k of value loss. Plan a longer hold.
- Leon County population projected at +23% by 2050 — long-run rental-demand tailwind backs the buy-and-hold thesis.
Negotiation context
- It's been on market 38 days — a 3% lower offer ($165k) is reasonable based on typical stale-listing flexibility.
- 4 sale attempts with the ask held roughly flat each time — persistent listings suggest the price (not the market) is what's stuck; bring a comps-based counter.
Risks & watch-outs
- Climate carrying-cost: severe wind risk, 99% chance of damaging wind over 30y; extreme-heat days projected 7→20/yr by 2055 (HVAC capex compounding) — expect insurance premiums to compound above CPI over the hold.
Questions for the listing agent
- It's been on market 38 days. Have you received any prior offers? Is the seller open to a 3% concession, seller financing, or rate buy-down credit?
- Built in 1973 — when were the roof, HVAC, electrical panel, plumbing, and water heater last replaced?
- Any open or pending special assessments — roof, HVAC, plumbing, elevator, façade? What's the per-unit balance and payoff schedule, and is the seller paying it off at close or rolling it to the buyer?
- Is there a deadline driving the sale (1031 exchange, divorce, estate, relocation)? That informs how much negotiation room exists.
- Schools are B-rated — typically a magnet for longer-tenancy family renters. What's the average tenant stay here, and is there a school-zone premium baked into asking?
- What's the average days-on-market for RENTAL listings here right now (not sales)? A rising rental-DOM trend means longer vacancies and softer asking-rent achievability than the comps imply.
- What's the recent tenant-quality profile in this submarket — average credit score on applications, eviction rate, late-payment / NSF rate, and stable-employment percentage? A property-management company in the area should have these aggregated.
- How much new apartment / multifamily construction is in the pipeline within 1–3 miles? Heavy new supply (>2% of stock underway) typically softens rents 12–24 months out; light construction supports rent growth.
Investment metrics
- 1% rule
- 1.10% ✓
- Cap rate
- 8.41%
- Cash-on-cash
- 7.55%
- DSCR
- 1.34
- GRM
- 7.6
CMA / ARV
No comps found within radius.
Projected returns pro-forma
-3.0% appreciation · 3.0% rent growth · sell at horizon
- IRR
- -4.7%
- Equity multiple
- 0.82×
- Total profit
- $-8,436
- Equity at exit
- $25,333
- IRR
- 4.9%
- Equity multiple
- 1.36×
- Total profit
- $17,321
- Equity at exit
- $14,690
Cash invested: $47,572 (down + closing). Projections, not guarantees.
Landlord ↔ Tenant lean methodology
- Overall (STATE)
- 87 Strongly Landlord-Friendly
- State Florida
- 87 Strongly Landlord-Friendly · R+3
- County
- — inherits STATE
- City
- — inherits STATE
ZIP-level market 32305
- Home prices YoY
- -22.5%
- Active inventory
- 105
- Price-to-rent
- 7.6×
Monthly cashflow live
- Estimated rent
- $1,865 medium interval (Pro) →
- Mortgage (P&I)
- −$891
- Tax est. 1.5%
- −$212 /mo · $2,548/yr
- Insurance
- −$71
- HOA
- −$0
- Vacancy / Maint / Mgmt
- −$392
- Net cashflow
- $299
Break-even live
UW: 25.0% down · 7.5% · 30yr · 1.5% tax · 5.0% vac · 8.0% maint · 8.0% mgmt
Financing live
Cash to close
- Down payment
- $42,475
- Closing costs
- $5,097
- Reserves months
- —
- Total cash needed
- —
Loan-product check · same deal, 3 products live
Conventional
25% down · 7.5% · 30yr
- Down + closing
- —
- Monthly P&I
- —
- Monthly cashflow
- —
- DSCR
- —
- Eligible?
- —
Personal DTI + credit; lowest rate.
DSCR
20% down · 8.5% · 30yr
- Down + closing
- —
- Monthly P&I
- —
- Monthly cashflow
- —
- DSCR
- —
- Eligible?
- —
No personal income docs; deal must DSCR.
Hard money
10% down · 12.0% · 12mo
- Down + closing
- —
- Monthly P&I
- —
- Monthly cashflow
- —
- DSCR
- —
- Eligible?
- —
Short-term bridge; refi at stabilization.
Rent comps 3 comps
| Address | Beds | Baths | Sqft | Rent | $/sqft | DOM | Units | Dist |
|---|---|---|---|---|---|---|---|---|
| 916 Saddle Creek Run Tallahassee, FL | 4.0 | 2.0 | 1399 | $1,750 | $1.25 | 13d | 1 | 0.60mi |
| 3000 S Adams St Tallahassee, FL | 1.0–3.0 | 1.0–3.0 | 884 | $1,850 | $2.09 | 21d | 8 | 1.08mi |
| 735 Putnam Dr #2 Tallahassee, FL | 3.0 | 2.5 | 1396 | $1,650 | $1.18 | 13d | 1 | 1.33mi |
HOA detail condo
- Monthly dues
- $0 · $0/yr
- Assessments
- None detected in remarks — confirm with the listing agent.
Listing history 24 events
-
2026-06-18days on market $169,900 Active 38 DOM
-
2026-06-17days on market $169,900 Active 37 DOM
-
2026-06-16days on market $169,900 Active 36 DOM
-
2026-06-15days on market $169,900 Active 35 DOM
-
2026-06-14days on market $169,900 Active 33 DOM
-
2026-06-10days on market $169,900 Active 30 DOM
-
2026-06-09days on market $169,900 Active 29 DOM
-
2026-06-08days on market $169,900 Active 28 DOM
-
2026-06-07days on market $169,900 Active 27 DOM
-
2026-06-05days on market $169,900 Active 24 DOM
-
2026-06-03days on market $169,900 Active 23 DOM
-
2026-06-02days on market $169,900 Active 22 DOM
-
2026-06-01days on market $169,900 Active 21 DOM
-
2026-05-31days on market $169,900 Active 20 DOM
-
2026-05-30days on market $169,900 Active 19 DOM
-
2026-05-11$169,900 Active
-
2026-02-25historical
-
2026-02-04price $139,990
-
2026-01-17status Active
-
2025-12-18historical Active Under Contract
-
2025-11-10price $150,000
-
2025-10-30status Active
-
2025-10-03historical Contingent
-
2025-09-25$159,900 Active
ⓘ Source: listings_history table (triggers on properties + properties_extension) + one-shot
backfill from property_details.listing_events for pre-trigger history.
Climate risk First Street
- Flood 1/10 Low FEMA zone X (unshaded) · 0% chance over 30 yrs
- Wildfire 4/10 Moderate
- Heat 8/10 Severe 7 d/yr ≥109°F today · 20 d/yr by 30 yrs out
- Wind 9/10 Extreme 99% chance of damaging wind over 30 yrs
- Air quality 4/10 Moderate 5 unhealthy d/yr today · 6 by 30 yrs out
Nearby sold comps map
Loading sold comps map…
Walkable amenities ~0.75 mi
Loading nearby amenities…
Taxation est. · year 1
- Rental income
- $22,383
- − Mortgage interest
- −$9,517
- − Property taxes
- −$2,548
- − Insurance
- −$850
- − Repairs & maintenance
- −$1,791
- − Management
- −$1,791
- − Depreciation
- −$4,943
- Taxable income
- $944
- Est. tax owed @ 24.0%
- −$226
- After-tax cash flow
- $3,366/yr
For passive investors: Depreciation is non-cash, so a rental often shows a tax loss while cash-flowing — sheltering income. Rental losses are passive: they offset passive income freely, and up to $25,000/yr can offset ordinary (W-2) income if you actively participate and your MAGI is under $100k (phasing out to $0 by $150k); unused losses carry forward. On sale, claimed depreciation is recaptured at up to 25%, and gains may owe capital-gains tax (a 1031 exchange can defer both). Figures are a year-1 estimate at your 24.0% rate — not tax advice; consult a CPA.
Condition & rehab AI · 3 photos
A well-maintained, freshly painted, and newly roofed duplex with good curb appeal and potential for further updates to increase value.
Value-add opportunities
- Both Painting exterior trim and siding — Enhances curb appeal and value
- Both Upgrading kitchen appliances — Modernizes the space and attracts buyers
- Both Refrigerator replacement — Improves functionality and appeal
- Both Bathroom updates — Enhances functionality and appeal
Renovation cost estimate screening
Value-add ROI direction
- Both Painting exterior trim and siding — Enhances curb appeal and value ↑
- Both Upgrading kitchen appliances — Modernizes the space and attracts buyers ↑
- Both Refrigerator replacement — Improves functionality and appeal ↑
- Both Bathroom updates — Enhances functionality and appeal ↑
ⓘ Cost ranges are severity-bucket heuristics (US national rule-of-thumb). Get contractor quotes + a written scope before underwriting a rehab budget.
Schools (NCES district)
- District
- Leon
- NCES district ID
- 1201110
- Math proficiency
- 48% ▼ -13.00%
- Reading proficiency
- 53% ▼ -5.00%
- Median HH income
- $46,339
- Composite
- 42.84/100
- National rank
- #3131
- State rank
- #33 of 73 in FL
Livability — Tallahassee
- Score
- 86/100
- State rank
- #19
- US rank
- #429
Category grades
Schools grade is shown separately in the Schools card above.
Census & demographics
- Census place
- Tallahassee, FL
- County
- Leon County · 294,472 people
- City population
- 294,472
- Metro
- Tallahassee, FL
- Population (ZIP)
- 19,384
- Household income
- $48,045
- Rent vs Own
- Severe rent burden
- 654.0
Population outlook (Leon County) Hauer SSP2
- Today (2025)
- 315,507 people
- By 2030
- 330,677 · +4.8%
- By 2040
- 358,465 · +13.6%
- By 2050
- 386,804 · +22.6%
- By 2075
- 465,480 · +47.5%
- By 2100
- 519,959 · +64.8%
Race, ethnicity, and origin ACS 2023
- Neighborhood character
- Diverse neighborhood (Simpson 0.57)
- Race & ethnicity
- Black 57% White 33% Two or more races 5% Hispanic / Latino 5% Asian 1%
- Common ancestry
- Serbian 1% Hispanic 1% Iranian 1%
- Foreign-born
- 3% · Canada
- Languages at home
- 94% English-only · Spanish 5% Other Indo-European 1%
Political lean MEDSL · Leon
- 2024 margin
- Strong D (+21.8) · D 60.3% · R 38.5% · Other 1.2%
- 2008→2024 swing
- -2.5pp toward R · 2008: 24.3pp · 2024: 21.8pp
- All cycles
- 2024: D+21.8 2020: D+28.3 2016: D+25.1 2012: D+23.6 2008: D+24.3
Not yet ingested
- Civics
- —
Market trends
- HPI YoY
- ▼ -63.40%
- Current HPI
- 218.4834
- Rent YoY
- —
- Metro
- Tallahassee, FL
- State GDP YoY
- ▲ 3.28%
- F500 in state
- 36
Industry mix (Fortune 500 HQ in FL)
| Industry | F500 HQs | Revenue |
|---|---|---|
| Industrial Technology | 2 | $29B |
|
||
| Insurance | 2 | $17B |
|
||
| Retail | 1 | $60B |
|
||
| Technology Distribution | 1 | $58B |
|
||
| Homebuilding | 1 | $35B |
|
||
| Technology Manufacturing | 1 | $35B |
|
||
Price history
+6.3% since first listed9 events — show timeline
- 2026-05-11 Listed $169,900 CATRS
- 2026-02-25 Listing Removed — CATRS
- 2026-02-04 Price Changed $139,990 CATRS
- 2026-01-17 Relisted — CATRS
- 2025-12-18 Contingent — CATRS
- 2025-11-10 Price Changed $150,000 CATRS
- 2025-10-30 Relisted — CATRS
- 2025-10-03 Contingent — CATRS
- 2025-09-25 Listed $159,900 CATRS
Cash-flow waterfall
monthlySold comps — $/sqft
last 12 mo · ≤1 miLoading sold comps…