1900 W University Blvd #1004 · Brownsville, TX
Flood risk No data
- FEMA flood zone
- —
- Chance of flooding over 30 yrs
- —
- Est. flood insurance / yr
- —
Fire risk No data
- Est. fire insurance / yr
- —
Heat risk No data
- Hot days now (above threshold)
- —
- Hot days in 30 yrs
- —
Wind risk No data
- Chance of severe wind over 30 yrs
- —
Air-quality risk No data
- Unhealthy air days now
- —
- Unhealthy air days in 30 yrs
- —
Risk factors via First Street. Map © Google.
Why this score? — see what drove the C grade
The composite is a weighted blend of 9 inputs, each scored 0–100. Each bar is that input's sub-score; the figure is the points it added to the 100-point composite (weight × sub-score).
- Cash flow +23.1/30.0
- ARV discount +7.5/15.0
- DSCR +7.4/10.0
- 1% rule +6.0/10.0
- Livability +4.0/5.0
- Condition / age +4.0/5.0
- Rent growth +3.2/5.0
- Schools +2.2/10.0
- Appreciation +0.0/10.0
$114,900
🖨 Deal sheet 📄 Offer letter ✓ Due diligence
Listing remarks
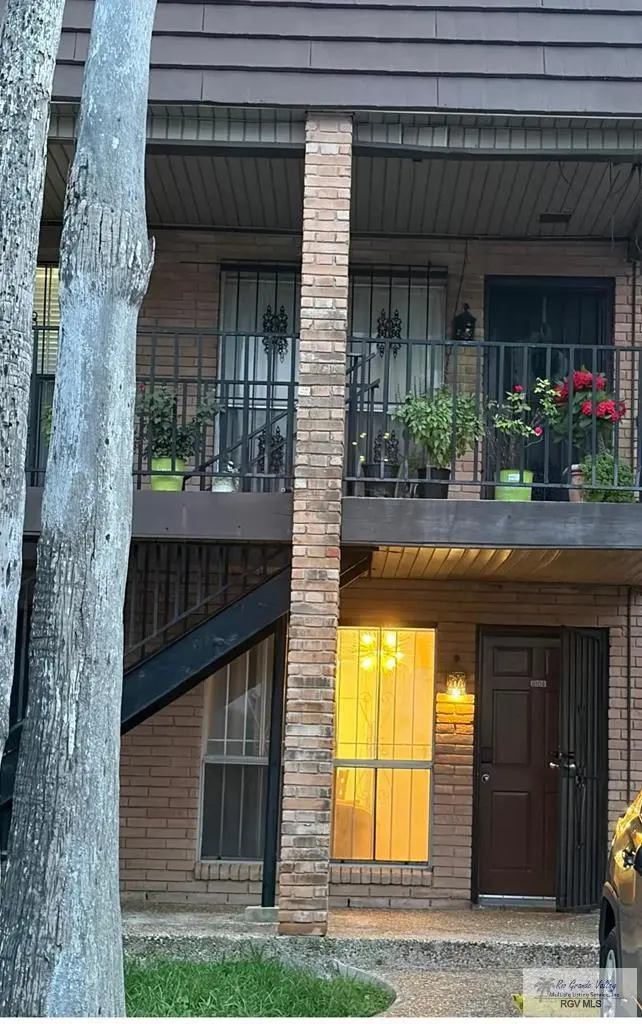
Discover Fort Brown Villas Condos—an income-ready, furnished downstairs unit in a rare, high-demand spot. Enjoy serene resaca views and a prime location across from UTRGV and TSC, walking distance to downtown dining, shopping, entertainment and the international border. Perfect for Airbnb or student housing, this condo offers strong rental potential and steady occupancy. You're roughly about 25-35 minutes to South Padre Island and SpaceX. Unbeatable weekend escapes and excitement. Turnkey with appliances, furniture, everything stays behind except personal items—move right in or start earning on day one.
Key facts
- Serene resaca views
- Prime location
- Pool
Tags
Property features AI
Finance
- HOA & community: Homeowners association with monthly fees
Exterior
- Security: Smoke detectors
- Utilities: Public sewer
- Home design: Condominium; Single-story
- Construction: Brick veneer exterior; Slab foundation
- Exterior features: Covered patio/porch; In-ground pool
Interior
- Bathrooms: 1 full bathroom
- Interior features: Electric water heater; Ceiling fans; Central air; Central electric heating
Neighborhood map
What this means for you Summary
Snapshot
- This is a 2-bed/1.0-bath condo listed at $115k. Condition is rated good.
Deal economics
- At list price, monthly cash flow is $206 ($2k/yr) — positive.
- The deal already cash-flows at list — no discount required.
- Meets the 1% rule at list price ($1k rent vs $115k).
- Recommended offer: $113k (1.5% below list) — sets the bar for market timing.
- Cap rate 8.4% vs local median 5.0% in Brownsville — top-decile yield for the area; either an underpriced asset or a hidden risk that comps aren't pricing in. Stress-test before assuming the spread holds.
Location & tenants
- Location reads 79/100 on livability (#62 in TX, #2,311 nationally) — a middle-class / working-renter tenant base. Strengths: commute A+, cost of living A+, housing A+; Watch: amenities D, crime D-, employment F.
- Brownsville ISD (urban): math 20% / reading 34% proficiency, ranked #710 of 826 in TX (top 86%) — low school quality limits family demand, transient renter base, plan for 1-2y turnover; 83% free/reduced lunch — lower-income household profile, screen leases tightly.
- Zoned schools: Putegnat El (math 8% / reading 8%, grade F, #4,301 of 4,322 statewide, top 100%, 478 students, 98% FRL); Faulk Middle (math 20% / reading 31%, grade F, #1,236 of 1,662 statewide, top 76%, 976 students, 99% FRL); Porter Early College H S (math 23% / reading 32%, grade F, #1,183 of 1,632 statewide, top 73%, 1,814 students, 94% FRL).
- Market conditions: Rents rising (+2.8%/yr); 413 active listings in the ZIP; 15 comparable units currently listed for rent nearby; rentals lingering (median 44d on market — plan ~5-8 weeks vacancy on turnover, expect pricing pressure); 87% of comp listings sitting > 30 days — soft ceiling on asking rent; 2,326 units permitted in Cameron County in 2024 (503 in 5+ unit buildings).
Forward outlook
- Local home prices are declining (-3.0%/yr); year-one equity from $794 of loan paydown is wiped out by about $3k of value loss. Plan a longer hold.
- Cameron County population projected at +3% by 2050 — modest demand growth; plan on rents tracking national, not racing it.
Negotiation context
- It's been on market 23 days — a 2% lower offer ($113k) is reasonable based on typical stale-listing flexibility.
Questions for the listing agent
- Any open or pending special assessments — roof, HVAC, plumbing, elevator, façade? What's the per-unit balance and payoff schedule, and is the seller paying it off at close or rolling it to the buyer?
- Is there a deadline driving the sale (1031 exchange, divorce, estate, relocation)? That informs how much negotiation room exists.
- Crime grade is D in this area — have there been break-ins, vandalism, or insurance claims at this property in the last 3 years? What carrier currently insures it and at what premium?
- What's the average days-on-market for RENTAL listings here right now (not sales)? A rising rental-DOM trend means longer vacancies and softer asking-rent achievability than the comps imply.
- What's the recent tenant-quality profile in this submarket — average credit score on applications, eviction rate, late-payment / NSF rate, and stable-employment percentage? A property-management company in the area should have these aggregated.
- How much new apartment / multifamily construction is in the pipeline within 1–3 miles? Heavy new supply (>2% of stock underway) typically softens rents 12–24 months out; light construction supports rent growth.
Investment metrics
- 1% rule
- 1.10% ✓
- Cap rate
- 8.45%
- Cash-on-cash
- 7.70%
- DSCR
- 1.34
- GRM
- 7.6
CMA / ARV
No comps found within radius.
Projected returns pro-forma
-3.0% appreciation · 2.77% rent growth · sell at horizon
- IRR
- -4.8%
- Equity multiple
- 0.82×
- Total profit
- $-5,747
- Equity at exit
- $17,132
- IRR
- 4.6%
- Equity multiple
- 1.34×
- Total profit
- $10,805
- Equity at exit
- $9,934
Cash invested: $32,172 (down + closing). Projections, not guarantees.
Landlord ↔ Tenant lean methodology
- Overall (STATE)
- 87 Strongly Landlord-Friendly
- State Texas
- 87 Strongly Landlord-Friendly · R+5
- County
- — inherits STATE
- City
- — inherits STATE
ZIP-level market 78526
- Home prices YoY
- -12.1%
- Rents YoY
- 2.8%
- Active inventory
- 413
- Price-to-rent
- 7.6×
Monthly cashflow live
- Estimated rent
- $1,266 high interval (Pro) →
- Mortgage (P&I)
- −$603
- Tax est. 1.5%
- −$144 /mo · $1,724/yr
- Insurance
- −$48
- HOA
- −$0
- Vacancy / Maint / Mgmt
- −$266
- Net cashflow
- $206
Break-even live
UW: 25.0% down · 7.5% · 30yr · 1.5% tax · 5.0% vac · 8.0% maint · 8.0% mgmt
Financing live
Cash to close
- Down payment
- $28,725
- Closing costs
- $3,447
- Reserves months
- —
- Total cash needed
- —
Loan-product check · same deal, 3 products live
Conventional
25% down · 7.5% · 30yr
- Down + closing
- —
- Monthly P&I
- —
- Monthly cashflow
- —
- DSCR
- —
- Eligible?
- —
Personal DTI + credit; lowest rate.
DSCR
20% down · 8.5% · 30yr
- Down + closing
- —
- Monthly P&I
- —
- Monthly cashflow
- —
- DSCR
- —
- Eligible?
- —
No personal income docs; deal must DSCR.
Hard money
10% down · 12.0% · 12mo
- Down + closing
- —
- Monthly P&I
- —
- Monthly cashflow
- —
- DSCR
- —
- Eligible?
- —
Short-term bridge; refi at stabilization.
Rent comps 15 comps
| Address | Beds | Baths | Sqft | Rent | $/sqft | DOM | Units | Dist |
|---|---|---|---|---|---|---|---|---|
| 1900 W University Blvd #3012 Brownsville, TX | 2.0 | 2.0 | 980 | $1,000 | $1.02 | 43d | 1 | 0.07mi |
| 1900 W University Blvd Brownsville, TX | 2.0 | 1.0 | 950 | $1,300 | $1.37 | 43d | 1 | 0.07mi |
| 801 International Blvd Ste B Brownsville, TX | 1.0 | 1.0 | 1092 | $950 | $0.87 | 43d | 1 | 0.27mi |
| 1234 E Jackson St Brownsville, TX | 2.0 | 1.0 | 640 | $800 | $1.25 | 43d | 1 | 0.50mi |
| 913 E Jefferson St Unit D Brownsville, TX | 2.0 | 2.0 | 1052 | $1,400 | $1.33 | 21d | 1 | 0.60mi |
| 634 E 6th St Apt 2 Brownsville, TX | 2.0 | 1.0 | 713 | $1,000 | $1.40 | 43d | 1 | 0.81mi |
| 305 Calle Amistosa Unit L502 Brownsville, TX | 1.0 | 1.0 | 753 | $1,300 | $1.73 | 43d | 1 | 0.90mi |
| 424 E Levee St Unit 1 & 4 Brownsville, TX | 1.0 | 1.0 | 600 | $650 | $1.08 | 13d | 1 | 0.92mi |
| 424 E Levee St Unit 7 Brownsville, TX | 1.0 | 1.0 | 600 | $650 | $1.08 | 43d | 1 | 0.92mi |
| 351 E Saint Charles St Brownsville, TX | 1.0 | 1.0 | 650 | $650 | $1.00 | 43d | 1 | 0.96mi |
| 221 E 3rd St Brownsville, TX | 2.0 | 1.0 | 850 | $1,325 | $1.56 | 43d | 1 | 1.03mi |
| 219 E 3rd St Brownsville, TX | 2.0 | 1.0 | 900 | $1,275 | $1.42 | 43d | 1 | 1.03mi |
| 1800 Palm Blvd Unit 101 Brownsville, TX | 2.0 | 1.0 | 575 | $1,050 | $1.83 | 43d | 1 | 1.38mi |
| 230 W Jefferson St Brownsville, TX | 2.0 | 1.0 | 840 | $795 | $0.95 | 43d | 1 | 1.38mi |
| 508 Truman Dr Unit B Brownsville, TX | 3.0 | 1.0 | 960 | $975 | $1.02 | 43d | 1 | 1.48mi |
HOA detail condo
- Monthly dues
- $0 · $0/yr
- Assessments
- None detected in remarks — confirm with the listing agent.
Listing history 18 events
-
2026-06-18days on market $114,900 Active 23 DOM
-
2026-06-17days on market $114,900 Active 22 DOM
-
2026-06-16days on market $114,900 Active 21 DOM
-
2026-06-15days on market $114,900 Active 20 DOM
-
2026-06-14days on market $114,900 Active 18 DOM
-
2026-06-13days on market $114,900 Active 17 DOM
-
2026-06-10days on market $114,900 Active 15 DOM
-
2026-06-09days on market $114,900 Active 14 DOM
-
2026-06-08days on market $114,900 Active 13 DOM
-
2026-06-07days on market $114,900 Active 12 DOM
-
2026-06-05days on market $114,900 Active 9 DOM
-
2026-06-03days on market $114,900 Active 8 DOM
-
2026-06-02days on market $114,900 Active 7 DOM
-
2026-06-01days on market $114,900 Active 6 DOM
-
2026-06-01remarks 610-char remark
-
2026-05-31days on market $114,900 Active 5 DOM
-
2026-05-30days on market $114,900 Active 4 DOM
-
2026-05-27$114,900 Active
ⓘ Source: listings_history table (triggers on properties + properties_extension) + one-shot
backfill from property_details.listing_events for pre-trigger history.
Nearby sold comps map
Loading sold comps map…
Walkable amenities ~0.75 mi
Loading nearby amenities…
Taxation est. · year 1
- Rental income
- $15,196
- − Mortgage interest
- −$6,436
- − Property taxes
- −$1,724
- − Insurance
- −$574
- − Repairs & maintenance
- −$1,216
- − Management
- −$1,216
- − Depreciation
- −$3,343
- Taxable income
- $688
- Est. tax owed @ 24.0%
- −$165
- After-tax cash flow
- $2,311/yr
For passive investors: Depreciation is non-cash, so a rental often shows a tax loss while cash-flowing — sheltering income. Rental losses are passive: they offset passive income freely, and up to $25,000/yr can offset ordinary (W-2) income if you actively participate and your MAGI is under $100k (phasing out to $0 by $150k); unused losses carry forward. On sale, claimed depreciation is recaptured at up to 25%, and gains may owe capital-gains tax (a 1031 exchange can defer both). Figures are a year-1 estimate at your 24.0% rate — not tax advice; consult a CPA.
Condition & rehab AI · 10 photos
This turnkey condo is in excellent condition with a good rental potential. It offers serene views and is located in a high-demand area.
Value-add opportunities
- Both Paint exterior trim — Enhances curb appeal and resale value
- Both Clean gutters — Improves drainage and prevents water damage
Renovation cost estimate screening
Value-add ROI direction
- Both Paint exterior trim — Enhances curb appeal and resale value ↑
- Both Clean gutters — Improves drainage and prevents water damage ↑
ⓘ Cost ranges are severity-bucket heuristics (US national rule-of-thumb). Get contractor quotes + a written scope before underwriting a rehab budget.
Schools (NCES district)
- District
- Brownsville ISD
- NCES district ID
- 4811680
- Math proficiency
- 20% ▼ -36.00%
- Reading proficiency
- 34% ▼ -13.00%
- Median HH income
- $30,490
- Composite
- 21.8/100
- National rank
- #8249
- State rank
- #710 of 826 in TX
Livability — Brownsville
- Score
- 79/100
- State rank
- #62
- US rank
- #2311
Category grades
Schools grade is shown separately in the Schools card above.
Census & demographics
- Census place
- Brownsville, TX
- County
- Cameron County · 310,734 people
- City population
- 212,132
- Metro
- Brownsville-Harlingen, TX
- Population (ZIP)
- 60,012
- Household income
- $70,565
- Rent vs Own
- Severe rent burden
- 1063.0
Population outlook (Cameron County) Hauer SSP2
- Today (2025)
- 441,603 people
- By 2030
- 448,113 · +1.5%
- By 2040
- 456,385 · +3.3%
- By 2050
- 456,294 · +3.3%
- By 2075
- 423,851 · -4.0%
- By 2100
- 342,787 · -22.4%
Race, ethnicity, and origin ACS 2023
- Neighborhood character
- Predominantly Hispanic (93%)
- Race & ethnicity
- Hispanic / Latino 93% Two or more races 45% White 4% Asian 2%
- Hispanic origin (detail)
- Mexican 87%
- Foreign-born
- 25% · Canada, Vietnam
- Languages at home
- 19% English-only · Spanish 79% Tagalog/Filipino 1%
Political lean MEDSL · Cameron
- 2024 margin
- Lean R (+5.8) · D 46.7% · R 52.5%
- 2008→2024 swing
- -34.6pp toward R · 2008: 28.8pp · 2024: -5.8pp
- All cycles
- 2024: R+5.8 2020: D+13.2 2016: D+32.5 2012: D+32.4 2008: D+28.8
Not yet ingested
- Civics
- —
Market trends
- HPI YoY
- ▼ -30.28%
- Current HPI
- 220.5233
- Rent YoY
- ▲ 2.77%
- Metro
- Brownsville-Harlingen, TX
- State GDP YoY
- ▲ 3.95%
- F500 in state
- 110
Industry mix (Fortune 500 HQ in TX)
| Industry | F500 HQs | Revenue |
|---|---|---|
| Energy | 16 | $1,198B |
|
||
| Technology | 5 | $198B |
|
||
| Engineering / Construction | 4 | $72B |
|
||
| Energy Services | 3 | $60B |
|
||
| Utilities | 3 | $41B |
|
||
| Healthcare | 2 | $330B |
|
||
Price history
1 event — show timeline
- 2026-05-27 Listed $114,900 RGVMLS
Cash-flow waterfall
monthlySold comps — $/sqft
last 12 mo · ≤1 miLoading sold comps…