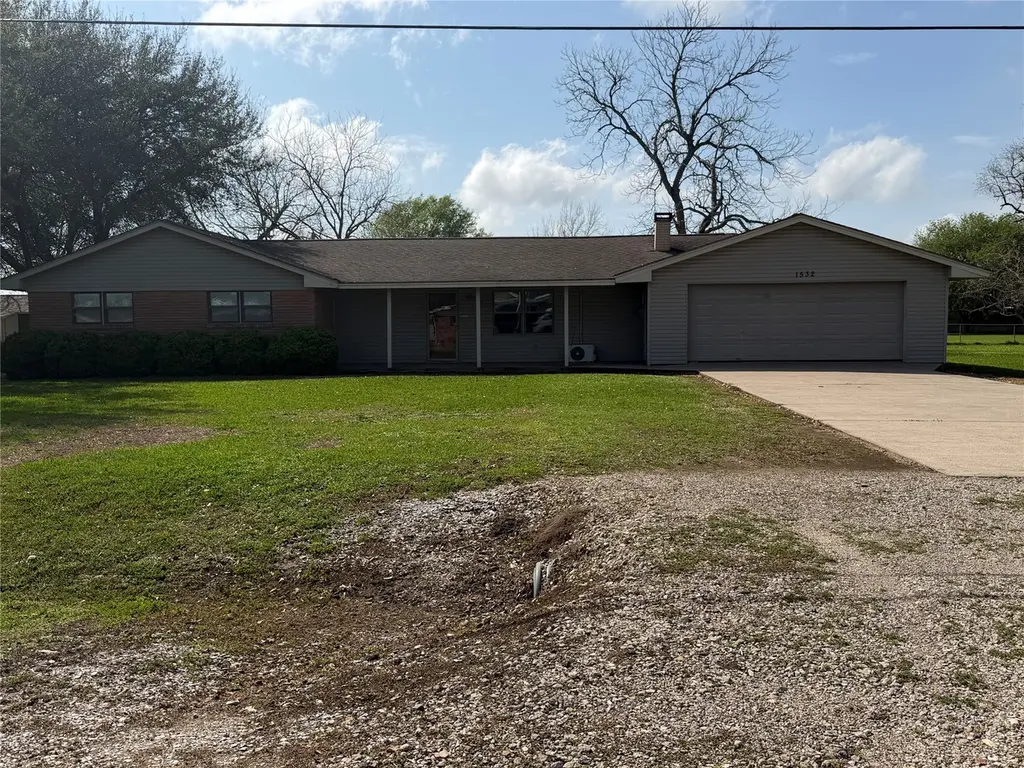
1532 Sunny Acres · Stowell, TX
Flood risk 4/10 · Minor
- FEMA flood zone
- X (unshaded)
- Chance of flooding over 30 yrs
- 0.24%
- Est. flood insurance / yr
- $507 – $1,088
Fire risk 3/10 · Minor
- Est. fire insurance / yr
- $1,222 – $2,270
Heat risk 9/10 · Severe
- Hot days now (above 110°F)
- 7 days/yr
- Hot days in 30 yrs
- 25 days/yr
Wind risk 9/10 · Severe
- Chance of severe wind over 30 yrs
- 99.0%
Air-quality risk 2/10 · Minimal
- Unhealthy air days now
- 0 days/yr
- Unhealthy air days in 30 yrs
- 1 days/yr
Risk factors via First Street. Map © Google.
Why this score? — see what drove the D grade
The composite is a weighted blend of 9 inputs, each scored 0–100. Each bar is that input's sub-score; the figure is the points it added to the 100-point composite (weight × sub-score).
- ARV discount +15.0/15.0
- Cash flow +9.4/30.0
- Schools +4.2/10.0
- 1% rule +4.0/10.0
- DSCR +2.6/10.0
- Livability +2.6/5.0
- Rent growth +2.5/5.0
- Condition / age +2.5/5.0
- Appreciation +0.0/10.0
$169,000
🖨 Deal sheet (PDF) 📄 Offer letter ✓ Due diligence
Listing remarks MLS
Spacious 3-bedroom, 2 1/2 bath home on a large lot with endless potential! Offering 2,121 sq ft, this property features a generous backyard, wood-burning fireplace, and great layout. Home will require renovations and is being sold AS IS, making it a perfect opportunity to create your dream space or investment property.
Key facts
- Large lot
- Generous backyard
- 0.73 acre lot
Tags
Neighborhood map
What this means for you Summary
Snapshot
- This is a 3-bed/2.5-bath single-family listed at $169k.
Deal economics
- At list price, monthly cash flow is $-121 ($-1k/yr) — negative.
- To cash-flow at today's rent, offer at most $148k (12.7% below list).
- To meet the 1% rule (rent ≥ 1% of price), the offer needs to be $152k (9.9% below list).
- Recommended offer: $148k (12.7% below list) — sets the bar for cash-flow.
Location & tenants
- Location reads 52/100 on livability (#1,466 in TX) — a working-class tenant base; expect higher turnover. Strengths: cost of living A+, crime A-; Watch: housing D, amenities F, commute F.
- East Chambers ISD (town): math 51% / reading 47% proficiency, ranked #199 of 826 in TX (top 24%) — families likely to look elsewhere, expect single-tenant / working-renter base with shorter leases.
- Zoned schools: East Chambers El (math 60% / reading 47%, grade C, #686 of 4,322 statewide, top 16%, 336 students, 64% FRL); East Chambers J H (math 42% / reading 46%, grade D, #512 of 1,662 statewide, top 32%, 357 students, 61% FRL); East Chambers H S (math 52% / reading 52%, grade D+, #447 of 1,632 statewide, top 29%, 451 students, 59% FRL).
- Market conditions: 73 active listings in the ZIP; 629 units permitted in Chambers County in 2024 (0 in 5+ unit buildings).
Forward outlook
- Local home prices are declining (-3.0%/yr); year-one equity from $1k of loan paydown is wiped out by about $5k of value loss. Plan a longer hold.
- Chambers County population projected at +46% by 2050 — long-run rental-demand tailwind backs the buy-and-hold thesis.
Negotiation context
- It's been on market 94 days — a 9% lower offer ($154k) is reasonable based on typical stale-listing flexibility.
Risks & watch-outs
- Watch-outs: property tax is 2.6% of price.
- Climate carrying-cost: severe wind risk, 99% chance of damaging wind over 30y; extreme-heat days projected 7→25/yr by 2055 (HVAC capex compounding) — expect insurance premiums to compound above CPI over the hold.
Questions for the listing agent
- What do current leases actually rent for vs. the listed asking? Can we see a recent rent roll and the last 12 months of T-12 income?
- It's been on market 94 days. Have you received any prior offers? Is the seller open to a 13% concession, seller financing, or rate buy-down credit?
- Built in 1962 — when were the roof, HVAC, electrical panel, plumbing, and water heater last replaced?
- Property tax is high relative to price — has the assessment been appealed recently, and will the sale trigger a re-assessment?
- Why hasn't it sold? Are there any deal-killer items the seller is aware of (foundation, flood, title, zoning, code violations)?
- Is there a deadline driving the sale (1031 exchange, divorce, estate, relocation)? That informs how much negotiation room exists.
- Schools are F-rated, which usually means shorter tenancies and higher turnover. Who's the typical renter profile here, and what's been the actual vacancy rate?
- The area grade is low — what's the realistic commute time and amenity access for the typical tenant pool here? Any planned neighborhood developments (good or bad) we should know about?
- What's the average days-on-market for RENTAL listings here right now (not sales)? A rising rental-DOM trend means longer vacancies and softer asking-rent achievability than the comps imply.
- What's the recent tenant-quality profile in this submarket — average credit score on applications, eviction rate, late-payment / NSF rate, and stable-employment percentage? A property-management company in the area should have these aggregated.
- How much new for-sale + rental construction is in the pipeline within 1–3 miles? Heavy new supply typically softens prices + rents 12–24 months out; constrained supply supports both.
Investment metrics
- 1% rule
- 0.90% ✗
- Cap rate
- 5.43%
- Cash-on-cash
- -3.07%
- DSCR
- 0.86
- GRM
- 9.3
CMA / ARV
- ARV (median comp)
- $243,173
- List price
- $169,000
- Delta
- -30.50%
- Verdict
- UNDERPRICED
- Comps
- 20 within 1.0 mi
Show comp detail 8 sales within ~0.75 mi
| Address | Dist | Beds/Ba | Sqft | Sold | Price | $/sf | Match |
|---|---|---|---|---|---|---|---|
| 1526 Campbell Rd | 0.08mi | 3/2.0 | 1,674 (-4%) | 2mo | $310,000 | $185 | 87 |
| 704 Cook Rd | 0.43mi | 3/3.0 | 1,780 (+2%) | 5mo | $175,000 | $98 | 70 |
| 737 Carolyn St | 0.45mi | 3/2.0 | 1,680 (-3%) | 12mo | $270,000 | $161 | 62 |
| 137 Ogden Rd | 0.55mi | 3/2.0 | 1,639 (-6%) | 13mo | $215,000 | $131 | 52 |
| 623 Catherine St | 0.33mi | 3/2.0 | 1,536 (-12%) | 16mo | $255,000 | $166 | 50 |
| 736 Carolyn St | 0.42mi | 4/2.0 (+1) | 1,829 (+5%) | 23mo | $184,900 | $101 | 46 |
| 224 Freeman St | 0.65mi | 3/2.0 | 1,701 (-2%) | 23mo | $185,000 | $109 | 45 |
| 244 Mcbride St | 0.74mi | 3/2.0 | 1,754 (+1%) | 22mo | $279,900 | $160 | 43 |
Match score weights: distance 35% · size 25% · config 20% · recency 20%. Top-matched comps best support the ARV.
Projected returns pro-forma
-3.0% appreciation · 3.0% rent growth · sell at horizon
- IRR
- -21.3%
- Equity multiple
- 0.26×
- Total profit
- $-34,980
- Equity at exit
- $25,198
- IRR
- -14.7%
- Equity multiple
- 0.16×
- Total profit
- $-39,910
- Equity at exit
- $14,612
Cash invested: $47,320 (down + closing). Projections, not guarantees.
Landlord ↔ Tenant lean methodology
- Overall (STATE)
- 87 Strongly Landlord-Friendly
- State Texas
- 87 Strongly Landlord-Friendly · R+5
- County
- — inherits STATE
- City
- — inherits STATE
ZIP-level market 77665
- Home prices YoY
- -11.1%
- Active inventory
- 73
- Price-to-rent
- 9.3×
Monthly cashflow live
- Estimated rent
- $1,522 medium interval (Pro) →
- Mortgage (P&I)
- −$886
- Tax from tax record
- −$367 /mo · $4,406/yr
- Insurance
- −$70
- HOA
- −$0
- Vacancy / Maint / Mgmt
- −$320
- Net cashflow
- $-121
Break-even live
Sensitivity live
| Price | -10% $-25 | -5% $-73 | +0% $-121 | +5% $-169 | +10% $-217 |
|---|---|---|---|---|---|
| Rent | -10% $-241 | -5% $-181 | +0% $-121 | +5% $-61 | +10% $-1 |
| Rate | -1.0pp $-36 | -0.5pp $-78 | base $-121 | +0.5pp $-165 | +1.0pp $-209 |
UW: 25.0% down · 7.5% · 30yr · 1.5% tax · 5.0% vac · 8.0% maint · 8.0% mgmt
Financing live
Cash to close
- Down payment
- $42,250
- Closing costs
- $5,070
- Reserves months
- —
- Total cash needed
- —
Loan-product check · same deal, 3 products live
Conventional
25% down · 7.5% · 30yr
- Down + closing
- —
- Monthly P&I
- —
- Monthly cashflow
- —
- DSCR
- —
- Eligible?
- —
Personal DTI + credit; lowest rate.
DSCR
20% down · 8.5% · 30yr
- Down + closing
- —
- Monthly P&I
- —
- Monthly cashflow
- —
- DSCR
- —
- Eligible?
- —
No personal income docs; deal must DSCR.
Hard money
10% down · 12.0% · 12mo
- Down + closing
- —
- Monthly P&I
- —
- Monthly cashflow
- —
- DSCR
- —
- Eligible?
- —
Short-term bridge; refi at stabilization.
Listing history 19 events
-
2026-06-21days on market $169,000 Active 94 DOM
-
2026-06-21days on market $169,000 Active 93 DOM
-
2026-06-18days on market $169,000 Active 91 DOM
-
2026-06-17days on market $169,000 Active 90 DOM
-
2026-06-16days on market $169,000 Active 89 DOM
-
2026-06-15days on market $169,000 Active 88 DOM
-
2026-06-13days on market $169,000 Active 86 DOM
-
2026-06-12days on market $169,000 Active 85 DOM
-
2026-06-09days on market $169,000 Active 82 DOM
-
2026-06-08days on market $169,000 Active 81 DOM
-
2026-06-08days on market $169,000 Active 80 DOM
-
2026-06-03days on market $169,000 Active 76 DOM
-
2026-06-02days on market $169,000 Active 75 DOM
-
2026-06-01days on market $169,000 Active 74 DOM
-
2026-05-31days on market $169,000 Active 73 DOM
-
2026-04-13price $179,000 320-char remark
Show marketing remark (320 chars)
Spacious 3-bedroom, 2 1/2 bath home on a large lot with endless potential! Offering 2,121 sq ft, this property features a generous backyard, wood-burning fireplace, and great layout. Home will require renovations and is being sold AS IS, making it a perfect opportunity to create your dream space or investment property.
-
2026-03-19$199,999 Active 320-char remark
Show marketing remark (320 chars)
Spacious 3-bedroom, 2 1/2 bath home on a large lot with endless potential! Offering 2,121 sq ft, this property features a generous backyard, wood-burning fireplace, and great layout. Home will require renovations and is being sold AS IS, making it a perfect opportunity to create your dream space or investment property.
-
2012-12-05soldstatus
-
2012-11-29soldstatus
ⓘ Source: listings_history table (triggers on properties + properties_extension) + one-shot
backfill from property_details.listing_events for pre-trigger history.
Tax reassessment forecast TX · Resets to sale price
- Current annual tax
- $4,406 · $367/mo
- Projected year-2 tax
- $4,406 · $367/mo
- Expected delta
- $0/yr ($0/mo · 0.0%)
ⓘ Screening estimate from a state-policy table — verify with the county assessor before closing.
Climate risk First Street
- Flood 4/10 Moderate FEMA zone X (unshaded) · 24% chance over 30 yrs
- Wildfire 3/10 Moderate
- Heat 9/10 Extreme 7 d/yr ≥110°F today · 25 d/yr by 30 yrs out
- Wind 9/10 Extreme 99% chance of damaging wind over 30 yrs
- Air quality 2/10 Low 0 unhealthy d/yr today · 1 by 30 yrs out
Nearby sold comps map
Loading sold comps map…
Walkable amenities ~0.75 mi
Loading nearby amenities…
Taxation est. · year 1
- Rental income
- $18,270
- − Mortgage interest
- −$9,467
- − Property taxes
- −$4,406
- − Insurance
- −$845
- − Repairs & maintenance
- −$1,462
- − Management
- −$1,462
- − Depreciation
- −$4,916
- Taxable loss
- −$4,288
- Est. tax savings @ 24.0%
- +$1,029
- After-tax cash flow
- $-424/yr
For passive investors: Depreciation is non-cash, so a rental often shows a tax loss while cash-flowing — sheltering income. Rental losses are passive: they offset passive income freely, and up to $25,000/yr can offset ordinary (W-2) income if you actively participate and your MAGI is under $100k (phasing out to $0 by $150k); unused losses carry forward. On sale, claimed depreciation is recaptured at up to 25%, and gains may owe capital-gains tax (a 1031 exchange can defer both). Figures are a year-1 estimate at your 24.0% rate — not tax advice; consult a CPA.
Schools (NCES district)
- District
- East Chambers ISD
- NCES district ID
- 4817880
- Math proficiency
- 51% ▼ -1.00%
- Reading proficiency
- 47% ▲ 2.00%
- Median HH income
- $47,131
- Composite
- 41.71/100
- National rank
- #3411
- State rank
- #199 of 826 in TX
Livability — Stowell
- Score
- 52/100
- State rank
- #1466
- US rank
- #25107
Category grades
Schools grade is shown separately in the Schools card above.
Census & demographics
- Census place
- Stowell, TX
- City population
- 8,144
- Population (ZIP)
- 7,751
Population outlook (Chambers County) Hauer SSP2
- Today (2025)
- 46,946 people
- By 2030
- 51,094 · +8.8%
- By 2040
- 59,578 · +26.9%
- By 2050
- 68,318 · +45.5%
- By 2075
- 90,485 · +92.7%
- By 2100
- 104,885 · +123.4%
Race, ethnicity, and origin ACS 2023
- Neighborhood character
- Predominantly White (67%)
- Race & ethnicity
- White 67% Hispanic / Latino 27% Two or more races 7% Black 4%
- Hispanic origin (detail)
- Mexican 23%
- Common ancestry
- Lithuanian 9% Slovak 3% Italian 2%
- Foreign-born
- 12% · Canada
- Languages at home
- 74% English-only · Spanish 24% French/Haitian/Cajun 1% Other Asian/Pacific 1%
Political lean MEDSL · Chambers
- 2024 margin
- Solid R (+65.6) · D 16.8% · R 82.4%
- 2008→2024 swing
- -14.4pp toward R · 2008: -51.2pp · 2024: -65.6pp
- All cycles
- 2024: R+65.6 2020: R+61.7 2016: R+62.1 2012: R+61.1 2008: R+51.2
Not yet ingested
- Civics
- —
Market trends
- HPI YoY
- ▼ -23.27%
- Current HPI
- 187.3594
- Rent YoY
- —
- Metro
- —
- State GDP YoY
- ▲ 3.95%
- F500 in state
- 110
Industry mix (Fortune 500 HQ in TX)
| Industry | F500 HQs | Revenue |
|---|---|---|
| Energy | 16 | $1,198B |
|
||
| Technology | 5 | $198B |
|
||
| Engineering / Construction | 4 | $72B |
|
||
| Energy Services | 3 | $60B |
|
||
| Utilities | 3 | $41B |
|
||
| Healthcare | 2 | $330B |
|
||
Price history
-10.5% since first listed4 events — show timeline
- 2026-04-13 Price Changed $179,000 HARMLS
- 2026-03-19 Listed $199,999 HARMLS
- 2012-12-05 Sold (Public Records) — Public Records
- 2012-11-29 Sold (Public Records) — Public Records
Property tax history
+4.2%/yrLatest (2025): $4,406 · +10.0% YoY. Source: county tax records.
Cash-flow waterfall
monthlySold comps — $/sqft
last 12 mo · ≤1 miLoading sold comps…