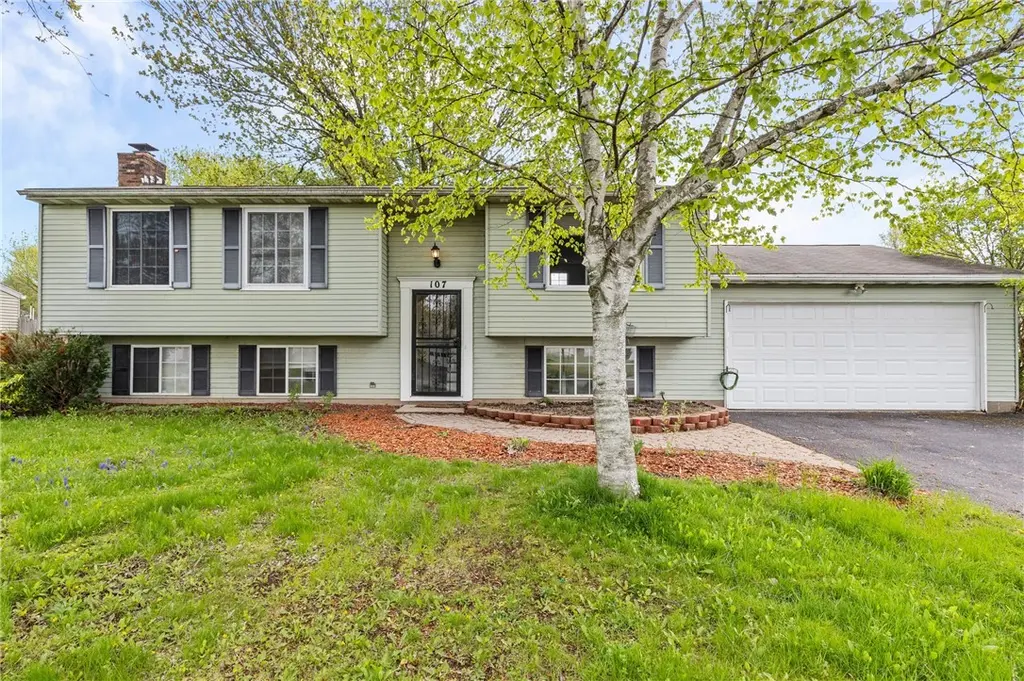
107 Overland Trl · Rochester Institute of Technology, NY
Flood risk 1/10 · Minimal
- FEMA flood zone
- X (unshaded)
- Chance of flooding over 30 yrs
- 0.0%
- Est. flood insurance / yr
- $473 – $860
Fire risk 2/10 · Minimal
- Est. fire insurance / yr
- $691 – $1,283
Heat risk 2/10 · Minimal
- Hot days now (above 94°F)
- 7 days/yr
- Hot days in 30 yrs
- 15 days/yr
Wind risk 1/10 · Minimal
- Chance of severe wind over 30 yrs
- —
Air-quality risk 2/10 · Minimal
- Unhealthy air days now
- 1 days/yr
- Unhealthy air days in 30 yrs
- 1 days/yr
Risk factors via First Street. Map © Google.
Why this score? — see what drove the C- grade
The composite is a weighted blend of 9 inputs, each scored 0–100. Each bar is that input's sub-score; the figure is the points it added to the 100-point composite (weight × sub-score).
- Cash flow +16.0/30.0
- ARV discount +15.0/15.0
- 1% rule +5.2/10.0
- Schools +5.2/10.0
- DSCR +4.9/10.0
- Rent growth +2.5/5.0
- Livability +2.5/5.0
- Condition / age +2.5/5.0
- Appreciation +0.0/10.0
$239,000
🖨 Deal sheet 📄 Offer letter ✓ Due diligence
Listing remarks
Welcome to this 3-bedroom, 2-bath Raised Ranch located in an established West Henrietta neighborhood. The main level offers an eat-in kitchen with breakfast bar, dining area, and all appliances included — even the chest freezer in the garage. A comfortable living room with a wood-burning stove adds warmth and character to the space. The lower level provides great flexibility, with room for a family room, entertaining area, or guest space. Gather with friends and family around the second wood-burning insert stove, and enjoy the additional room currently used as a workout area, perfect for a home office, hobby room, or storage. A full bath and utility area complete the lower level. With
Key facts
- 0.25 acre lot
- 2 garage spots
- Built 1977
Property features AI
Exterior
- Parking: Attached garage; Approximately 2.5 garage spaces
- Utilities: Cable available; Public water (connected); Sewer connected
- Home design: Single-story home; Resale property
- Construction: Vinyl siding; Asphalt roof; Block foundation; Existing (built earlier)
- Exterior features: Blacktop driveway; Fully fenced yard; Patio; Rectangular residential lot; City street frontage
Interior
- Kitchen: Dishwasher; Electric oven; Electric range; Microwave; Refrigerator; Eat-in kitchen
- Bedrooms: Total rooms: 7; Room types include: Laundry, Living Room, Recreation, Basement, Family Room
- Flooring: Carpet; Laminate; Varies
- Bathrooms: 2 full bathrooms
- Heating & cooling: Gas forced air heating; Central air conditioning
- Interior features: Breakfast bar; Ceiling fan(s); Eat-in kitchen; Separate/formal living room; Has fireplace (2 total); Full, partially finished basement
- Laundry & utility: Laundry in basement; Gas water heater
Neighborhood map
What this means for you Summary
Snapshot
- This is a 3-bed/2.0-bath single-family listed at $239k.
Deal economics
- At list price, monthly cash flow is $118 ($1k/yr) — positive.
- The deal already cash-flows at list — no discount required.
- Meets the 1% rule at list price ($2k rent vs $239k).
- Recommended offer: $235k (1.5% below list) — sets the bar for market timing.
- Cap rate 6.9% vs local median 3.8% in Rochester Institute of Technology — top-decile yield for the area; either an underpriced asset or a hidden risk that comps aren't pricing in. Stress-test before assuming the spread holds.
Location & tenants
- Location reads: area grade C — affects rentability + tenant quality, not the cash-flow math above.
- Rush-Henrietta Central School District (suburban): math 62% / reading 57% proficiency, ranked #237 of 590 in NY (top 40%) — acceptable for families but not a draw, mixed tenant base, ~2y average lease.
- Market conditions: 40 active listings in the ZIP; 1 comparable units currently listed for rent nearby; high-income renter base; 1,169 units permitted in Monroe County in 2024 (591 in 5+ unit buildings).
Forward outlook
- Local home prices are declining (-3.0%/yr); year-one equity from $2k of loan paydown is wiped out by about $7k of value loss. Plan a longer hold.
- Monroe County population projected to shrink 6% by 2050 — rents likely to lag national; underwrite the cash flow, not the appreciation.
Negotiation context
- It's been on market 21 days — a 2% lower offer ($235k) is reasonable based on typical stale-listing flexibility.
- Current owner paid $94k; list at $239k implies a 153% gain — meaningful room to come down on a strong offer.
Questions for the listing agent
- Built in 1977 — when were the roof, HVAC, electrical panel, plumbing, and water heater last replaced?
- Is there a deadline driving the sale (1031 exchange, divorce, estate, relocation)? That informs how much negotiation room exists.
- What's the average days-on-market for RENTAL listings here right now (not sales)? A rising rental-DOM trend means longer vacancies and softer asking-rent achievability than the comps imply.
- What's the recent tenant-quality profile in this submarket — average credit score on applications, eviction rate, late-payment / NSF rate, and stable-employment percentage? A property-management company in the area should have these aggregated.
- How much new for-sale + rental construction is in the pipeline within 1–3 miles? Heavy new supply typically softens prices + rents 12–24 months out; constrained supply supports both.
Investment metrics
- 1% rule
- 1.02% ✓
- Cap rate
- 6.89%
- Cash-on-cash
- 2.12%
- DSCR
- 1.09
- GRM
- 8.2
CMA / ARV
- ARV (median comp)
- $311,635
- List price
- $239,000
- Delta
- -23.31%
- Verdict
- UNDERPRICED
- Comps
- 20 within 1.0 mi
Show comp detail 12 sales within ~0.75 mi
| Address | Dist | Beds/Ba | Sqft | Sold | Price | $/sf | Match |
|---|---|---|---|---|---|---|---|
| 12 Rawhide Dr | 0.24mi | 3/2.5 | 1,698 (+1%) | 10mo | $285,000 | $168 | 76 |
| 140 Overland | 0.09mi | 3/1.5 | 1,540 (-8%) | 5mo | $306,000 | $199 | 76 |
| 188 Overland Trl | 0.19mi | 3/1.5 | 1,568 (-6%) | 9mo | $218,000 | $139 | 70 |
| 93 Falcon Dr | 0.23mi | 3/1.0 | 1,568 (-6%) | 9mo | $225,000 | $143 | 67 |
| 45 Rawhide Dr | 0.17mi | 4/2.5 (+1) | 1,792 (+7%) | 9mo | $254,000 | $142 | 66 |
| 3 Cascade Rd | 0.30mi | 3/1.5 | 1,520 (-9%) | 7mo | $246,400 | $162 | 63 |
| 36 Yellowstone Dr | 0.61mi | 4/2.0 (+1) | 1,624 (-3%) | 2mo | $355,000 | $219 | 60 |
| 34 Prairie Trl | 0.42mi | 3/1.5 | 1,540 (-8%) | 7mo | $280,000 | $182 | 59 |
| 11 Wenrich Cir | 0.45mi | 3/1.5 | 1,568 (-6%) | 10mo | $305,000 | $195 | 58 |
| 16 Alton Way | 0.67mi | 3/2.0 | 1,564 (-7%) | 1mo | $405,000 | $259 | 57 |
| 57 Yellowstone Dr | 0.53mi | 4/2.0 (+1) | 1,548 (-8%) | 8mo | $266,000 | $172 | 51 |
| 52 Morin Cir | 0.56mi | 4/3.0 (+1) | 1,836 (+10%) | 8mo | $400,000 | $218 | 42 |
Match score weights: distance 35% · size 25% · config 20% · recency 20%. Top-matched comps best support the ARV.
Projected returns pro-forma
-3.0% appreciation · 3.0% rent growth · sell at horizon
- IRR
- -12.9%
- Equity multiple
- 0.54×
- Total profit
- $-31,085
- Equity at exit
- $35,636
- IRR
- -3.8%
- Equity multiple
- 0.75×
- Total profit
- $-16,864
- Equity at exit
- $20,664
Cash invested: $66,920 (down + closing). Projections, not guarantees.
Landlord ↔ Tenant lean methodology
- Overall (STATE)
- 15 Strongly Tenant-Friendly
- State New York
- 15 Strongly Tenant-Friendly · D+10
- County
- — inherits STATE
- City
- — inherits STATE
ZIP-level market 14586
- Home prices YoY
- -8.5%
- Active inventory
- 40
- Price-to-rent
- 8.2×
Monthly cashflow live
- Estimated rent
- $2,433 medium interval (Pro) →
- Mortgage (P&I)
- −$1,253
- Tax from tax record
- −$452 /mo · $5,418/yr
- Insurance
- −$100
- HOA
- −$0
- Vacancy / Maint / Mgmt
- −$511
- Net cashflow
- $118
Break-even live
UW: 25.0% down · 7.5% · 30yr · 1.5% tax · 5.0% vac · 8.0% maint · 8.0% mgmt
Financing live
Cash to close
- Down payment
- $59,750
- Closing costs
- $7,170
- Reserves months
- —
- Total cash needed
- —
Loan-product check · same deal, 3 products live
Conventional
25% down · 7.5% · 30yr
- Down + closing
- —
- Monthly P&I
- —
- Monthly cashflow
- —
- DSCR
- —
- Eligible?
- —
Personal DTI + credit; lowest rate.
DSCR
20% down · 8.5% · 30yr
- Down + closing
- —
- Monthly P&I
- —
- Monthly cashflow
- —
- DSCR
- —
- Eligible?
- —
No personal income docs; deal must DSCR.
Hard money
10% down · 12.0% · 12mo
- Down + closing
- —
- Monthly P&I
- —
- Monthly cashflow
- —
- DSCR
- —
- Eligible?
- —
Short-term bridge; refi at stabilization.
Rent comps 1 comps
| Address | Beds | Baths | Sqft | Rent | $/sqft | DOM | Units | Dist |
|---|---|---|---|---|---|---|---|---|
| 247 Overland Trl West Henrietta, NY | 3.0 | 2.0 | 1568 | $2,800 | $1.79 | 14d | 1 | 0.40mi |
Listing history 3 events
-
2026-05-14price $239,000 743-char remark
-
2026-05-05$249,900 Active 743-char remark
-
1994-02-07soldstatus $94,500
ⓘ Source: listings_history table (triggers on properties + properties_extension) + one-shot
backfill from property_details.listing_events for pre-trigger history.
Tax reassessment forecast NY · Partial reset (capped growth)
- Current annual tax
- $5,418 · $452/mo
- Projected year-2 tax
- $5,418 · $452/mo
- Expected delta
- $0/yr ($0/mo · 0.0%)
ⓘ Screening estimate from a state-policy table — verify with the county assessor before closing.
Climate risk First Street
- Flood 1/10 Low FEMA zone X (unshaded) · 0% chance over 30 yrs
- Wildfire 2/10 Low
- Heat 2/10 Low 7 d/yr ≥94°F today · 15 d/yr by 30 yrs out
- Wind 1/10 Low
- Air quality 2/10 Low 1 unhealthy d/yr today · 1 by 30 yrs out
Nearby sold comps map
Loading sold comps map…
Walkable amenities ~0.75 mi
Loading nearby amenities…
Taxation est. · year 1
- Rental income
- $29,201
- − Mortgage interest
- −$13,388
- − Property taxes
- −$5,418
- − Insurance
- −$1,195
- − Repairs & maintenance
- −$2,336
- − Management
- −$2,336
- − Depreciation
- −$6,953
- Taxable loss
- −$2,425
- Est. tax savings @ 24.0%
- +$582
- After-tax cash flow
- $1,997/yr
For passive investors: Depreciation is non-cash, so a rental often shows a tax loss while cash-flowing — sheltering income. Rental losses are passive: they offset passive income freely, and up to $25,000/yr can offset ordinary (W-2) income if you actively participate and your MAGI is under $100k (phasing out to $0 by $150k); unused losses carry forward. On sale, claimed depreciation is recaptured at up to 25%, and gains may owe capital-gains tax (a 1031 exchange can defer both). Figures are a year-1 estimate at your 24.0% rate — not tax advice; consult a CPA.
Schools (NCES district)
- District
- Rush-Henrietta Central School District
- NCES district ID
- 3625170
- Math proficiency
- 62% ▼ -6.00%
- Reading proficiency
- 57% ▲ 1.00%
- Median HH income
- $58,682
- Composite
- 51.52/100
- National rank
- #1720
- State rank
- #237 of 590 in NY
Livability — Rochester Institute of Technology
No livability data for this city. (Only ~50 U.S. cities are tracked.)
Census & demographics
- County
- Monroe County · 674,131 people
- Metro
- Rochester, NY
- Population (ZIP)
- 13,291
- Household income
- $124,457
- Rent vs Own
- Severe rent burden
- 458.0
Population outlook (Monroe County) Hauer SSP2
- Today (2025)
- 759,460 people
- By 2030
- 757,154 · -0.3%
- By 2040
- 740,644 · -2.5%
- By 2050
- 714,443 · -5.9%
- By 2075
- 645,883 · -15.0%
- By 2100
- 547,084 · -28.0%
Race, ethnicity, and origin ACS 2023
- Neighborhood character
- Predominantly White (69%)
- Race & ethnicity
- White 69% Asian 15% Black 7% Two or more races 5% Hispanic / Latino 4%
- Common ancestry
- Romanian 4% Iranian 2% Lithuanian 2%
- Foreign-born
- 16% · China, India, Vietnam
- Languages at home
- 81% English-only · Other Indo-European 7% Spanish 4% Chinese 3%
Political lean MEDSL · Monroe
- 2024 margin
- D (+19.1) · D 59.5% · R 40.5%
- 2008→2024 swing
- +1.4pp toward D · 2008: 17.7pp · 2024: 19.1pp
- All cycles
- 2024: D+19.1 2020: D+21.0 2016: D+14.1 2012: D+17.4 2008: D+17.7
Not yet ingested
- Civics
- —
Market trends
- HPI YoY
- ▼ -24.58%
- Current HPI
- 265.7183
- Rent YoY
- —
- Metro
- Rochester, NY
- State GDP YoY
- ▲ 2.60%
- F500 in state
- 92
Industry mix (Fortune 500 HQ in NY)
| Industry | F500 HQs | Revenue |
|---|---|---|
| Financial Services | 10 | $950B |
|
||
| Consumer Goods | 9 | $162B |
|
||
| Insurance | 4 | $225B |
|
||
| Telecommunications | 2 | $144B |
|
||
| Pharmaceuticals | 2 | $112B |
|
||
| Media / Entertainment | 2 | $69B |
|
||
Price history
+152.9% since first listed5 events — show timeline
- 2026-05-26 Pending — UNYREIS
- 2026-05-19 Contingent — UNYREIS
- 2026-05-14 Price Changed $239,000 UNYREIS
- 2026-05-05 Listed $249,900 UNYREIS
- 1994-02-07 Sold (Public Records) $94,500 Public Records
Property tax history
+4.6%/yrLatest (2025): $5,418 · +20.9% YoY. Source: county tax records.
Cash-flow waterfall
monthlySold comps — $/sqft
last 12 mo · ≤1 miLoading sold comps…