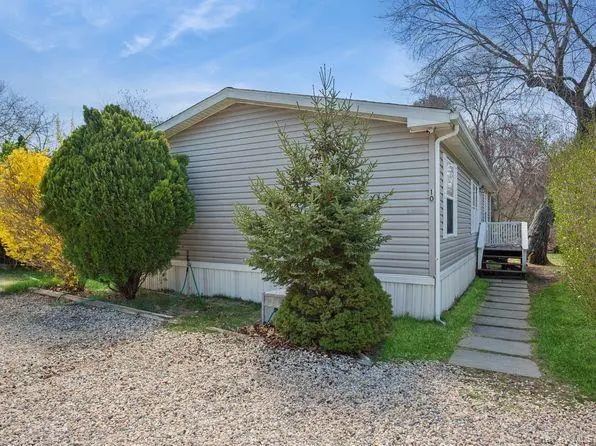
337 Three Mile Harbo #10 · Springs, NY
Flood risk 6/10 · Moderate
- FEMA flood zone
- X (unshaded)
- Chance of flooding over 30 yrs
- 0.52%
- Est. flood insurance / yr
- $507 – $1,088
Fire risk 3/10 · Minor
- Est. fire insurance / yr
- $691 – $1,283
Heat risk 4/10 · Minor
- Hot days now (above 89°F)
- 7 days/yr
- Hot days in 30 yrs
- 20 days/yr
Wind risk 8/10 · Major
- Chance of severe wind over 30 yrs
- 80.0%
Air-quality risk 3/10 · Minor
- Unhealthy air days now
- 2 days/yr
- Unhealthy air days in 30 yrs
- 3 days/yr
Risk factors via First Street. Map © Google.
Why this score? — see what drove the D+ grade
The composite is a weighted blend of 9 inputs, each scored 0–100. Each bar is that input's sub-score; the figure is the points it added to the 100-point composite (weight × sub-score).
- Cash flow +15.0/30.0
- ARV discount +7.5/15.0
- Schools +5.1/10.0
- 1% rule +5.0/10.0
- DSCR +5.0/10.0
- Rent growth +5.0/5.0
- Livability +3.2/5.0
- Condition / age +2.5/5.0
- Appreciation +0.0/10.0
$425,000
🖨 Deal sheet 📄 Offer letter ✓ Due diligence
Listing remarks MLS
Residentially Owned Mobile Home Park. Welcome to a very unique Mobile Home Park in East Hampton located near Three Mile Harbor Marina and surrounded by nature trails. Interior of this doublewide unit features three bedrooms and two bathrooms, living room with cozy fireplace and vaulted ceilings, as well as spacious kitchen and laundry room. Gas forced air is used for heating and AC window units for cooling. Two dedicated parking spaces with extra space for occasional guests. Back yard deck is overlooking the pond with a storage shed for all your garden and beach stuff. The shareholders in the park own their units as well as a share of the park land. In order to get qualified and approved by the Board, the new member applicant has to satisfy income criteria as well as purchasing this unit as their primary residency.
Key facts
- Laundry room
- Spacious kitchen
- Cozy fireplace
Tags
Neighborhood map
What this means for you Summary
Snapshot
- This is a 3-bed/2.0-bath land listed at $425k.
Deal economics
- At list price, monthly cash flow is $21k ($256k/yr) — positive.
- The deal already cash-flows at list — no discount required.
- Meets the 1% rule at list price ($31k rent vs $425k).
- Recommended offer: $374k (12.0% below list) — sets the bar for market timing.
- Cap rate 66.5% vs local median 11.1% in Springs — top-decile yield for the area; either an underpriced asset or a hidden risk that comps aren't pricing in. Stress-test before assuming the spread holds.
Location & tenants
- Location reads 63/100 on livability (#809 in NY) — a middle-class / working-renter tenant base. Strengths: crime A+, employment A+; Watch: housing C-, schools D-, amenities F.
- Springs Union Free School District (town): math 55% / reading 60% proficiency, ranked #239 of 590 in NY (top 40%) — acceptable for families but not a draw, mixed tenant base, ~2y average lease; only 9% free/reduced lunch — higher-income household profile.
- Market conditions: Rents rising fast (+12.3%/yr); 135 active listings in the ZIP; 2 comparable units currently listed for rent nearby; high-income renter base; 1,366 units permitted in Suffolk County in 2024 (216 in 5+ unit buildings).
- At $31,174/mo this rent would consume 288% of the median local household income ($130k/yr) (locally 896% of renters already pay >50% of income on rent) — very limited rent-growth headroom before tenants either downsize or default.
Forward outlook
- Local home prices are declining (-3.0%/yr); year-one equity from $3k of loan paydown is wiped out by about $13k of value loss. Plan a longer hold.
- Suffolk County population projected to shrink 5% by 2050 — rents likely to lag national; underwrite the cash flow, not the appreciation.
- At projected returns (-3.0% appreciation + 8.0% rent growth), your $119k cash investment doubles in ~1 year — after that, you're playing with house money.
Negotiation context
- It's been on market 212 days — a 12% lower offer ($374k) is reasonable based on typical stale-listing flexibility.
- 2 sale attempts since 2y ago; this cycle's ask has dropped $35k (8%) from the opening price — seller is motivated, your offer sets the floor, not the list.
Risks & watch-outs
- Climate carrying-cost: major flood risk; severe wind risk, 80% chance of damaging wind over 30y — expect insurance premiums to compound above CPI over the hold.
Questions for the listing agent
- It's been on market 212 days. Have you received any prior offers? Is the seller open to a 12% concession, seller financing, or rate buy-down credit?
- What does the HOA fee cover, when was the last increase, and are there any pending special assessments or reserve-fund shortfalls?
- Why hasn't it sold? Are there any deal-killer items the seller is aware of (foundation, flood, title, zoning, code violations)?
- Is there a deadline driving the sale (1031 exchange, divorce, estate, relocation)? That informs how much negotiation room exists.
- Schools are D-rated, which usually means shorter tenancies and higher turnover. Who's the typical renter profile here, and what's been the actual vacancy rate?
- The area grade is low — what's the realistic commute time and amenity access for the typical tenant pool here? Any planned neighborhood developments (good or bad) we should know about?
- What's the average days-on-market for RENTAL listings here right now (not sales)? A rising rental-DOM trend means longer vacancies and softer asking-rent achievability than the comps imply.
- What's the recent tenant-quality profile in this submarket — average credit score on applications, eviction rate, late-payment / NSF rate, and stable-employment percentage? A property-management company in the area should have these aggregated.
- How much new for-sale + rental construction is in the pipeline within 1–3 miles? Heavy new supply typically softens prices + rents 12–24 months out; constrained supply supports both.
Investment metrics
- 1% rule
- 7.34% ✓
- Cap rate
- 66.48%
- Cash-on-cash
- 214.94%
- DSCR
- 10.56
- GRM
- 1.1
CMA / ARV
No comps found within radius.
Projected returns pro-forma
-3.0% appreciation · 8.0% rent growth · sell at horizon
- IRR
- —
- Equity multiple
- 13.22×
- Total profit
- $1,454,158
- Equity at exit
- $63,369
- IRR
- —
- Equity multiple
- 32.66×
- Total profit
- $3,767,033
- Equity at exit
- $36,746
Cash invested: $119,000 (down + closing). Projections, not guarantees.
Landlord ↔ Tenant lean methodology
- Overall (STATE)
- 15 Strongly Tenant-Friendly
- State New York
- 15 Strongly Tenant-Friendly · D+10
- County
- — inherits STATE
- City
- — inherits STATE
ZIP-level market 11937
- Rents YoY
- 12.3%
- Active inventory
- 135
- Price-to-rent
- 1.1×
Monthly cashflow live
- Estimated rent
- $31,174 medium interval (Pro) →
- Mortgage (P&I)
- −$2,229
- Tax from tax record
- −$84 /mo · $1,012/yr
- Insurance
- −$177
- HOA
- −$822
- Vacancy / Maint / Mgmt
- −$6,547
- Net cashflow
- $21,315
Break-even live
UW: 25.0% down · 7.5% · 30yr · 1.5% tax · 5.0% vac · 8.0% maint · 8.0% mgmt
Financing live
Cash to close
- Down payment
- $106,250
- Closing costs
- $12,750
- Reserves months
- —
- Total cash needed
- —
Loan-product check · same deal, 3 products live
Conventional
25% down · 7.5% · 30yr
- Down + closing
- —
- Monthly P&I
- —
- Monthly cashflow
- —
- DSCR
- —
- Eligible?
- —
Personal DTI + credit; lowest rate.
DSCR
20% down · 8.5% · 30yr
- Down + closing
- —
- Monthly P&I
- —
- Monthly cashflow
- —
- DSCR
- —
- Eligible?
- —
No personal income docs; deal must DSCR.
Hard money
10% down · 12.0% · 12mo
- Down + closing
- —
- Monthly P&I
- —
- Monthly cashflow
- —
- DSCR
- —
- Eligible?
- —
Short-term bridge; refi at stabilization.
Rent comps 2 comps
| Address | Beds | Baths | Sqft | Rent | $/sqft | DOM | Units | Dist |
|---|---|---|---|---|---|---|---|---|
| 319 Three Mile Harbor Rd East Hampton, NY | 2.0 | 1.0 | 1100 | $5,500 | $5.00 | 1d | 1 | 0.14mi |
| 66 Crystal Dr East Hampton, NY | 2.0 | 3.0 | 960 | $20,000 | $20.83 | 1d | 1 | 0.35mi |
HOA detail
- Monthly dues
- $822 · $9,864/yr
- Likely covers
- gas
Listing history 18 events
-
2026-06-18days on market $425,000 Active 212 DOM
-
2026-06-17days on market $425,000 Active 211 DOM
-
2026-06-16days on market $425,000 Active 210 DOM
-
2026-06-15days on market $425,000 Active 209 DOM
-
2026-06-13days on market $425,000 Active 207 DOM
-
2026-06-13days on market $425,000 Active 206 DOM
-
2026-06-09days on market $425,000 Active 203 DOM
-
2026-06-08days on market $425,000 Active 202 DOM
-
2026-06-07days on market $425,000 Active 201 DOM
-
2026-06-04days on market $425,000 Active 198 DOM
-
2026-06-03days on market $425,000 Active 197 DOM
-
2026-06-02days on market $425,000 Active 196 DOM
-
2026-06-01days on market $425,000 Active 195 DOM
-
2026-05-31days on market $425,000 Active 194 DOM
-
2026-02-04price $450,000 827-char remark
Show marketing remark (827 chars)
Residentially Owned Mobile Home Park. Welcome to a very unique Mobile Home Park in East Hampton located near Three Mile Harbor Marina and surrounded by nature trails. Interior of this doublewide unit features three bedrooms and two bathrooms, living room with cozy fireplace and vaulted ceilings, as well as spacious kitchen and laundry room. Gas forced air is used for heating and AC window units for cooling. Two dedicated parking spaces with extra space for occasional guests. Back yard deck is overlooking the pond with a storage shed for all your garden and beach stuff. The shareholders in the park own their units as well as a share of the park land. In order to get qualified and approved by the Board, the new member applicant has to satisfy income criteria as well as purchasing this unit as their primary residency.
-
2025-11-18$460,000 Active 827-char remark
Show marketing remark (827 chars)
Residentially Owned Mobile Home Park. Welcome to a very unique Mobile Home Park in East Hampton located near Three Mile Harbor Marina and surrounded by nature trails. Interior of this doublewide unit features three bedrooms and two bathrooms, living room with cozy fireplace and vaulted ceilings, as well as spacious kitchen and laundry room. Gas forced air is used for heating and AC window units for cooling. Two dedicated parking spaces with extra space for occasional guests. Back yard deck is overlooking the pond with a storage shed for all your garden and beach stuff. The shareholders in the park own their units as well as a share of the park land. In order to get qualified and approved by the Board, the new member applicant has to satisfy income criteria as well as purchasing this unit as their primary residency.
-
2025-01-01historical
-
2024-04-26$495,000 Active
ⓘ Source: listings_history table (triggers on properties + properties_extension) + one-shot
backfill from property_details.listing_events for pre-trigger history.
Tax reassessment forecast NY · Partial reset (capped growth)
- Current annual tax
- $1,012 · $84/mo
- Projected year-2 tax
- $4,097 · $341/mo
- Expected delta
- +$3,085/yr (+$257/mo · 304.9%)
ⓘ Screening estimate from a state-policy table — verify with the county assessor before closing.
Climate risk First Street
- Flood 6/10 Major FEMA zone X (unshaded) · 52% chance over 30 yrs
- Wildfire 3/10 Moderate
- Heat 4/10 Moderate 7 d/yr ≥89°F today · 20 d/yr by 30 yrs out
- Wind 8/10 Severe 80% chance of damaging wind over 30 yrs
- Air quality 3/10 Moderate 2 unhealthy d/yr today · 3 by 30 yrs out
Nearby sold comps map
Loading sold comps map…
Walkable amenities ~0.75 mi
Loading nearby amenities…
Taxation est. · year 1
- Rental income
- $374,087
- − Mortgage interest
- −$23,807
- − Property taxes
- −$1,012
- − Insurance
- −$2,125
- − Repairs & maintenance
- −$29,927
- − Management
- −$29,927
- − HOA
- −$9,864
- − Depreciation
- −$12,364
- Taxable income
- $265,062
- Est. tax owed @ 24.0%
- −$63,615
- After-tax cash flow
- $192,168/yr
For passive investors: Depreciation is non-cash, so a rental often shows a tax loss while cash-flowing — sheltering income. Rental losses are passive: they offset passive income freely, and up to $25,000/yr can offset ordinary (W-2) income if you actively participate and your MAGI is under $100k (phasing out to $0 by $150k); unused losses carry forward. On sale, claimed depreciation is recaptured at up to 25%, and gains may owe capital-gains tax (a 1031 exchange can defer both). Figures are a year-1 estimate at your 24.0% rate — not tax advice; consult a CPA.
Schools (NCES district)
- District
- Springs Union Free School District
- NCES district ID
- 3627900
- Math proficiency
- 55% ▲ 6.00%
- Reading proficiency
- 60% ▲ 10.00%
- Median HH income
- $75,413
- Composite
- 51.42/100
- National rank
- #1728
- State rank
- #239 of 590 in NY
Livability — Springs
- Score
- 63/100
- State rank
- #809
- US rank
- #15666
Category grades
Schools grade is shown separately in the Schools card above.
Census & demographics
- Census place
- Springs, NY
- County
- Suffolk County · 679,920 people
- Metro
- New York-Newark-Jersey City, NY-NJ-PA
- Population (ZIP)
- 21,882
- Household income
- $129,883
- Rent vs Own
- Severe rent burden
- 896.0
Population outlook (Suffolk County) Hauer SSP2
- Today (2025)
- 1,505,262 people
- By 2030
- 1,498,318 · -0.5%
- By 2040
- 1,471,101 · -2.3%
- By 2050
- 1,424,848 · -5.3%
- By 2075
- 1,337,157 · -11.2%
- By 2100
- 1,217,720 · -19.1%
Race, ethnicity, and origin ACS 2023
- Neighborhood character
- Majority White (61%)
- Race & ethnicity
- White 61% Hispanic / Latino 32% Two or more races 23% Black 2% Asian 2%
- Hispanic origin (detail)
- Mexican 2% Puerto Rican 1%
- Common ancestry
- Romanian 5% Scotch-Irish 4% Italian 2%
- Foreign-born
- 25% · Canada, Guatemala, Jamaica
- Languages at home
- 68% English-only · Spanish 28% Other Indo-European 1% Russian/Polish/Slavic 1%
Political lean MEDSL · Suffolk
- 2024 margin
- Lean R (+10.0) · D 45.0% · R 55.0%
- 2008→2024 swing
- -16.0pp toward R · 2008: 6.0pp · 2024: -10.0pp
- All cycles
- 2024: R+10.0 2020: R+0.0 2016: R+8.2 2012: D+2.9 2008: D+6.0
Not yet ingested
- Civics
- —
Market trends
- HPI YoY
- ▼ -285.21%
- Current HPI
- 444.1499
- Rent YoY
- ▲ 12.28%
- Metro
- New York-Newark-Jersey City, NY-NJ-PA
- State GDP YoY
- ▲ 2.60%
- F500 in state
- 92
Industry mix (Fortune 500 HQ in NY)
| Industry | F500 HQs | Revenue |
|---|---|---|
| Financial Services | 10 | $950B |
|
||
| Consumer Goods | 9 | $162B |
|
||
| Insurance | 4 | $225B |
|
||
| Telecommunications | 2 | $144B |
|
||
| Pharmaceuticals | 2 | $112B |
|
||
| Media / Entertainment | 2 | $69B |
|
||
Price history
-9.1% since first listed4 events — show timeline
- 2026-02-04 Price Changed $450,000 OneKey® MLS as Distributed by MLS Grid
- 2025-11-18 Listed $460,000 OneKey® MLS as Distributed by MLS Grid
- 2025-01-01 Listing Removed — OneKey® MLS as Distributed by MLS Grid
- 2024-04-26 Listed $495,000 OneKey® MLS as Distributed by MLS Grid
Property tax history
+3.7%/yrLatest (2025): $1,012 · +0.0% YoY. Source: county tax records.
Cash-flow waterfall
monthlySold comps — $/sqft
last 12 mo · ≤1 miLoading sold comps…