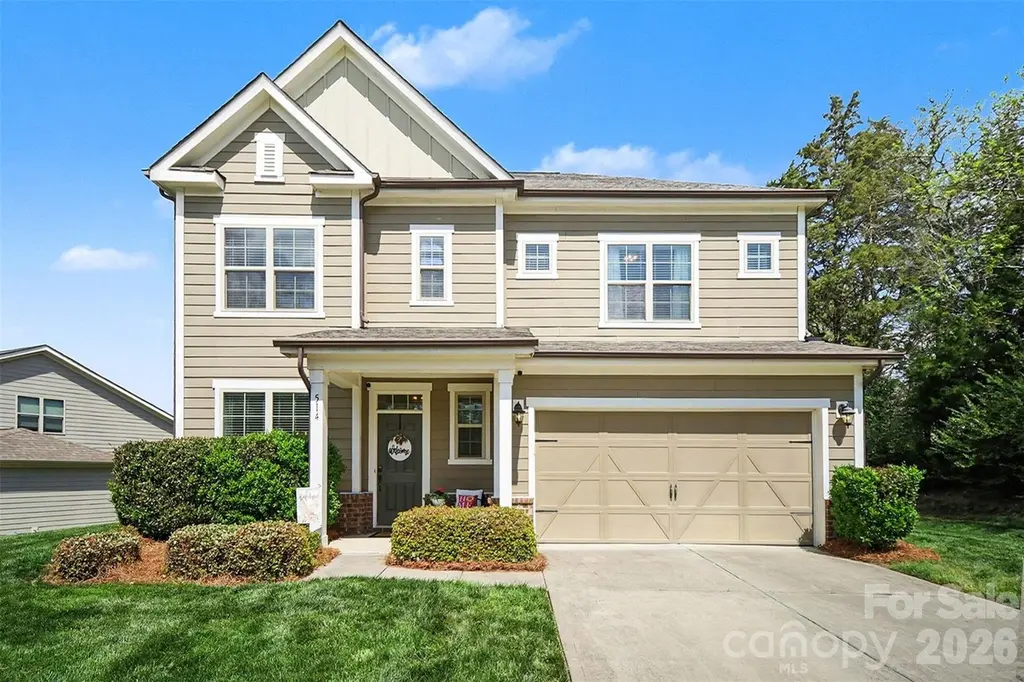
514 Tack Ln · Midland, NC
Flood risk 1/10 · Minimal
- FEMA flood zone
- X (unshaded)
- Chance of flooding over 30 yrs
- 0.0%
- Est. flood insurance / yr
- $507 – $1,088
Fire risk 2/10 · Minimal
- Est. fire insurance / yr
- $906 – $1,684
Heat risk 6/10 · Moderate
- Hot days now (above 105°F)
- 7 days/yr
- Hot days in 30 yrs
- 18 days/yr
Wind risk 5/10 · Moderate
- Chance of severe wind over 30 yrs
- 25.0%
Air-quality risk 3/10 · Minor
- Unhealthy air days now
- 3 days/yr
- Unhealthy air days in 30 yrs
- 4 days/yr
Risk factors via First Street. Map © Google.
Why this score? — see what drove the D grade
The composite is a weighted blend of 9 inputs, each scored 0–100. Each bar is that input's sub-score; the figure is the points it added to the 100-point composite (weight × sub-score).
- Cash flow +12.9/30.0
- ARV discount +11.1/15.0
- Schools +4.7/10.0
- DSCR +3.9/10.0
- Livability +3.5/5.0
- 1% rule +2.9/10.0
- Rent growth +2.5/5.0
- Condition / age +2.5/5.0
- Appreciation +0.0/10.0
$475,000
🖨 Deal sheet (PDF) 📄 Offer letter ✓ Due diligence
Listing remarks
Welcome to this well-maintained home set on a spacious lot with a manicured lawn and inviting front porch. Inside, you’ll find a bright, comfortable interior with plenty of natural light. The open layout works well for both everyday living and gatherings around a cozy fire with gas logs. The dining room flows into the kitchen which opens to the main living area. The kitchen has granite countertops, subway tile backsplash, large island, pantry and beautiful luxury vinyl plank flooring throughout the main floor. A half-bath on the main floor is always guest ready. Upstairs offers generously sized bedrooms, including the primary suite with tray ceiling and large windows, ensuite bath wi
Key facts
- Inviting front porch
- Large island
- Manicured lawn
Tags
Property features AI
Finance
- Other: Property zoning: CR; Directions: Use GPS
- HOA & community: Homeowner association managed by Kuester Management Group; HOA required; annual fee of $667; Community amenities include outdoor pool, playground, pond, and walking trails
Exterior
- Parking: 2-car garage (garage faces front); Driveway; 2 open parking spaces; On-street parking available
- Security: Security system; Smoke detectors
- Utilities: City water; Public sewer; Electricity connected; Fiber optics available
- Home design: Single-family residence; Residential property; Two levels; Slab foundation; Composition roof; Hardboard siding
- Construction: Site-built construction; Hardboard siding; Composition roof; Built on slab foundation
- Exterior features: Covered patio; Patio; Level, wooded lot; Concrete and paved roads; publicly maintained
Interior
- Kitchen: Dishwasher; Gas cooktop; Microwave; Plumbed for ice maker; Kitchen island
- Bedrooms: 3 bedrooms (all on upper level)
- Flooring: Carpet; Tile; Vinyl
- Bathrooms: 2 full bathrooms; 1 half bathroom (main level)
- Heating & cooling: Forced air heating (natural gas); Central air conditioning; Ceiling fans
- Interior features: Attic with pull-down stairs; Kitchen island; Gas fireplace in living room; Security system; Smoke detectors
- Laundry & utility: Laundry on upper level
Neighborhood map
What this means for you Summary
Snapshot
- This is a 3-bed/2.5-bath single-family listed at $475k.
Deal economics
- At list price, monthly cash flow is $-35 ($-419/yr) — negative.
- To cash-flow at today's rent, offer at most $469k (1.3% below list).
- To meet the 1% rule (rent ≥ 1% of price), the offer needs to be $375k (21.1% below list).
- Recommended offer: $375k (21.1% below list) — sets the bar for 1% rule.
- Cap rate 6.2% vs local median 3.1% in Midland — top-decile yield for the area; either an underpriced asset or a hidden risk that comps aren't pricing in. Stress-test before assuming the spread holds.
Location & tenants
- Location reads 69/100 on livability (#157 in NC) — a middle-class / working-renter tenant base. Strengths: crime A+, employment A+, housing A+; Watch: amenities F, commute F, health & safety F.
- Cabarrus County Schools (rural): math 54% / reading 55% proficiency, ranked #44 of 178 in NC (top 25%) — acceptable for families but not a draw, mixed tenant base, ~2y average lease.
- Zoned schools: Bethel Elementary (math 46% / reading 48%, grade D-, #497 of 1,410 statewide, top 38%, 609 students, 48% FRL); Hickory Ridge Middle (math 73% / reading 68%, grade A, #17 of 475 statewide, top 4%, 935 students, 17% FRL); Hickory Ridge High (math 70% / reading 74%, grade B+, #107 of 535 statewide, top 21%, 1,720 students, 19% FRL).
- Market conditions: 70 active listings in the ZIP; 1 comparable units currently listed for rent nearby; 2,485 units permitted in Cabarrus County in 2024 (677 in 5+ unit buildings).
Forward outlook
- Local home prices are declining (-3.0%/yr); year-one equity from $3k of loan paydown is wiped out by about $14k of value loss. Plan a longer hold.
- Cabarrus County population projected at +44% by 2050 — long-run rental-demand tailwind backs the buy-and-hold thesis.
Negotiation context
- It's been on market 78 days — a 6% lower offer ($446k) is reasonable based on typical stale-listing flexibility.
Risks & watch-outs
- Climate carrying-cost: moderate wind risk, 25% chance of damaging wind over 30y; extreme-heat days projected 7→18/yr by 2055 (HVAC capex compounding) — expect insurance premiums to compound above CPI over the hold.
Questions for the listing agent
- What do current leases actually rent for vs. the listed asking? Can we see a recent rent roll and the last 12 months of T-12 income?
- It's been on market 78 days. Have you received any prior offers? Is the seller open to a 21% concession, seller financing, or rate buy-down credit?
- What does the HOA fee cover, when was the last increase, and are there any pending special assessments or reserve-fund shortfalls?
- Why hasn't it sold? Are there any deal-killer items the seller is aware of (foundation, flood, title, zoning, code violations)?
- Is there a deadline driving the sale (1031 exchange, divorce, estate, relocation)? That informs how much negotiation room exists.
- Schools are D-rated, which usually means shorter tenancies and higher turnover. Who's the typical renter profile here, and what's been the actual vacancy rate?
- The area grade is low — what's the realistic commute time and amenity access for the typical tenant pool here? Any planned neighborhood developments (good or bad) we should know about?
- What's the average days-on-market for RENTAL listings here right now (not sales)? A rising rental-DOM trend means longer vacancies and softer asking-rent achievability than the comps imply.
- What's the recent tenant-quality profile in this submarket — average credit score on applications, eviction rate, late-payment / NSF rate, and stable-employment percentage? A property-management company in the area should have these aggregated.
- How much new for-sale + rental construction is in the pipeline within 1–3 miles? Heavy new supply typically softens prices + rents 12–24 months out; constrained supply supports both.
Investment metrics
- 1% rule
- 0.79% ✗
- Cap rate
- 6.20%
- Cash-on-cash
- -0.32%
- DSCR
- 0.99
- GRM
- 10.6
CMA / ARV
- ARV (on-the-fly)
- $516,256
- Comps found
- 4
Show comp detail 4 sales within ~0.75 mi
| Address | Dist | Beds/Ba | Sqft | Sold | Price | $/sf | Match |
|---|---|---|---|---|---|---|---|
| 11521 Vista Ridge Ct | 0.07mi | 3/2.5 | 2,592 (+4%) | 19mo | $450,000 | $174 | 74 |
| 10071 Fox Trotter Ln | 0.36mi | 4/3.0 (+1) | 2,537 (+2%) | 2mo | $495,000 | $195 | 71 |
| 11247 Serenity Farm Dr | 0.53mi | 3/2.0 | 2,304 (-7%) | 6mo | $480,000 | $208 | 56 |
| 10883 Sparkle Creek Dr | 0.72mi | 3/2.0 | 2,301 (-7%) | 1mo | $510,000 | $222 | 52 |
Match score weights: distance 35% · size 25% · config 20% · recency 20%. Top-matched comps best support the ARV.
Projected returns pro-forma
-3.0% appreciation · 3.0% rent growth · sell at horizon
- IRR
- -16.9%
- Equity multiple
- 0.40×
- Total profit
- $-79,313
- Equity at exit
- $70,824
- IRR
- -8.8%
- Equity multiple
- 0.46×
- Total profit
- $-72,410
- Equity at exit
- $41,069
Cash invested: $133,000 (down + closing). Projections, not guarantees.
Landlord ↔ Tenant lean methodology
- Overall (STATE)
- 85 Strongly Landlord-Friendly
- State North Carolina
- 85 Strongly Landlord-Friendly · R+3
- County
- — inherits STATE
- City
- — inherits STATE
ZIP-level market 28107
- Home prices YoY
- -27.6%
- Active inventory
- 70
- Price-to-rent
- 10.6×
Monthly cashflow live
- Estimated rent
- $3,750 medium interval (Pro) →
- Mortgage (P&I)
- −$2,491
- Tax from tax record
- −$253 /mo · $3,031/yr
- Insurance
- −$198
- HOA
- −$56
- Vacancy / Maint / Mgmt
- −$788
- Net cashflow
- $-35
Break-even live
Sensitivity live
| Price | -10% $234 | -5% $100 | +0% $-35 | +5% $-169 | +10% $-304 |
|---|---|---|---|---|---|
| Rent | -10% $-331 | -5% $-183 | +0% $-35 | +5% $113 | +10% $261 |
| Rate | -1.0pp $204 | -0.5pp $86 | base $-35 | +0.5pp $-158 | +1.0pp $-283 |
UW: 25.0% down · 7.5% · 30yr · 1.5% tax · 5.0% vac · 8.0% maint · 8.0% mgmt
Financing live
Cash to close
- Down payment
- $118,750
- Closing costs
- $14,250
- Reserves months
- —
- Total cash needed
- —
Loan-product check · same deal, 3 products live
Conventional
25% down · 7.5% · 30yr
- Down + closing
- —
- Monthly P&I
- —
- Monthly cashflow
- —
- DSCR
- —
- Eligible?
- —
Personal DTI + credit; lowest rate.
DSCR
20% down · 8.5% · 30yr
- Down + closing
- —
- Monthly P&I
- —
- Monthly cashflow
- —
- DSCR
- —
- Eligible?
- —
No personal income docs; deal must DSCR.
Hard money
10% down · 12.0% · 12mo
- Down + closing
- —
- Monthly P&I
- —
- Monthly cashflow
- —
- DSCR
- —
- Eligible?
- —
Short-term bridge; refi at stabilization.
Rent comps 1 comps
| Address | Beds | Baths | Sqft | Rent | $/sqft | DOM | Units | Dist |
|---|---|---|---|---|---|---|---|---|
| 1571 Morrison Rd Concord, NC | 3.0 | 3.0 | 2600 | $3,750 | $1.44 | 14d | 1 | 1.04mi |
HOA detail
- Monthly dues
- $56 · $672/yr
- Likely covers
- gas
Listing history 16 events
-
2026-06-21days on market $475,000 Active 78 DOM
-
2026-06-18days on market $475,000 Active 75 DOM
-
2026-06-17days on market $475,000 Active 74 DOM
-
2026-06-16days on market $475,000 Active 73 DOM
-
2026-06-15days on market $475,000 Active 72 DOM
-
2026-06-13days on market $475,000 Active 70 DOM
-
2026-06-09days on market $475,000 Active 66 DOM
-
2026-06-08days on market $475,000 Active 65 DOM
-
2026-06-07pricedays on market $475,000 Active 64 DOM
-
2026-06-04days on market $484,500 Active 61 DOM
-
2026-06-03days on market $484,500 Active 60 DOM
-
2026-06-02days on market $484,500 Active 59 DOM
-
2026-06-01days on market $484,500 Active 58 DOM
-
2026-05-31days on market $484,500 Active 57 DOM
-
2026-04-27price $488,000
-
2026-04-04$495,000 Active
ⓘ Source: listings_history table (triggers on properties + properties_extension) + one-shot
backfill from property_details.listing_events for pre-trigger history.
Tax reassessment forecast NC · Resets to sale price
- Current annual tax
- $3,031 · $253/mo
- Projected year-2 tax
- $3,895 · $325/mo
- Expected delta
- +$864/yr (+$72/mo · 28.5%)
ⓘ Screening estimate from a state-policy table — verify with the county assessor before closing.
Climate risk First Street
- Flood 1/10 Low FEMA zone X (unshaded) · 0% chance over 30 yrs
- Wildfire 2/10 Low
- Heat 6/10 Major 7 d/yr ≥105°F today · 18 d/yr by 30 yrs out
- Wind 5/10 Major 25% chance of damaging wind over 30 yrs
- Air quality 3/10 Moderate 3 unhealthy d/yr today · 4 by 30 yrs out
Nearby sold comps map
Loading sold comps map…
Walkable amenities ~0.75 mi
Loading nearby amenities…
Taxation est. · year 1
- Rental income
- $45,000
- − Mortgage interest
- −$26,607
- − Property taxes
- −$3,031
- − Insurance
- −$2,375
- − Repairs & maintenance
- −$3,600
- − Management
- −$3,600
- − HOA
- −$672
- − Depreciation
- −$13,818
- Taxable loss
- −$8,703
- Est. tax savings @ 24.0%
- +$2,089
- After-tax cash flow
- $1,670/yr
For passive investors: Depreciation is non-cash, so a rental often shows a tax loss while cash-flowing — sheltering income. Rental losses are passive: they offset passive income freely, and up to $25,000/yr can offset ordinary (W-2) income if you actively participate and your MAGI is under $100k (phasing out to $0 by $150k); unused losses carry forward. On sale, claimed depreciation is recaptured at up to 25%, and gains may owe capital-gains tax (a 1031 exchange can defer both). Figures are a year-1 estimate at your 24.0% rate — not tax advice; consult a CPA.
Schools (NCES district)
- District
- Cabarrus County Schools
- NCES district ID
- 3700530
- Math proficiency
- 54% ▲ 4.00%
- Reading proficiency
- 55% ▲ 3.00%
- Median HH income
- $59,442
- Composite
- 47.42/100
- National rank
- #2282
- State rank
- #44 of 178 in NC
Livability — Midland
- Score
- 69/100
- State rank
- #157
- US rank
- #8668
Category grades
Schools grade is shown separately in the Schools card above.
Census & demographics
- City population
- 9,638
- Population (ZIP)
- 9,638
Population outlook (Cabarrus County) Hauer SSP2
- Today (2025)
- 239,273 people
- By 2030
- 260,754 · +9.0%
- By 2040
- 303,953 · +27.0%
- By 2050
- 344,827 · +44.1%
- By 2075
- 435,623 · +82.1%
- By 2100
- 490,119 · +104.8%
Race, ethnicity, and origin ACS 2023
- Neighborhood character
- Predominantly White (75%)
- Race & ethnicity
- White 75% Hispanic / Latino 11% Black 8% Asian 4% Two or more races 3%
- Hispanic origin (detail)
- Mexican 7% Puerto Rican 2%
- Common ancestry
- Italian 3% Serbian 2% Slovak 2%
- Foreign-born
- 7% · Canada, South Korea, Jamaica
- Languages at home
- 89% English-only · Spanish 8% Korean 1% Other Asian/Pacific 1%
Political lean MEDSL · Cabarrus
- 2024 margin
- Lean R (+7.7) · D 45.5% · R 53.2% · Other 1.3%
- 2008→2024 swing
- +10.7pp toward D · 2008: -18.4pp · 2024: -7.7pp
- All cycles
- 2024: R+7.7 2020: R+9.4 2016: R+20.0 2012: R+20.2 2008: R+18.4
Not yet ingested
- Civics
- —
Market trends
- HPI YoY
- ▼ -105.24%
- Current HPI
- 275.7602
- Rent YoY
- —
- Metro
- —
- State GDP YoY
- ▲ 3.28%
- F500 in state
- 26
Industry mix (Fortune 500 HQ in NC)
| Industry | F500 HQs | Revenue |
|---|---|---|
| Financial Services | 2 | $213B |
|
||
| Retail | 2 | $95B |
|
||
| Industrial Conglomerate | 1 | $38B |
|
||
| Metals / Steel | 1 | $35B |
|
||
| Utilities | 1 | $30B |
|
||
| Industrial Machinery | 1 | $19B |
|
||
Price history
-1.4% since first listed2 events — show timeline
- 2026-04-27 Price Changed $488,000 CANOPYMLS as Distributed by MLS Grid
- 2026-04-04 Listed $495,000 CANOPYMLS as Distributed by MLS Grid
Property tax history
+26.1%/yrLatest (2025): $3,031 · +0.0% YoY. Source: county tax records.
Cash-flow waterfall
monthlySold comps — $/sqft
last 12 mo · ≤1 miLoading sold comps…