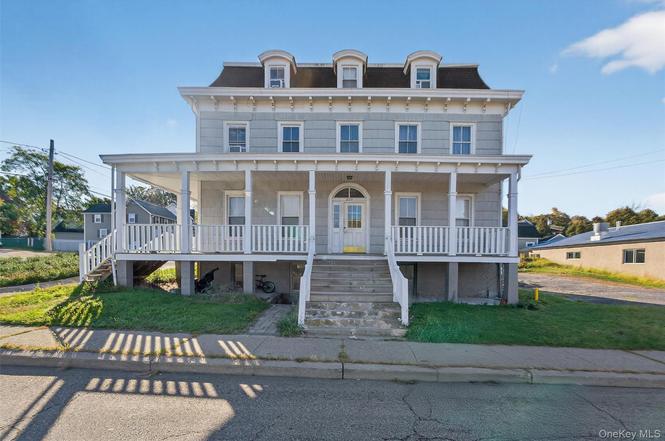
 Fourplex
239 W Main St · Goshen, NY
Flood risk 1/10 · Minimal
- FEMA flood zone
- X (unshaded)
- Chance of flooding over 30 yrs
- 0.0%
- Est. flood insurance / yr
- $473 – $860
Fire risk 3/10 · Minor
- Est. fire insurance / yr
- $691 – $1,283
Heat risk 5/10 · Moderate
- Hot days now (above 98°F)
- 7 days/yr
- Hot days in 30 yrs
- 16 days/yr
Wind risk 4/10 · Minor
- Chance of severe wind over 30 yrs
- 11.0%
Air-quality risk 2/10 · Minimal
- Unhealthy air days now
- 1 days/yr
- Unhealthy air days in 30 yrs
- 2 days/yr
Risk factors via First Street. Map © Google.
Why this score? — see what drove the B- grade
The composite is a weighted blend of 9 inputs, each scored 0–100. Each bar is that input's sub-score; the figure is the points it added to the 100-point composite (weight × sub-score).
- Cash flow +29.2/30.0
- DSCR +10.0/10.0
- 1% rule +7.9/10.0
- ARV discount +7.5/15.0
- Schools +4.0/10.0
- Livability +3.8/5.0
- Rent growth +2.5/5.0
- Condition / age +2.5/5.0
- Appreciation +0.0/10.0
$899,000
🖨 Deal sheet 📄 Offer letter ✓ Due diligence
Multi-family units
County records classify this as Multi-Family (5+ Unit). Listing-text estimate: 4 units. estimate disagrees with records
5+ unit building — per-unit beds/baths from public records are typically unavailable; the breakdown below (if shown) is an estimate from the listing text.
Listing remarks MLS
Opportunity knocking on this 4 family in heart of Goshen. Good investment seller motivated TENANTS NOT EAGER FOR SALE SO AS MUCH NOTICE AS POSSIBLE. ONLY SERIOUS BUYERS NEED APPLY
Key facts
- 0.24 acre lot
- Built 1847
- Listed 32 days
Neighborhood map
What this means for you Summary
Snapshot
- This is a 4 × 2-bed/1.0-bath units multifamily listed at $899k.
Deal economics
- At list price, monthly cash flow is $3k ($38k/yr) — positive. Per door: $782/mo.
- The deal already cash-flows at list — no discount required.
- Meets the 1% rule at list price ($12k rent vs $899k).
- Recommended offer: $872k (3.0% below list) — sets the bar for market timing.
- Cap rate 10.5% vs local median 1.3% in Goshen — top-decile yield for the area; either an underpriced asset or a hidden risk that comps aren't pricing in. Stress-test before assuming the spread holds.
Location & tenants
- Location reads 75/100 on livability (#246 in NY, #3,863 nationally) — a middle-class / working-renter tenant base. Strengths: health & safety A+, employment A, amenities B+; Watch: commute F, cost of living F.
- Goshen Central School District (suburban): math 38% / reading 47% proficiency, ranked #438 of 590 in NY (top 74%) — families likely to look elsewhere, expect single-tenant / working-renter base with shorter leases; only 16% free/reduced lunch — higher-income household profile.
- Zoned schools: Scotchtown Avenue School (547 students, 23% FRL); C J Hooker Middle School (math 17% / reading 46%, grade F, #522 of 729 statewide, top 73%, 660 students, 29% FRL); Goshen Central High School (math 94% / reading 74%, grade A, #403 of 1,100 statewide, top 37%, 1,017 students, 32% FRL).
- Zoned-school proficiency averages 58% at this address vs 42% district-wide (+15 pts) — the actual schools serving this property are materially stronger than the Goshen Central School District average implies; a family-tenant draw the district grade alone would hide.
- Market conditions: 100 active listings in the ZIP; 1,746 units permitted in Orange County in 2024 (1,265 in 5+ unit buildings).
Forward outlook
- Local home prices are declining (-3.0%/yr); year-one equity from $6k of loan paydown is wiped out by about $27k of value loss. Plan a longer hold.
- At projected returns (-3.0% appreciation + 3.0% rent growth), your $252k cash investment doubles in ~8 years — after that, you're playing with house money.
Negotiation context
- It's been on market 32 days — a 3% lower offer ($872k) is reasonable based on typical stale-listing flexibility.
- 2 sale attempts since 24y ago with the ask held roughly flat each time — persistent listings suggest the price (not the market) is what's stuck; bring a comps-based counter.
- Current owner paid $250k; list at $899k implies a 260% gain — meaningful room to come down on a strong offer.
Risks & watch-outs
- Watch-outs: built in 1847 — expect roof / HVAC / electrical / plumbing capex.
- Climate carrying-cost: extreme-heat days projected 7→16/yr by 2055 (HVAC capex compounding) — expect insurance premiums to compound above CPI over the hold.
Questions for the listing agent
- It's been on market 32 days. Have you received any prior offers? Is the seller open to a 3% concession, seller financing, or rate buy-down credit?
- Can we see the unit-by-unit rent roll, current vacancy, and any below-market leases? What's the average tenancy length?
- What capital expenditures (roof, boiler, parking lot, exteriors) have been made in the last 5 years, and what's planned in the next 2?
- Built in 1847 — when were the roof, HVAC, electrical panel, plumbing, and water heater last replaced?
- Is there a deadline driving the sale (1031 exchange, divorce, estate, relocation)? That informs how much negotiation room exists.
- Schools are A-rated — typically a magnet for longer-tenancy family renters. What's the average tenant stay here, and is there a school-zone premium baked into asking?
- What's the average days-on-market for RENTAL listings here right now (not sales)? A rising rental-DOM trend means longer vacancies and softer asking-rent achievability than the comps imply.
- What's the recent tenant-quality profile in this submarket — average credit score on applications, eviction rate, late-payment / NSF rate, and stable-employment percentage? A property-management company in the area should have these aggregated.
- How much new apartment / multifamily construction is in the pipeline within 1–3 miles? Heavy new supply (>2% of stock underway) typically softens rents 12–24 months out; light construction supports rent growth.
Investment metrics
- 1% rule
- 1.29% ✓
- Cap rate
- 10.47%
- Cash-on-cash
- 14.91%
- DSCR
- 1.66
- GRM
- 6.5
CMA / ARV
No comps found within radius.
Projected returns pro-forma
-3.0% appreciation · 3.0% rent growth · sell at horizon
- IRR
- 5.5%
- Equity multiple
- 1.21×
- Total profit
- $53,639
- Equity at exit
- $134,044
- IRR
- 14.9%
- Equity multiple
- 2.21×
- Total profit
- $303,508
- Equity at exit
- $77,729
Cash invested: $251,720 (down + closing). Projections, not guarantees.
Landlord ↔ Tenant lean methodology
- Overall (STATE)
- 15 Strongly Tenant-Friendly
- State New York
- 15 Strongly Tenant-Friendly · D+10
- County
- — inherits STATE
- City
- — inherits STATE
ZIP-level market 10924
- Home prices YoY
- -20.4%
- Active inventory
- 100
- Price-to-rent
- 25.9×
Monthly cashflow live
- Estimated rent
- $11,576 high interval (Pro) →
- Mortgage (P&I)
- −$4,714
- Tax from tax record
- −$927 /mo · $11,129/yr
- Insurance
- −$375
- HOA
- −$0
- Vacancy / Maint / Mgmt
- −$2,431
- Net cashflow
- $3,129
Break-even live
4-unit breakdown (identical units grouped — click to expand)
| Units | Beds | Baths | Est. rent |
|---|---|---|---|
| 4× units | 2 | 1 | $11,576 |
| #1 | 2 | 1 | $2,894 |
| #2 | 2 | 1 | $2,894 |
| #3 | 2 | 1 | $2,894 |
| #4 | 2 | 1 | $2,894 |
| Total (4 units) | $11,576 | ||
UW: 25.0% down · 7.5% · 30yr · 1.5% tax · 5.0% vac · 8.0% maint · 8.0% mgmt
Financing live
Cash to close
- Down payment
- $224,750
- Closing costs
- $26,970
- Reserves months
- —
- Total cash needed
- —
Loan-product check · same deal, 3 products live
Conventional
25% down · 7.5% · 30yr
- Down + closing
- —
- Monthly P&I
- —
- Monthly cashflow
- —
- DSCR
- —
- Eligible?
- —
Personal DTI + credit; lowest rate.
DSCR
20% down · 8.5% · 30yr
- Down + closing
- —
- Monthly P&I
- —
- Monthly cashflow
- —
- DSCR
- —
- Eligible?
- —
No personal income docs; deal must DSCR.
Hard money
10% down · 12.0% · 12mo
- Down + closing
- —
- Monthly P&I
- —
- Monthly cashflow
- —
- DSCR
- —
- Eligible?
- —
Short-term bridge; refi at stabilization.
Listing history 8 events
-
2025-12-02status Pending
-
2025-10-03$899,000 Active
-
2025-09-30historical $899,000
-
2003-01-21soldstatus $250,000
-
2003-01-17soldstatus $255,000 180-char remark
Show marketing remark (180 chars)
Opportunity knocking on this 4 family in heart of Goshen. Good investment seller motivated TENANTS NOT EAGER FOR SALE SO AS MUCH NOTICE AS POSSIBLE. ONLY SERIOUS BUYERS NEED APPLY
-
2002-10-28price $284,900 180-char remark
Show marketing remark (180 chars)
Opportunity knocking on this 4 family in heart of Goshen. Good investment seller motivated TENANTS NOT EAGER FOR SALE SO AS MUCH NOTICE AS POSSIBLE. ONLY SERIOUS BUYERS NEED APPLY
-
2002-10-28historical 180-char remark
Show marketing remark (180 chars)
Opportunity knocking on this 4 family in heart of Goshen. Good investment seller motivated TENANTS NOT EAGER FOR SALE SO AS MUCH NOTICE AS POSSIBLE. ONLY SERIOUS BUYERS NEED APPLY
-
2002-01-27$255,000 180-char remark
Show marketing remark (180 chars)
Opportunity knocking on this 4 family in heart of Goshen. Good investment seller motivated TENANTS NOT EAGER FOR SALE SO AS MUCH NOTICE AS POSSIBLE. ONLY SERIOUS BUYERS NEED APPLY
ⓘ Source: listings_history table (triggers on properties + properties_extension) + one-shot
backfill from property_details.listing_events for pre-trigger history.
Tax reassessment forecast NY · Partial reset (capped growth)
- Current annual tax
- $11,129 · $927/mo
- Projected year-2 tax
- $13,161 · $1,097/mo
- Expected delta
- +$2,032/yr (+$169/mo · 18.3%)
ⓘ Screening estimate from a state-policy table — verify with the county assessor before closing.
Climate risk First Street
- Flood 1/10 Low FEMA zone X (unshaded) · 0% chance over 30 yrs
- Wildfire 3/10 Moderate
- Heat 5/10 Major 7 d/yr ≥98°F today · 16 d/yr by 30 yrs out
- Wind 4/10 Moderate 11% chance of damaging wind over 30 yrs
- Air quality 2/10 Low 1 unhealthy d/yr today · 2 by 30 yrs out
Nearby sold comps map
Loading sold comps map…
Walkable amenities ~0.75 mi
Loading nearby amenities…
Taxation est. · year 1
- Rental income
- $138,912
- − Mortgage interest
- −$50,358
- − Property taxes
- −$11,129
- − Insurance
- −$4,495
- − Repairs & maintenance
- −$11,113
- − Management
- −$11,113
- − Depreciation
- −$26,153
- Taxable income
- $24,551
- Est. tax owed @ 24.0%
- −$5,892
- After-tax cash flow
- $31,651/yr
For passive investors: Depreciation is non-cash, so a rental often shows a tax loss while cash-flowing — sheltering income. Rental losses are passive: they offset passive income freely, and up to $25,000/yr can offset ordinary (W-2) income if you actively participate and your MAGI is under $100k (phasing out to $0 by $150k); unused losses carry forward. On sale, claimed depreciation is recaptured at up to 25%, and gains may owe capital-gains tax (a 1031 exchange can defer both). Figures are a year-1 estimate at your 24.0% rate — not tax advice; consult a CPA.
Schools (NCES district)
- District
- Goshen Central School District
- NCES district ID
- 3612330
- Math proficiency
- 38% ▼ -19.00%
- Reading proficiency
- 47% ▼ -4.00%
- Median HH income
- $85,528
- Composite
- 39.93/100
- National rank
- #3848
- State rank
- #438 of 590 in NY
Livability — Goshen
- Score
- 75/100
- State rank
- #246
- US rank
- #3863
Category grades
Schools grade is shown separately in the Schools card above.
Census & demographics
- Census place
- Goshen, NY
- Population (ZIP)
- 13,612
Population outlook (Orange County) Hauer SSP2
- Today (2025)
- 379,830 people
- By 2030
- 378,955 · -0.2%
- By 2040
- 375,444 · -1.2%
- By 2050
- 369,311 · -2.8%
- By 2075
- 354,233 · -6.7%
- By 2100
- 318,150 · -16.2%
Race, ethnicity, and origin ACS 2023
- Neighborhood character
- Predominantly White (71%)
- Race & ethnicity
- White 71% Hispanic / Latino 21% Two or more races 9% Black 4% Asian 3% Native American 2%
- Hispanic origin (detail)
- Mexican 6% Puerto Rican 8% Dominican 4%
- Common ancestry
- Romanian 5% Scotch-Irish 2% Lithuanian 2%
- Foreign-born
- 11% · Canada, China, South Korea
- Languages at home
- 79% English-only · Spanish 14% Other Indo-European 2% Chinese 1%
Political lean MEDSL · Orange
- 2024 margin
- Lean R (+8.4) · D 45.8% · R 54.2%
- 2008→2024 swing
- -12.5pp toward R · 2008: 4.1pp · 2024: -8.4pp
- All cycles
- 2024: R+8.4 2020: R+0.2 2016: R+6.5 2012: D+5.2 2008: D+4.1
Not yet ingested
- Civics
- —
Market trends
- HPI YoY
- ▼ -69.16%
- Current HPI
- 269.3057
- Rent YoY
- —
- Metro
- —
- State GDP YoY
- ▲ 2.60%
- F500 in state
- 92
Industry mix (Fortune 500 HQ in NY)
| Industry | F500 HQs | Revenue |
|---|---|---|
| Financial Services | 10 | $950B |
|
||
| Consumer Goods | 9 | $162B |
|
||
| Insurance | 4 | $225B |
|
||
| Telecommunications | 2 | $144B |
|
||
| Pharmaceuticals | 2 | $112B |
|
||
| Media / Entertainment | 2 | $69B |
|
||
Price history
+252.5% since first listed8 events — show timeline
- 2025-12-02 Pending — OneKey® MLS as Distributed by MLS Grid
- 2025-10-03 Listed $899,000 OneKey® MLS as Distributed by MLS Grid
- 2025-09-30 Coming Soon $899,000 OneKey® MLS as Distributed by MLS Grid
- 2003-01-21 Sold (Public Records) $250,000 Public Records
- 2003-01-17 Sold (MLS) $255,000 HGMLS
- 2002-10-28 Delisted — HGMLS
- 2002-10-28 Price Changed $284,900 HGMLS
- 2002-01-27 Listed $255,000 HGMLS
Property tax history
+1.1%/yrLatest (2025): $11,129 · +1.3% YoY. Source: county tax records.
Cash-flow waterfall
monthlySold comps — $/sqft
last 12 mo · ≤1 miLoading sold comps…