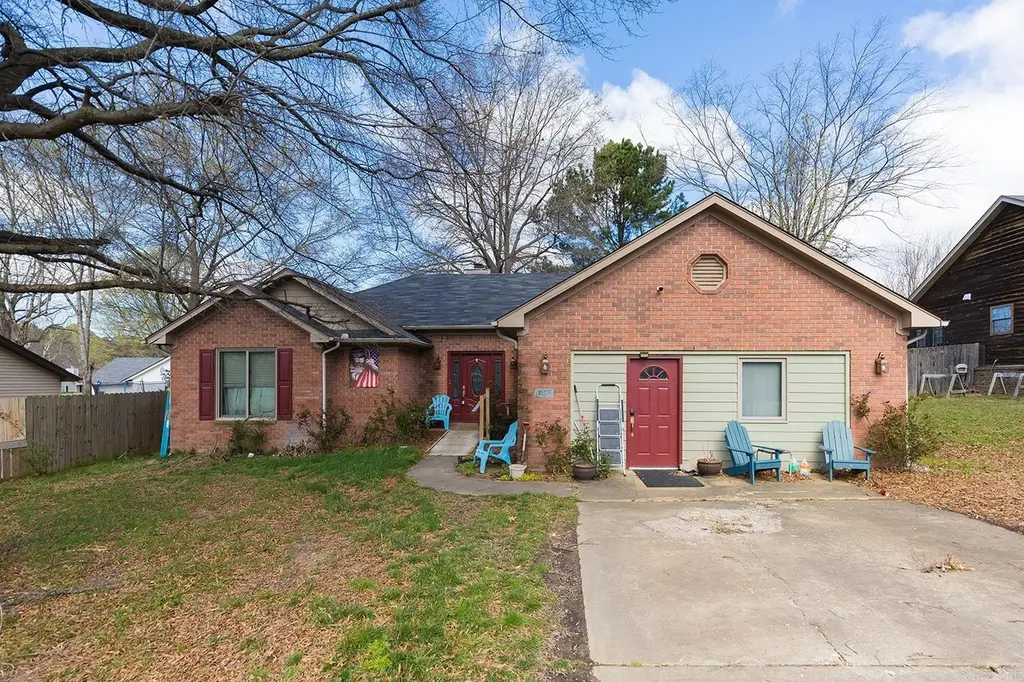
4105 Jessica Ln Ln · Jonesboro, AR
Flood risk 1/10 · Minimal
- FEMA flood zone
- X
- Chance of flooding over 30 yrs
- 0.0%
- Est. flood insurance / yr
- $507 – $1,088
Fire risk 4/10 · Minor
- Est. fire insurance / yr
- $1,499 – $2,785
Heat risk 6/10 · Moderate
- Hot days now (above 108°F)
- 7 days/yr
- Hot days in 30 yrs
- 22 days/yr
Wind risk 4/10 · Minor
- Chance of severe wind over 30 yrs
- 8.0%
Air-quality risk 2/10 · Minimal
- Unhealthy air days now
- 0 days/yr
- Unhealthy air days in 30 yrs
- 1 days/yr
Risk factors via First Street. Map © Google.
Why this score? — see what drove the A- grade
The composite is a weighted blend of 9 inputs, each scored 0–100. Each bar is that input's sub-score; the figure is the points it added to the 100-point composite (weight × sub-score).
- Cash flow +30.0/30.0
- ARV discount +15.0/15.0
- DSCR +10.0/10.0
- Appreciation +9.7/10.0
- 1% rule +7.7/10.0
- Livability +3.2/5.0
- Rent growth +2.5/5.0
- Condition / age +2.5/5.0
- Schools +1.9/10.0
$160,000
🖨 Deal sheet 📄 Offer letter ✓ Due diligence
Listing remarks MLS
Countrywood traditional brick ranch home w/ 4 bedrooms and 3 bathrooms. Fenced backyard. Convenient location. Garage conversion to an extra living room, bedroom and bathroom w/ separate entrance. Vaulted main living room w/ fireplace. Updated bathroom vanity with stone top. Lots of fun, bright colors throughout! Kitchen has eating bar overlooking a separate dining room. All personal belongings will be out of home by close.
Key facts
- Separate entrance
- Garage conversion
- Fenced backyard
Tags
Neighborhood map
What this means for you Summary
Snapshot
- This is a 4-bed/2.0-bath single-family listed at $160k.
Deal economics
- At list price, monthly cash flow is $612 ($7k/yr) — positive.
- The deal already cash-flows at list — no discount required.
- Meets the 1% rule at list price ($2k rent vs $160k).
- Recommended offer: $150k (6.0% below list) — sets the bar for market timing.
- Cap rate 10.9% vs local median 4.4% in Jonesboro — top-decile yield for the area; either an underpriced asset or a hidden risk that comps aren't pricing in. Stress-test before assuming the spread holds.
Location & tenants
- Location reads 65/100 on livability (#145 in AR) — a middle-class / working-renter tenant base. Strengths: cost of living A+, housing A+, health & safety A+; Watch: schools D, crime F, amenities F.
- Nettleton School District (urban): math 21% / reading 24% proficiency, ranked #199 of 238 in AR (top 84%) — low school quality limits family demand, transient renter base, plan for 1-2y turnover.
- Market conditions: 152 active listings in the ZIP; 2 comparable units currently listed for rent nearby; solid renter incomes; 926 units permitted in Craighead County in 2024 (69 in 5+ unit buildings).
Forward outlook
- In year one you build about $16k of equity ($1k loan paydown + $15k appreciation (9.4% local appreciation)).
- Craighead County population projected at +38% by 2050 — long-run rental-demand tailwind backs the buy-and-hold thesis.
- At projected returns (9.4% appreciation + 3.0% rent growth), your $45k cash investment doubles in ~2 years — after that, you're playing with house money.
- By year 3, paydown + projected appreciation supports a ~$41k cash-out refi (75% LTV) — recoverable capital for the next deal without selling this one.
Negotiation context
- It's been on market 61 days — a 6% lower offer ($150k) is reasonable based on typical stale-listing flexibility.
- 2 sale attempts; this cycle's ask has dropped $30k (16%) from the opening price — seller is motivated, your offer sets the floor, not the list.
- Current owner paid $96k; list at $160k implies a 67% gain — meaningful room to come down on a strong offer.
Risks & watch-outs
- Climate carrying-cost: extreme-heat days projected 7→22/yr by 2055 (HVAC capex compounding) — expect insurance premiums to compound above CPI over the hold.
Questions for the listing agent
- It's been on market 61 days. Have you received any prior offers? Is the seller open to a 6% concession, seller financing, or rate buy-down credit?
- Why hasn't it sold? Are there any deal-killer items the seller is aware of (foundation, flood, title, zoning, code violations)?
- Is there a deadline driving the sale (1031 exchange, divorce, estate, relocation)? That informs how much negotiation room exists.
- Schools are D-rated, which usually means shorter tenancies and higher turnover. Who's the typical renter profile here, and what's been the actual vacancy rate?
- Crime grade is F in this area — have there been break-ins, vandalism, or insurance claims at this property in the last 3 years? What carrier currently insures it and at what premium?
- What's the average days-on-market for RENTAL listings here right now (not sales)? A rising rental-DOM trend means longer vacancies and softer asking-rent achievability than the comps imply.
- What's the recent tenant-quality profile in this submarket — average credit score on applications, eviction rate, late-payment / NSF rate, and stable-employment percentage? A property-management company in the area should have these aggregated.
- How much new for-sale + rental construction is in the pipeline within 1–3 miles? Heavy new supply typically softens prices + rents 12–24 months out; constrained supply supports both.
Investment metrics
- 1% rule
- 1.27% ✓
- Cap rate
- 10.88%
- Cash-on-cash
- 16.39%
- DSCR
- 1.73
- GRM
- 6.5
CMA / ARV
- ARV (median comp)
- $239,502
- List price
- $160,000
- Delta
- -33.19%
- Verdict
- UNDERPRICED
- Comps
- 20 within 1.0 mi
Show comp detail 12 sales within ~0.75 mi
| Address | Dist | Beds/Ba | Sqft | Sold | Price | $/sf | Match |
|---|---|---|---|---|---|---|---|
| 4108 Stoke Dr | 0.44mi | 4/2.5 | 2,069 (+2%) | 1mo | $330,000 | $159 | 74 |
| 4212 Stoke Dr | 0.44mi | 3/2.5 (-1) | 2,000 (-2%) | 2mo | $265,000 | $133 | 68 |
| 4101 Stephanie Ln | 0.54mi | 5/2.5 (+1) | 2,048 (+1%) | 1mo | $276,000 | $135 | 65 |
| 500 N Airport Rd | 0.24mi | 4/2.0 | 1,798 (-12%) | 7mo | $268,500 | $149 | 64 |
| 300 Prospect Trl | 0.49mi | 3/2.0 (-1) | 1,924 (-5%) | 1mo | $125,000 | $65 | 62 |
| 3524 Aggie Rd | 0.57mi | 3/2.0 (-1) | 2,156 (+6%) | 8mo | $207,000 | $96 | 51 |
| 508 Brent | 0.57mi | 4/2.0 | 1,784 (-12%) | 5mo | $255,000 | $143 | 49 |
| 4001 Stoke | 0.41mi | 4/3.0 | 2,300 (+13%) | 8mo | $345,000 | $150 | 48 |
| 4001 Stoke Dr | 0.41mi | 4/3.0 | 2,300 (+13%) | 8mo | $345,000 | $150 | 48 |
| 4145 Bobcat Meadow Ln | 0.73mi | 3/2.0 (-1) | 1,928 (-5%) | 7mo | $309,900 | $161 | 47 |
| 965 Cypress Pointe | 0.74mi | 3/2.0 (-1) | 1,935 (-5%) | 8mo | $313,475 | $162 | 46 |
| 1021 Cypress Springs Cv | 0.74mi | 3/2.0 (-1) | 1,750 (-14%) | 8mo | $279,900 | $160 | 31 |
Match score weights: distance 35% · size 25% · config 20% · recency 20%. Top-matched comps best support the ARV.
Projected returns pro-forma
9.42% appreciation · 3.0% rent growth · sell at horizon
- IRR
- 35.4%
- Equity multiple
- 3.67×
- Total profit
- $119,763
- Equity at exit
- $137,419
- IRR
- 30.7%
- Equity multiple
- 8.15×
- Total profit
- $320,480
- Equity at exit
- $289,475
Cash invested: $44,800 (down + closing). Projections, not guarantees.
Landlord ↔ Tenant lean methodology
- Overall (STATE)
- 92 Strongly Landlord-Friendly
- State Arkansas
- 92 Strongly Landlord-Friendly · R+14
- County
- — inherits STATE
- City
- — inherits STATE
ZIP-level market 72405
- Home prices YoY
- 3.5%
- Active inventory
- 152
- Price-to-rent
- 6.5×
Monthly cashflow live
- Estimated rent
- $2,038 medium interval (Pro) →
- Mortgage (P&I)
- −$839
- Tax from tax record
- −$92 /mo · $1,106/yr
- Insurance
- −$67
- HOA
- −$0
- Vacancy / Maint / Mgmt
- −$428
- Net cashflow
- $612
Break-even live
UW: 25.0% down · 7.5% · 30yr · 1.5% tax · 5.0% vac · 8.0% maint · 8.0% mgmt
Financing live
Cash to close
- Down payment
- $40,000
- Closing costs
- $4,800
- Reserves months
- —
- Total cash needed
- —
Loan-product check · same deal, 3 products live
Conventional
25% down · 7.5% · 30yr
- Down + closing
- —
- Monthly P&I
- —
- Monthly cashflow
- —
- DSCR
- —
- Eligible?
- —
Personal DTI + credit; lowest rate.
DSCR
20% down · 8.5% · 30yr
- Down + closing
- —
- Monthly P&I
- —
- Monthly cashflow
- —
- DSCR
- —
- Eligible?
- —
No personal income docs; deal must DSCR.
Hard money
10% down · 12.0% · 12mo
- Down + closing
- —
- Monthly P&I
- —
- Monthly cashflow
- —
- DSCR
- —
- Eligible?
- —
Short-term bridge; refi at stabilization.
Rent comps 2 comps
| Address | Beds | Baths | Sqft | Rent | $/sqft | DOM | Units | Dist |
|---|---|---|---|---|---|---|---|---|
| 337 Wolf Den Dr Jonesboro, AR | 3.0 | 2.0 | 1419 | $1,600 | $1.13 | 43d | 1 | 0.28mi |
| 259 Wolf Den Dr Jonesboro, AR | 3.0 | 2.0 | 1419 | $1,550 | $1.09 | 43d | 1 | 0.31mi |
Listing history 8 events
-
2026-05-18status Under Contract 426-char remark
Show marketing remark (426 chars)
Countrywood traditional brick ranch home w/ 4 bedrooms and 3 bathrooms. Fenced backyard. Convenient location. Garage conversion to an extra living room, bedroom and bathroom w/ separate entrance. Vaulted main living room w/ fireplace. Updated bathroom vanity with stone top. Lots of fun, bright colors throughout! Kitchen has eating bar overlooking a separate dining room. All personal belongings will be out of home by close.
-
2026-05-03historical Take Backups 426-char remark
Show marketing remark (426 chars)
Countrywood traditional brick ranch home w/ 4 bedrooms and 3 bathrooms. Fenced backyard. Convenient location. Garage conversion to an extra living room, bedroom and bathroom w/ separate entrance. Vaulted main living room w/ fireplace. Updated bathroom vanity with stone top. Lots of fun, bright colors throughout! Kitchen has eating bar overlooking a separate dining room. All personal belongings will be out of home by close.
-
2026-04-30status Back on Market 426-char remark
Show marketing remark (426 chars)
Countrywood traditional brick ranch home w/ 4 bedrooms and 3 bathrooms. Fenced backyard. Convenient location. Garage conversion to an extra living room, bedroom and bathroom w/ separate entrance. Vaulted main living room w/ fireplace. Updated bathroom vanity with stone top. Lots of fun, bright colors throughout! Kitchen has eating bar overlooking a separate dining room. All personal belongings will be out of home by close.
-
2026-04-23historical Take Backups 426-char remark
Show marketing remark (426 chars)
Countrywood traditional brick ranch home w/ 4 bedrooms and 3 bathrooms. Fenced backyard. Convenient location. Garage conversion to an extra living room, bedroom and bathroom w/ separate entrance. Vaulted main living room w/ fireplace. Updated bathroom vanity with stone top. Lots of fun, bright colors throughout! Kitchen has eating bar overlooking a separate dining room. All personal belongings will be out of home by close.
-
2026-04-10price $160,000 426-char remark
Show marketing remark (426 chars)
Countrywood traditional brick ranch home w/ 4 bedrooms and 3 bathrooms. Fenced backyard. Convenient location. Garage conversion to an extra living room, bedroom and bathroom w/ separate entrance. Vaulted main living room w/ fireplace. Updated bathroom vanity with stone top. Lots of fun, bright colors throughout! Kitchen has eating bar overlooking a separate dining room. All personal belongings will be out of home by close.
-
2026-03-22price $175,000 426-char remark
Show marketing remark (426 chars)
Countrywood traditional brick ranch home w/ 4 bedrooms and 3 bathrooms. Fenced backyard. Convenient location. Garage conversion to an extra living room, bedroom and bathroom w/ separate entrance. Vaulted main living room w/ fireplace. Updated bathroom vanity with stone top. Lots of fun, bright colors throughout! Kitchen has eating bar overlooking a separate dining room. All personal belongings will be out of home by close.
-
2026-03-18$190,000 New Listing 426-char remark
Show marketing remark (426 chars)
Countrywood traditional brick ranch home w/ 4 bedrooms and 3 bathrooms. Fenced backyard. Convenient location. Garage conversion to an extra living room, bedroom and bathroom w/ separate entrance. Vaulted main living room w/ fireplace. Updated bathroom vanity with stone top. Lots of fun, bright colors throughout! Kitchen has eating bar overlooking a separate dining room. All personal belongings will be out of home by close.
-
2001-07-09soldstatus $96,000
ⓘ Source: listings_history table (triggers on properties + properties_extension) + one-shot
backfill from property_details.listing_events for pre-trigger history.
Tax reassessment forecast AR · Resets to sale price
- Current annual tax
- $1,106 · $92/mo
- Projected year-2 tax
- $1,106 · $92/mo
- Expected delta
- $0/yr ($0/mo · 0.0%)
ⓘ Screening estimate from a state-policy table — verify with the county assessor before closing.
Climate risk First Street
- Flood 1/10 Low FEMA zone X · 0% chance over 30 yrs
- Wildfire 4/10 Moderate
- Heat 6/10 Major 7 d/yr ≥108°F today · 22 d/yr by 30 yrs out
- Wind 4/10 Moderate 8% chance of damaging wind over 30 yrs
- Air quality 2/10 Low 0 unhealthy d/yr today · 1 by 30 yrs out
Nearby sold comps map
Loading sold comps map…
Walkable amenities ~0.75 mi
Loading nearby amenities…
Taxation est. · year 1
- Rental income
- $24,453
- − Mortgage interest
- −$8,962
- − Property taxes
- −$1,106
- − Insurance
- −$800
- − Repairs & maintenance
- −$1,956
- − Management
- −$1,956
- − Depreciation
- −$4,655
- Taxable income
- $5,018
- Est. tax owed @ 24.0%
- −$1,204
- After-tax cash flow
- $6,139/yr
For passive investors: Depreciation is non-cash, so a rental often shows a tax loss while cash-flowing — sheltering income. Rental losses are passive: they offset passive income freely, and up to $25,000/yr can offset ordinary (W-2) income if you actively participate and your MAGI is under $100k (phasing out to $0 by $150k); unused losses carry forward. On sale, claimed depreciation is recaptured at up to 25%, and gains may owe capital-gains tax (a 1031 exchange can defer both). Figures are a year-1 estimate at your 24.0% rate — not tax advice; consult a CPA.
Schools (NCES district)
- District
- Nettleton School District
- NCES district ID
- 0510440
- Math proficiency
- 21% ▼ -16.00%
- Reading proficiency
- 24% ▼ -12.00%
- Median HH income
- $39,754
- Composite
- 19.0/100
- National rank
- #8846
- State rank
- #199 of 238 in AR
Livability — Jonesboro
- Score
- 65/100
- State rank
- #145
- US rank
- #12692
Category grades
Schools grade is shown separately in the Schools card above.
Census & demographics
- Census place
- Jonesboro, AR
- County
- Craighead County · 97,185 people
- City population
- 91,245
- Metro
- Jonesboro, AR
- Population (ZIP)
- 18,675
- Household income
- $92,440
- Rent vs Own
- Severe rent burden
- 443.0
Population outlook (Craighead County) Hauer SSP2
- Today (2025)
- 122,235 people
- By 2030
- 131,338 · +7.4%
- By 2040
- 149,862 · +22.6%
- By 2050
- 168,034 · +37.5%
- By 2075
- 208,094 · +70.2%
- By 2100
- 233,251 · +90.8%
Race, ethnicity, and origin ACS 2023
- Neighborhood character
- Predominantly White (78%)
- Race & ethnicity
- White 78% Two or more races 10% Black 9% Hispanic / Latino 3% Asian 1%
- Common ancestry
- Slovak 2% Italian 1% Serbian 1%
- Foreign-born
- 4% · Canada
- Languages at home
- 93% English-only · Spanish 4% Arabic 1%
Political lean MEDSL · Craighead
- 2024 margin
- Solid R (+37.4) · D 30.1% · R 67.5% · Other 2.4%
- 2008→2024 swing
- -12.9pp toward R · 2008: -24.5pp · 2024: -37.4pp
- All cycles
- 2024: R+37.4 2020: R+35.4 2016: R+35.2 2012: R+31.1 2008: R+24.5
Not yet ingested
- Civics
- —
Market trends
- HPI YoY
- ▲ 9.42%
- Current HPI
- 277.37
- Rent YoY
- —
- Metro
- Jonesboro, AR
- State GDP YoY
- ▲ 3.80%
- F500 in state
- 10
Industry mix (Fortune 500 HQ in AR)
| Industry | F500 HQs | Revenue |
|---|---|---|
| Retail | 1 | $681B |
|
||
| Food / Agriculture | 1 | $53B |
|
||
| Retail / Energy | 1 | $22B |
|
||
| Transportation / Logistics | 1 | $12B |
|
||
| Energy | 1 | $4B |
|
||
Price history
+66.7% since first listed8 events — show timeline
- 2026-05-18 Pending — CARMLS
- 2026-05-03 Contingent — CARMLS
- 2026-04-30 Relisted — CARMLS
- 2026-04-23 Contingent — CARMLS
- 2026-04-10 Price Changed $160,000 CARMLS
- 2026-03-22 Price Changed $175,000 CARMLS
- 2026-03-18 Listed $190,000 CARMLS
- 2001-07-09 Sold (Public Records) $96,000 Public Records
Property tax history
+3.4%/yrLatest (2025): $1,106 · +12.5% YoY. Source: county tax records.
Cash-flow waterfall
monthlySold comps — $/sqft
last 12 mo · ≤1 miLoading sold comps…