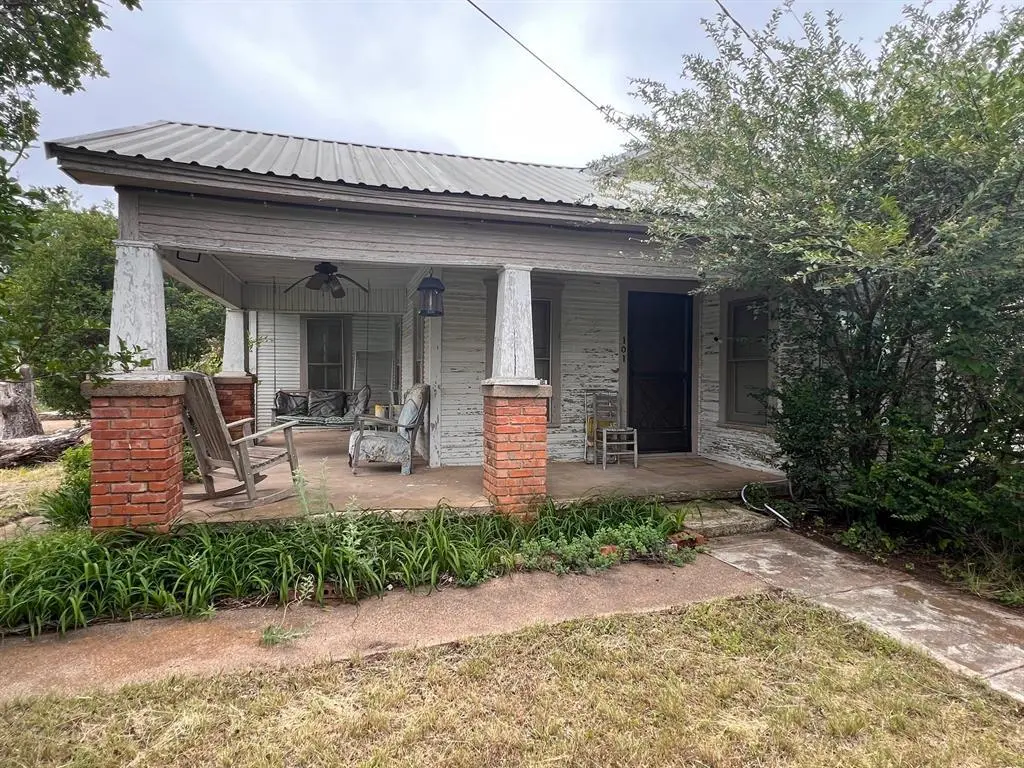
101 E Commerce St · Gustine, TX
Flood risk 1/10 · Minimal
- FEMA flood zone
- —
- Chance of flooding over 30 yrs
- 0.0%
- Est. flood insurance / yr
- —
Fire risk 6/10 · Moderate
- Est. fire insurance / yr
- $1,222 – $2,270
Heat risk 7/10 · Major
- Hot days now (above 107°F)
- 7 days/yr
- Hot days in 30 yrs
- 23 days/yr
Wind risk 6/10 · Moderate
- Chance of severe wind over 30 yrs
- 27.0%
Air-quality risk 1/10 · Minimal
- Unhealthy air days now
- 0 days/yr
- Unhealthy air days in 30 yrs
- 0 days/yr
Risk factors via First Street. Map © Google.
Why this score? — see what drove the A- grade
The composite is a weighted blend of 9 inputs, each scored 0–100. Each bar is that input's sub-score; the figure is the points it added to the 100-point composite (weight × sub-score).
- Cash flow +29.1/30.0
- ARV discount +15.0/15.0
- DSCR +10.0/10.0
- 1% rule +7.7/10.0
- Appreciation +6.8/10.0
- Schools +3.6/10.0
- Livability +3.0/5.0
- Rent growth +2.5/5.0
- Condition / age +2.5/5.0
$79,900
🖨 Deal sheet 📄 Offer letter ✓ Due diligence
Listing remarks
Two homes for the price of one! This property features a 2 bedroom, 1 bath home with covered porches alongside a 1 bed, 1 bath casita with a carport. Both homes have metal roofs, updated wiring and plumbing (2011) and washer & dryer hookups! Situated on a corner lot with a 50 amp RV hookup, circle drive, storm shelter, fruit trees & garden area. This place is as practical as it is unique! Being sold AS-IS.
Key facts
- 50 amp rv hookup
- Covered porches
- Updated wiring
Tags
Property features AI
Finance
- Other: Property is not attached; Will not subdivide
- Financial info: Listing accepts Cash and Conventional offers; Second mortgage: none
- HOA & community: No association
Exterior
- Parking: Attached carport; Covered parking (1 space); 1-car carport space; Circular driveway
- Utilities: City sewer; City water; Well
- Home design: Single-family residence; One story; Residential property; Built in 1920
- Construction: Metal roof; Pillar/post/pier foundation
- Exterior features: Covered porch(es); Covered patio/porch; RV hookup; Storm cellar; Corner lot
Interior
- Kitchen: Electric range; Refrigerator
- Bedrooms: 3 bedrooms (primary bedroom on the main level)
- Flooring: Wood floors
- Bathrooms: 2 full bathrooms
- Heating & cooling: Window unit cooling; Gas jets heating (no other central heating listed)
- Interior features: Two living areas; One dining area; Window coverings; Other interior details
- Laundry & utility: Washer hookup
Neighborhood map
What this means for you Summary
Snapshot
- This is a 3-bed/1.0-bath single-family listed at $80k.
Deal economics
- At list price, monthly cash flow is $275 ($3k/yr) — positive.
- The deal already cash-flows at list — no discount required.
- Meets the 1% rule at list price ($1k rent vs $80k).
- Recommended offer: $78k (3.0% below list) — sets the bar for market timing.
Location & tenants
- Location reads 59/100 on livability (#1,143 in TX) — a working-class tenant base; expect higher turnover. Strengths: cost of living A+, housing A; Watch: employment D+, health & safety D+, schools D-.
- Gustine ISD (rural): math 45% / reading 35% proficiency, ranked #730 of 1,141 in TX (top 64%) — families likely to look elsewhere, expect single-tenant / working-renter base with shorter leases; 68% free/reduced lunch — lower-income household profile, screen leases tightly.
- Market conditions: 34 active listings in the ZIP; 4 units permitted in Comanche County in 2024 (0 in 5+ unit buildings).
Forward outlook
- In year one you build about $3k of equity ($552 loan paydown + $3k appreciation (3.6% local appreciation)).
- Comanche County population projected at -29% by 2050 — secular population decline; favor cash flow + early exit over multi-decade hold.
- At projected returns (3.6% appreciation + 3.0% rent growth), your $22k cash investment doubles in ~4 years — after that, you're playing with house money.
- By year 10, paydown + projected appreciation supports a ~$33k cash-out refi (75% LTV) — recoverable capital for the next deal without selling this one.
Negotiation context
- It's been on market 41 days — a 3% lower offer ($78k) is reasonable based on typical stale-listing flexibility.
Risks & watch-outs
- Watch-outs: built in 1920 — expect roof / HVAC / electrical / plumbing capex.
- Climate carrying-cost: major wind risk, 27% chance of damaging wind over 30y; major wildfire risk; extreme-heat days projected 7→23/yr by 2055 (HVAC capex compounding) — expect insurance premiums to compound above CPI over the hold.
Questions for the listing agent
- It's been on market 41 days. Have you received any prior offers? Is the seller open to a 3% concession, seller financing, or rate buy-down credit?
- Built in 1920 — when were the roof, HVAC, electrical panel, plumbing, and water heater last replaced?
- Is there a deadline driving the sale (1031 exchange, divorce, estate, relocation)? That informs how much negotiation room exists.
- Schools are D-rated, which usually means shorter tenancies and higher turnover. Who's the typical renter profile here, and what's been the actual vacancy rate?
- Crime grade is F in this area — have there been break-ins, vandalism, or insurance claims at this property in the last 3 years? What carrier currently insures it and at what premium?
- What's the average days-on-market for RENTAL listings here right now (not sales)? A rising rental-DOM trend means longer vacancies and softer asking-rent achievability than the comps imply.
- What's the recent tenant-quality profile in this submarket — average credit score on applications, eviction rate, late-payment / NSF rate, and stable-employment percentage? A property-management company in the area should have these aggregated.
- How much new for-sale + rental construction is in the pipeline within 1–3 miles? Heavy new supply typically softens prices + rents 12–24 months out; constrained supply supports both.
Investment metrics
- 1% rule
- 1.27% ✓
- Cap rate
- 10.43%
- Cash-on-cash
- 14.76%
- DSCR
- 1.66
- GRM
- 6.6
CMA / ARV
- ARV (median comp)
- $136,707
- List price
- $79,900
- Delta
- -41.55%
- Verdict
- UNDERPRICED
- Comps
- 5 within 1.0 mi
Show comp detail 1 sale within ~0.75 mi
| Address | Dist | Beds/Ba | Sqft | Sold | Price | $/sf | Match |
|---|---|---|---|---|---|---|---|
| 103 S Cotton Belt | 0.14mi | 3/2.0 | 1,040 (+6%) | 11mo | $169,000 | $163 | 70 |
Match score weights: distance 35% · size 25% · config 20% · recency 20%. Top-matched comps best support the ARV.
Projected returns pro-forma
3.61% appreciation · 3.0% rent growth · sell at horizon
- IRR
- 22.7%
- Equity multiple
- 2.33×
- Total profit
- $29,775
- Equity at exit
- $38,717
- IRR
- 23.1%
- Equity multiple
- 4.50×
- Total profit
- $78,283
- Equity at exit
- $61,935
Cash invested: $22,372 (down + closing). Projections, not guarantees.
Landlord ↔ Tenant lean methodology
- Overall (STATE)
- 87 Strongly Landlord-Friendly
- State Texas
- 87 Strongly Landlord-Friendly · R+5
- County
- — inherits STATE
- City
- — inherits STATE
ZIP-level market 76455
- Home prices YoY
- 3.1%
- Active inventory
- 34
- Price-to-rent
- 6.6×
Monthly cashflow live
- Estimated rent
- $1,016 medium interval (Pro) →
- Mortgage (P&I)
- −$419
- Tax from tax record
- −$75 /mo · $904/yr
- Insurance
- −$33
- HOA
- −$0
- Vacancy / Maint / Mgmt
- −$213
- Net cashflow
- $275
Break-even live
UW: 25.0% down · 7.5% · 30yr · 1.5% tax · 5.0% vac · 8.0% maint · 8.0% mgmt
Financing live
Cash to close
- Down payment
- $19,975
- Closing costs
- $2,397
- Reserves months
- —
- Total cash needed
- —
Loan-product check · same deal, 3 products live
Conventional
25% down · 7.5% · 30yr
- Down + closing
- —
- Monthly P&I
- —
- Monthly cashflow
- —
- DSCR
- —
- Eligible?
- —
Personal DTI + credit; lowest rate.
DSCR
20% down · 8.5% · 30yr
- Down + closing
- —
- Monthly P&I
- —
- Monthly cashflow
- —
- DSCR
- —
- Eligible?
- —
No personal income docs; deal must DSCR.
Hard money
10% down · 12.0% · 12mo
- Down + closing
- —
- Monthly P&I
- —
- Monthly cashflow
- —
- DSCR
- —
- Eligible?
- —
Short-term bridge; refi at stabilization.
Listing history 17 events
-
2026-06-18days on market $79,900 Active 41 DOM
-
2026-06-17days on market $79,900 Active 40 DOM
-
2026-06-16days on market $79,900 Active 39 DOM
-
2026-06-15days on market $79,900 Active 38 DOM
-
2026-06-13days on market $79,900 Active 36 DOM
-
2026-06-12days on market $79,900 Active 35 DOM
-
2026-06-09days on market $79,900 Active 32 DOM
-
2026-06-08days on market $79,900 Active 31 DOM
-
2026-06-08days on market $79,900 Active 30 DOM
-
2026-06-05days on market $79,900 Active 28 DOM
-
2026-06-03days on market $79,900 Active 26 DOM
-
2026-06-02days on market $79,900 Active 25 DOM
-
2026-06-01days on market $79,900 Active 24 DOM
-
2026-05-31days on market $79,900 Active 23 DOM
-
2026-05-08$79,900 Active 417-char remark
-
2009-01-30soldstatus
-
2009-01-30soldstatus
ⓘ Source: listings_history table (triggers on properties + properties_extension) + one-shot
backfill from property_details.listing_events for pre-trigger history.
Tax reassessment forecast TX · Resets to sale price
- Current annual tax
- $904 · $75/mo
- Projected year-2 tax
- $1,462 · $122/mo
- Expected delta
- +$558/yr (+$46/mo · 61.7%)
ⓘ Screening estimate from a state-policy table — verify with the county assessor before closing.
Climate risk First Street
- Flood 1/10 Low 0% chance over 30 yrs
- Wildfire 6/10 Major
- Heat 7/10 Severe 7 d/yr ≥107°F today · 23 d/yr by 30 yrs out
- Wind 6/10 Major 27% chance of damaging wind over 30 yrs
- Air quality 1/10 Low 0 unhealthy d/yr today · 0 by 30 yrs out
Nearby sold comps map
Loading sold comps map…
Walkable amenities ~0.75 mi
Loading nearby amenities…
Taxation est. · year 1
- Rental income
- $12,195
- − Mortgage interest
- −$4,476
- − Property taxes
- −$904
- − Insurance
- −$400
- − Repairs & maintenance
- −$976
- − Management
- −$976
- − Depreciation
- −$2,324
- Taxable income
- $2,140
- Est. tax owed @ 24.0%
- −$514
- After-tax cash flow
- $2,789/yr
For passive investors: Depreciation is non-cash, so a rental often shows a tax loss while cash-flowing — sheltering income. Rental losses are passive: they offset passive income freely, and up to $25,000/yr can offset ordinary (W-2) income if you actively participate and your MAGI is under $100k (phasing out to $0 by $150k); unused losses carry forward. On sale, claimed depreciation is recaptured at up to 25%, and gains may owe capital-gains tax (a 1031 exchange can defer both). Figures are a year-1 estimate at your 24.0% rate — not tax advice; consult a CPA.
Schools (NCES district)
- District
- Gustine ISD
- NCES district ID
- 4821990
- Math proficiency
- 45% ▲ 15.00%
- Reading proficiency
- 35% ▼ -5.00%
- Median HH income
- $43,291
- Composite
- 36.3/100
- National rank
- #9403
- State rank
- #730 of 1141 in TX
Livability — Gustine
- Score
- 59/100
- State rank
- #1143
- US rank
- #20139
Category grades
Schools grade is shown separately in the Schools card above.
Census & demographics
- Census place
- Gustine, TX
- Population (ZIP)
- 675
Population outlook (Comanche County) Hauer SSP2
- Today (2025)
- 12,214 people
- By 2030
- 11,531 · -5.6%
- By 2040
- 10,132 · -17.0%
- By 2050
- 8,724 · -28.6%
- By 2075
- 5,684 · -53.5%
- By 2100
- 3,649 · -70.1%
Race, ethnicity, and origin ACS 2023
- Neighborhood character
- Predominantly White (70%)
- Race & ethnicity
- White 70% Hispanic / Latino 29% Two or more races 22%
- Hispanic origin (detail)
- Mexican 28%
- Common ancestry
- Italian 7% Portuguese 2% Serbian 1%
- Foreign-born
- 15% · Canada, South Korea
- Languages at home
- 76% English-only · Spanish 24%
Political lean MEDSL · Comanche
- 2024 margin
- Solid R (+74.0) · D 12.7% · R 86.8%
- 2008→2024 swing
- -26.5pp toward R · 2008: -47.5pp · 2024: -74.0pp
- All cycles
- 2024: R+74.0 2020: R+71.0 2016: R+67.4 2012: R+62.3 2008: R+47.5
Not yet ingested
- Civics
- —
Market trends
- HPI YoY
- ▲ 3.61%
- Current HPI
- 119.1119
- Rent YoY
- —
- Metro
- —
- State GDP YoY
- ▲ 3.95%
- F500 in state
- 110
Industry mix (Fortune 500 HQ in TX)
| Industry | F500 HQs | Revenue |
|---|---|---|
| Energy | 16 | $1,198B |
|
||
| Technology | 5 | $198B |
|
||
| Engineering / Construction | 4 | $72B |
|
||
| Energy Services | 3 | $60B |
|
||
| Utilities | 3 | $41B |
|
||
| Healthcare | 2 | $330B |
|
||
Price history
3 events — show timeline
- 2026-05-08 Listed $79,900 NTREIS
- 2009-01-30 Sold (Public Records) — Public Records
- 2009-01-30 Sold (Public Records) — Public Records
Property tax history
+2.9%/yrLatest (2025): $904 · +9.2% YoY. Source: county tax records.
Cash-flow waterfall
monthlySold comps — $/sqft
last 12 mo · ≤1 miLoading sold comps…