 🔨 Auction
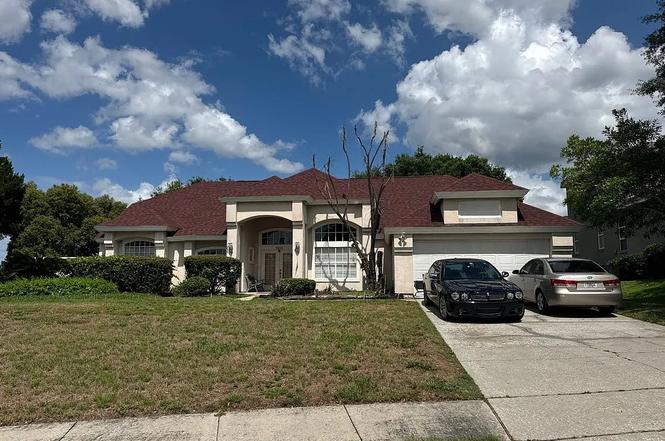
1242 Shelter Rock Rd · Orlando, FL
Flood risk 1/10 · Minimal
- FEMA flood zone
- X (unshaded)
- Chance of flooding over 30 yrs
- 0.0%
- Est. flood insurance / yr
- $507 – $1,088
Fire risk 1/10 · Minimal
- Est. fire insurance / yr
- $947 – $1,759
Heat risk 9/10 · Severe
- Hot days now (above 108°F)
- 7 days/yr
- Hot days in 30 yrs
- 24 days/yr
Wind risk 9/10 · Severe
- Chance of severe wind over 30 yrs
- 99.0%
Air-quality risk 1/10 · Minimal
- Unhealthy air days now
- 0 days/yr
- Unhealthy air days in 30 yrs
- 0 days/yr
Risk factors via First Street. Map © Google.
Why this score? — see what drove the F grade
The composite is a weighted blend of 9 inputs, each scored 0–100. Each bar is that input's sub-score; the figure is the points it added to the 100-point composite (weight × sub-score).
- ARV discount +7.5/15.0
- Livability +4.3/5.0
- Schools +4.1/10.0
- Cash flow +3.3/30.0
- Condition / age +2.5/5.0
- Rent growth +2.2/5.0
- 1% rule +0.0/10.0
- DSCR +0.0/10.0
- Appreciation +0.0/10.0
$5,000
🖨 Deal sheet 📄 Offer letter ✓ Due diligence
Listing remarks
Foreclosure Auction Ends June 25, 2026 at 11:00 AM EST. Explore this charming 5-bedroom, 4-bath residence set in a peaceful and well-located Orlando community. The list price is the opening bid for the online auction. Sold As-is. Explore more details and submit your bid through Federa.
Key facts
- 2 garage spots
- Listed 2 days
Property features AI
Finance
- Other: Directions: From FL-408 take Exit 5, head south on Hiawassee Rd, turn onto Old Winter Garden Rd, then onto Shelter Rock Rd to the property
Exterior
- Parking: 2-car garage
- Home design: Residential property
- Exterior features: Lot approximately 0.35 acres; Zoned R-1A
Interior
- Bathrooms: Four full bathrooms
- Interior features: Single-story layout
Neighborhood map
What this means for you Summary
Snapshot
- This is a 5-bed/4.0-bath single-family listed at $5k.
Deal economics
- At list price, monthly cash flow is $-2k ($-28k/yr) — negative.
- The deal already cash-flows at list — no discount required.
- Meets the 1% rule at list price ($4k rent vs $5k).
Location & tenants
- Location reads 86/100 on livability (#12 in FL, #360 nationally) — a professional / high-income tenant draw. Strengths: amenities A+, commute A+, housing A+.
- Orange (suburban): math 46% / reading 51% proficiency, ranked #43 of 73 in FL (top 59%) — families likely to look elsewhere, expect single-tenant / working-renter base with shorter leases.
- Market conditions: Rents soft (-1.2%/yr); 376 active listings in the ZIP; 7 comparable units currently listed for rent nearby; rentals at typical pace (median 16d on market — plan ~3-4 weeks tenant-placement turnaround); 8,053 units permitted in Orange County in 2024 (3,133 in 5+ unit buildings).
- At $3,565/mo this rent would consume 60% of the median local household income ($71k/yr) (locally 2914% of renters already pay >50% of income on rent) — very limited rent-growth headroom before tenants either downsize or default.
Forward outlook
- Local home prices are declining (-3.0%/yr); year-one equity from $5k of loan paydown is wiped out by about $22k of value loss. Plan a longer hold.
- Orange County population projected at +52% by 2050 — long-run rental-demand tailwind backs the buy-and-hold thesis.
Negotiation context
- Only 2 days on market — expect competitive offers; lowballing is unlikely to land.
Risks & watch-outs
- Watch-outs: property tax is 221.8% of price.
- Climate carrying-cost: severe wind risk, 99% chance of damaging wind over 30y; extreme-heat days projected 7→24/yr by 2055 (HVAC capex compounding) — expect insurance premiums to compound above CPI over the hold.
Questions for the listing agent
- What do current leases actually rent for vs. the listed asking? Can we see a recent rent roll and the last 12 months of T-12 income?
- Property tax is high relative to price — has the assessment been appealed recently, and will the sale trigger a re-assessment?
- Is there a deadline driving the sale (1031 exchange, divorce, estate, relocation)? That informs how much negotiation room exists.
- Schools are B-rated — typically a magnet for longer-tenancy family renters. What's the average tenant stay here, and is there a school-zone premium baked into asking?
- The area grade is low — what's the realistic commute time and amenity access for the typical tenant pool here? Any planned neighborhood developments (good or bad) we should know about?
- What's the average days-on-market for RENTAL listings here right now (not sales)? A rising rental-DOM trend means longer vacancies and softer asking-rent achievability than the comps imply.
- What's the recent tenant-quality profile in this submarket — average credit score on applications, eviction rate, late-payment / NSF rate, and stable-employment percentage? A property-management company in the area should have these aggregated.
- How much new for-sale + rental construction is in the pipeline within 1–3 miles? Heavy new supply typically softens prices + rents 12–24 months out; constrained supply supports both.
Investment metrics
- 1% rule
- 0.48% ✗
- Cap rate
- 2.57%
- Cash-on-cash
- -13.29%
- DSCR
- 0.41
- GRM
- 17.3
CMA / ARV
- ARV (on-the-fly)
- $739,328
- Comps found
- 5
Show comp detail 5 sales within ~0.75 mi
| Address | Dist | Beds/Ba | Sqft | Sold | Price | $/sf | Match |
|---|---|---|---|---|---|---|---|
| 1867 Verde Way | 0.38mi | 5/3.0 | 2,848 (-1%) | 0mo | $750,000 | $263 | 76 |
| 7613 Torino Ct | 0.39mi | 5/3.5 | 2,775 (-4%) | 2mo | $678,900 | $245 | 72 |
| 2232 Lake Vilma Dr | 0.59mi | 4/3.0 (-1) | 2,795 (-3%) | 4mo | $715,000 | $256 | 55 |
| 2204 Kettle Dr | 0.54mi | 4/2.5 (-1) | 2,892 (+0%) | 15mo | $749,000 | $259 | 51 |
| 2273 Kettle Dr | 0.60mi | 5/4.0 | 3,042 (+5%) | 23mo | $719,500 | $237 | 44 |
Match score weights: distance 35% · size 25% · config 20% · recency 20%. Top-matched comps best support the ARV.
Projected returns pro-forma
-3.0% appreciation · 0.0% rent growth · sell at horizon
- IRR
- -44.4%
- Equity multiple
- -0.33×
- Total profit
- $-276,236
- Equity at exit
- $110,236
- IRR
- -99.9%
- Equity multiple
- -1.26×
- Total profit
- $-468,749
- Equity at exit
- $63,924
Cash invested: $207,012 (down + closing). Projections, not guarantees.
Landlord ↔ Tenant lean methodology
- Overall (STATE)
- 87 Strongly Landlord-Friendly
- State Florida
- 87 Strongly Landlord-Friendly · R+3
- County
- — inherits STATE
- City
- — inherits STATE
ZIP-level market 32835
- Home prices YoY
- -31.7%
- Rents YoY
- -1.2%
- Active inventory
- 376
- Price-to-rent
- 0.1×
Monthly cashflow live
- Estimated rent
- $3,565 high interval (Pro) →
- Mortgage (P&I)
- −$3,877
- Tax est. 1.5%
- −$924 /mo · $11,090/yr
- Insurance
- −$308
- HOA
- −$0
- Vacancy / Maint / Mgmt
- −$749
- Net cashflow
- $-2,293
Break-even live
UW: 25.0% down · 7.5% · 30yr · 1.5% tax · 5.0% vac · 8.0% maint · 8.0% mgmt
Financing live
Cash to close
- Down payment
- $184,832
- Closing costs
- $22,180
- Reserves months
- —
- Total cash needed
- —
Loan-product check · same deal, 3 products live
Conventional
25% down · 7.5% · 30yr
- Down + closing
- —
- Monthly P&I
- —
- Monthly cashflow
- —
- DSCR
- —
- Eligible?
- —
Personal DTI + credit; lowest rate.
DSCR
20% down · 8.5% · 30yr
- Down + closing
- —
- Monthly P&I
- —
- Monthly cashflow
- —
- DSCR
- —
- Eligible?
- —
No personal income docs; deal must DSCR.
Hard money
10% down · 12.0% · 12mo
- Down + closing
- —
- Monthly P&I
- —
- Monthly cashflow
- —
- DSCR
- —
- Eligible?
- —
Short-term bridge; refi at stabilization.
Rent comps 7 comps
| Address | Beds | Baths | Sqft | Rent | $/sqft | DOM | Units | Dist |
|---|---|---|---|---|---|---|---|---|
| 7841 Belvoir Dr Orlando, FL | 4.0 | 3.0 | 2416 | $3,000 | $1.24 | 21d | 1 | 0.35mi |
| 7871 Canyon Lake Cir Orlando, FL | 4.0 | 2.0 | 2662 | $3,400 | $1.28 | 23d | 1 | 0.42mi |
| 7843 Saint Andrews Cir Orlando, FL | 4.0 | 2.5 | 2856 | $3,500 | $1.23 | 16d | 1 | 0.43mi |
| 7600 Debeaubien Dr Orlando, FL | 4.0 | 3.5 | 3103 | $5,000 | $1.61 | 23d | 1 | 0.49mi |
| 8131 Vineland Oaks Blvd Orlando, FL | 4.0 | 3.0 | 3900 | $4,899 | $1.26 | 16d | 1 | 0.65mi |
| 1207 Almond Tree Ct Orlando, FL | 4.0 | 2.5 | 2492 | $3,500 | $1.40 | 3d | 1 | 0.68mi |
| 2521 Roat Dr Orlando, FL | 4.0 | 3.0 | 2877 | $4,100 | $1.43 | 4d | 1 | 0.70mi |
Listing history 3 events
-
2026-06-18days on market $5,000 Active 2 DOM
-
2026-06-17remarks 286-char remark
-
2026-06-17$5,000 Active 1 DOM
ⓘ Source: listings_history table (triggers on properties + properties_extension) + one-shot
backfill from property_details.listing_events for pre-trigger history.
Climate risk First Street
- Flood 1/10 Low FEMA zone X (unshaded) · 0% chance over 30 yrs
- Wildfire 1/10 Low
- Heat 9/10 Extreme 7 d/yr ≥108°F today · 24 d/yr by 30 yrs out
- Wind 9/10 Extreme 99% chance of damaging wind over 30 yrs
- Air quality 1/10 Low 0 unhealthy d/yr today · 0 by 30 yrs out
Nearby sold comps map
Loading sold comps map…
Walkable amenities ~0.75 mi
Loading nearby amenities…
Taxation est. · year 1
- Rental income
- $42,780
- − Mortgage interest
- −$41,414
- − Property taxes
- −$11,090
- − Insurance
- −$3,697
- − Repairs & maintenance
- −$3,422
- − Management
- −$3,422
- − Depreciation
- −$21,508
- Taxable loss
- −$41,773
- Est. tax savings @ 24.0%
- +$10,025
- After-tax cash flow
- $-17,490/yr
For passive investors: Depreciation is non-cash, so a rental often shows a tax loss while cash-flowing — sheltering income. Rental losses are passive: they offset passive income freely, and up to $25,000/yr can offset ordinary (W-2) income if you actively participate and your MAGI is under $100k (phasing out to $0 by $150k); unused losses carry forward. On sale, claimed depreciation is recaptured at up to 25%, and gains may owe capital-gains tax (a 1031 exchange can defer both). Figures are a year-1 estimate at your 24.0% rate — not tax advice; consult a CPA.
Schools (NCES district)
- District
- Orange
- NCES district ID
- 1201440
- Math proficiency
- 46% ▼ -9.00%
- Reading proficiency
- 51% ▼ -2.00%
- Median HH income
- $49,350
- Composite
- 41.47/100
- National rank
- #3461
- State rank
- #43 of 73 in FL
Livability — Orlando
- Score
- 86/100
- State rank
- #12
- US rank
- #360
Category grades
Schools grade is shown separately in the Schools card above.
Census & demographics
- County
- Orange County · 1,471,359 people
- City population
- 964,969
- Metro
- Orlando-Kissimmee-Sanford, FL
- Population (ZIP)
- 49,205
- Household income
- $71,418
- Rent vs Own
- Severe rent burden
- 2914.0
Population outlook (Orange County) Hauer SSP2
- Today (2025)
- 1,618,226 people
- By 2030
- 1,787,404 · +10.5%
- By 2040
- 2,125,621 · +31.4%
- By 2050
- 2,454,016 · +51.6%
- By 2075
- 3,173,711 · +96.1%
- By 2100
- 3,607,781 · +122.9%
Race, ethnicity, and origin ACS 2023
- Neighborhood character
- Highly diverse neighborhood (Simpson 0.79)
- Race & ethnicity
- White 33% Hispanic / Latino 24% Black 19% Two or more races 19% Asian 11%
- Hispanic origin (detail)
- Mexican 1% Puerto Rican 7% Cuban 2% Dominican 1%
- Common ancestry
- Estonian 9% Hispanic 7% Russian 2%
- Foreign-born
- 38% · Canada, Vietnam, Jamaica
- Languages at home
- 51% English-only · Spanish 18% Other Indo-European 17% French/Haitian/Cajun 6%
Political lean MEDSL · Orange
- 2024 margin
- D (+13.6) · D 56.1% · R 42.5% · Other 1.3%
- 2008→2024 swing
- -5.0pp toward R · 2008: 18.6pp · 2024: 13.6pp
- All cycles
- 2024: D+13.6 2020: D+23.1 2016: D+24.6 2012: D+18.2 2008: D+18.6
Not yet ingested
- Civics
- —
Market trends
- HPI YoY
- ▼ -116.26%
- Current HPI
- 250.6804
- Rent YoY
- ▼ -1.21%
- Metro
- Orlando-Kissimmee-Sanford, FL
- State GDP YoY
- ▲ 3.28%
- F500 in state
- 36
Industry mix (Fortune 500 HQ in FL)
| Industry | F500 HQs | Revenue |
|---|---|---|
| Industrial Technology | 2 | $29B |
|
||
| Insurance | 2 | $17B |
|
||
| Retail | 1 | $60B |
|
||
| Technology Distribution | 1 | $58B |
|
||
| Homebuilding | 1 | $35B |
|
||
| Technology Manufacturing | 1 | $35B |
|
||
Price history
-99.8% since first listed4 events — show timeline
- 2026-06-16 Listed $5,000 NFMLS
- 2002-07-08 Sold (Public Records) $254,000 Public Records
- 1997-08-18 Sold (Public Records) $180,000 Public Records
- 1991-05-01 Sold (Public Records) $3,217,700 Public Records
Property tax history
+1.8%/yrLatest (2025): $4,169 · +6.0% YoY. Source: county tax records.
Cash-flow waterfall
monthlySold comps — $/sqft
last 12 mo · ≤1 miLoading sold comps…