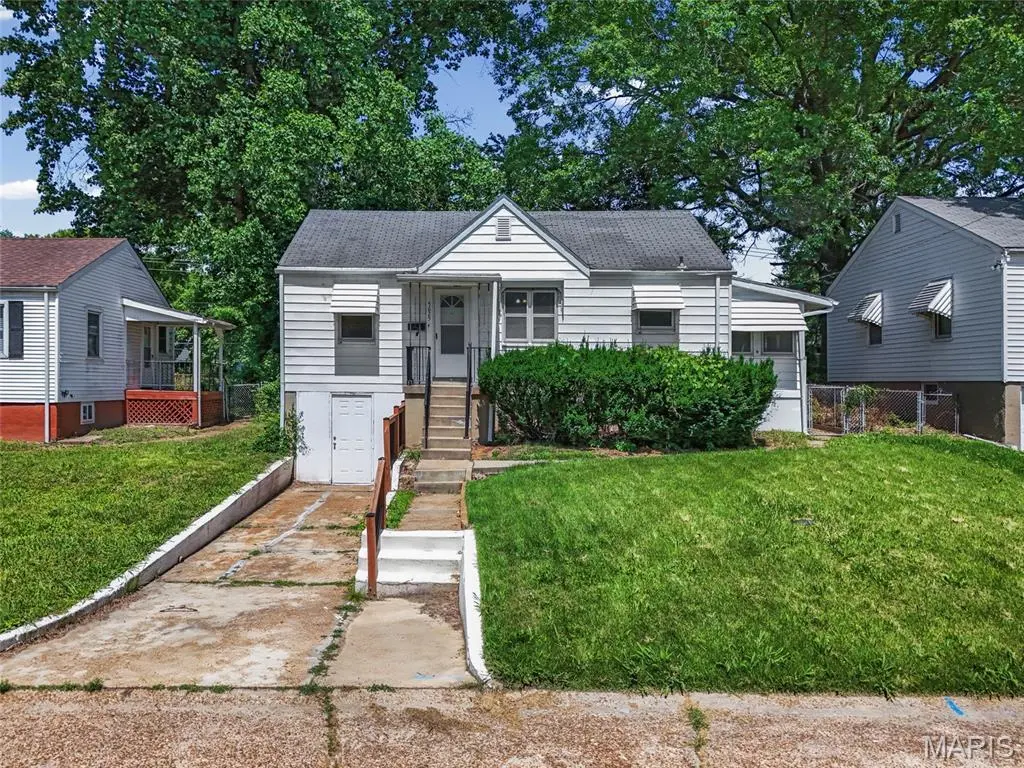
5625 Curry Ave · Country Club Hills, MO
Flood risk 1/10 · Minimal
- FEMA flood zone
- X (unshaded)
- Chance of flooding over 30 yrs
- 0.0%
- Est. flood insurance / yr
- $473 – $860
Fire risk 1/10 · Minimal
- Est. fire insurance / yr
- $1,054 – $1,958
Heat risk 5/10 · Moderate
- Hot days now (above 107°F)
- 7 days/yr
- Hot days in 30 yrs
- 21 days/yr
Wind risk 2/10 · Minimal
- Chance of severe wind over 30 yrs
- 1.0%
Air-quality risk 4/10 · Minor
- Unhealthy air days now
- 4 days/yr
- Unhealthy air days in 30 yrs
- 5 days/yr
Risk factors via First Street. Map © Google.
Why this score? — see what drove the B- grade
The composite is a weighted blend of 9 inputs, each scored 0–100. Each bar is that input's sub-score; the figure is the points it added to the 100-point composite (weight × sub-score).
- Cash flow +30.0/30.0
- DSCR +10.0/10.0
- 1% rule +8.0/10.0
- Appreciation +6.9/10.0
- Rent growth +3.7/5.0
- Livability +3.0/5.0
- Condition / age +2.5/5.0
- Schools +1.1/10.0
- ARV discount +0.0/15.0
$89,000
🖨 Deal sheet 📄 Offer letter ✓ Due diligence
Listing remarks MLS
Recently update two bedroom one bath home, this is a perfect home to add to your portfolio or starter home.
Key facts
- 5,898 sq ft lot
- Garage
- Built 1941
Property features AI
Finance
- Other: Private ownership; Home warranty included; Seller may consider concessions
Exterior
- Parking: 1-car garage
- Utilities: Public water; Public sewer; Ameren electric
- Home design: Single family residence; One level
- Construction: Frame construction with vinyl siding
- Exterior features: Deck; Rear porch; Backyard fence; City lot; Level lot
Interior
- Kitchen: Built-in gas oven; Gas range; Refrigerator
- Bedrooms: 2 bedrooms on the main level
- Flooring: Wood
- Bathrooms: 1 full bathroom on main level
- Heating & cooling: Forced air heating (natural gas); Central air conditioning (electric)
- Interior features: Built-in gas oven, gas range, refrigerator; Wood flooring; Full basement
- Laundry & utility: Natural gas connected; Electricity connected
Neighborhood map
What this means for you Summary
Snapshot
- This is a 2-bed/1.0-bath single-family listed at $89k.
Deal economics
- At list price, monthly cash flow is $332 ($4k/yr) — positive.
- The deal already cash-flows at list — no discount required.
- Meets the 1% rule at list price ($1k rent vs $89k).
Location & tenants
- Location reads 60/100 on livability (#491 in MO) — a middle-class / working-renter tenant base. Strengths: cost of living A+; Watch: health & safety C-, crime F, amenities F.
- Jennings (suburban): math 8% / reading 20% proficiency, ranked #315 of 324 in MO (top 97%) — low school quality limits family demand, transient renter base, plan for 1-2y turnover; 86% free/reduced lunch — lower-income household profile, screen leases tightly.
- Zoned schools: Woodland Elem. (math 5% / reading 15%, grade F, #1,027 of 1,115 statewide, top 93%, 256 students, 100% FRL); Jennings High (math 8% / reading 17%, grade F, #497 of 521 statewide, top 96%, 691 students, 100% FRL).
- Market conditions: Rents rising fast (+5.0%/yr); 372 active listings in the ZIP; 40 comparable units currently listed for rent nearby; rentals at typical pace (median 24d on market — plan ~3-4 weeks tenant-placement turnaround); 42% of comp listings sitting > 30 days — soft ceiling on asking rent; lower-income renter base — watch delinquency; 920 units permitted in St. Louis County in 2024 (250 in 5+ unit buildings).
- This rent runs 34% of the median local income ($41k/yr) — at the standard rent-burdened threshold; future hikes will face affordability resistance.
Forward outlook
- In year one you build about $4k of equity ($615 loan paydown + $3k appreciation (3.8% local appreciation)).
- At projected returns (3.8% appreciation + 5.0% rent growth), your $25k cash investment doubles in ~3 years — after that, you're playing with house money.
- By year 9, paydown + projected appreciation supports a ~$34k cash-out refi (75% LTV) — recoverable capital for the next deal without selling this one.
Negotiation context
- Only 6 days on market — expect competitive offers; lowballing is unlikely to land.
- 2 sale attempts since 2y ago; this cycle's ask is 19% above the opening price — seller raised mid-cycle; expect resistance to lowballs.
- Current owner paid $32k; list at $89k implies a 183% gain — meaningful room to come down on a strong offer.
Risks & watch-outs
- Watch-outs: built in 1941 — expect roof / HVAC / electrical / plumbing capex.
- Climate carrying-cost: extreme-heat days projected 7→21/yr by 2055 (HVAC capex compounding) — expect insurance premiums to compound above CPI over the hold.
Questions for the listing agent
- Built in 1941 — when were the roof, HVAC, electrical panel, plumbing, and water heater last replaced?
- Is there a deadline driving the sale (1031 exchange, divorce, estate, relocation)? That informs how much negotiation room exists.
- Crime grade is F in this area — have there been break-ins, vandalism, or insurance claims at this property in the last 3 years? What carrier currently insures it and at what premium?
- What's the average days-on-market for RENTAL listings here right now (not sales)? A rising rental-DOM trend means longer vacancies and softer asking-rent achievability than the comps imply.
- What's the recent tenant-quality profile in this submarket — average credit score on applications, eviction rate, late-payment / NSF rate, and stable-employment percentage? A property-management company in the area should have these aggregated.
- How much new for-sale + rental construction is in the pipeline within 1–3 miles? Heavy new supply typically softens prices + rents 12–24 months out; constrained supply supports both.
Investment metrics
- 1% rule
- 1.30% ✓
- Cap rate
- 10.76%
- Cash-on-cash
- 15.97%
- DSCR
- 1.71
- GRM
- 6.4
CMA / ARV
- ARV (on-the-fly)
- $68,112
- Comps found
- 12
Show comp detail 12 sales within ~0.75 mi
| Address | Dist | Beds/Ba | Sqft | Sold | Price | $/sf | Match |
|---|---|---|---|---|---|---|---|
| 7439 Embury Ct | 0.23mi | 2/1.0 | 792 (0%) | 2mo | $69,000 | $87 | 88 |
| 7431 Esterbrook Dr | 0.29mi | 3/1.0 (+1) | 792 (0%) | 2mo | $110,000 | $139 | 80 |
| 5636 Sunbury Ave | 0.09mi | 2/1.0 | 870 (+10%) | 3mo | $74,900 | $86 | 77 |
| 2604 Avie Dr | 0.42mi | 2/1.0 | 825 (+4%) | 3mo | $99,900 | $121 | 71 |
| 8339 Eton Pl | 0.50mi | 2/1.0 | 750 (-5%) | 3mo | $22,500 | $30 | 66 |
| 7443 Embury Ct | 0.21mi | 3/1.0 (+1) | 874 (+10%) | 6mo | $59,999 | $69 | 63 |
| 5544 Sapphire Ave | 0.25mi | 3/1.0 (+1) | 888 (+12%) | 3mo | $115,000 | $130 | 61 |
| 8320 Lucas And Hunt Rd | 0.36mi | 2/2.0 | 720 (-9%) | 5mo | $60,000 | $83 | 60 |
| 2509 Shirley Ave | 0.64mi | 2/1.0 | 884 (+12%) | 4mo | $59,900 | $68 | 47 |
| 2425 Shirley Ave | 0.67mi | 2/1.0 | 896 (+13%) | 2mo | $34,900 | $39 | 45 |
| 7053 Idlewild Ave | 0.67mi | 2/1.0 | 900 (+14%) | 5mo | $116,800 | $130 | 42 |
| 5617 Janet Ave | 0.74mi | 3/1.0 (+1) | 909 (+15%) | 4mo | $39,900 | $44 | 32 |
Match score weights: distance 35% · size 25% · config 20% · recency 20%. Top-matched comps best support the ARV.
Projected returns pro-forma
3.79% appreciation · 4.97% rent growth · sell at horizon
- IRR
- 25.4%
- Equity multiple
- 2.52×
- Total profit
- $37,948
- Equity at exit
- $44,036
- IRR
- 26.5%
- Equity multiple
- 5.20×
- Total profit
- $104,680
- Equity at exit
- $71,170
Cash invested: $24,920 (down + closing). Projections, not guarantees.
Landlord ↔ Tenant lean methodology
- Overall (STATE)
- 81 Strongly Landlord-Friendly
- State Missouri
- 81 Strongly Landlord-Friendly · R+10
- County
- — inherits STATE
- City
- — inherits STATE
ZIP-level market 63136
- Home prices YoY
- 0.9%
- Rents YoY
- 5.0%
- Active inventory
- 372
- Price-to-rent
- 6.4×
Monthly cashflow live
- Estimated rent
- $1,155 high interval (Pro) →
- Mortgage (P&I)
- −$467
- Tax from tax record
- −$77 /mo · $925/yr
- Insurance
- −$37
- HOA
- −$0
- Vacancy / Maint / Mgmt
- −$243
- Net cashflow
- $332
Break-even live
UW: 25.0% down · 7.5% · 30yr · 1.5% tax · 5.0% vac · 8.0% maint · 8.0% mgmt
Financing live
Cash to close
- Down payment
- $22,250
- Closing costs
- $2,670
- Reserves months
- —
- Total cash needed
- —
Loan-product check · same deal, 3 products live
Conventional
25% down · 7.5% · 30yr
- Down + closing
- —
- Monthly P&I
- —
- Monthly cashflow
- —
- DSCR
- —
- Eligible?
- —
Personal DTI + credit; lowest rate.
DSCR
20% down · 8.5% · 30yr
- Down + closing
- —
- Monthly P&I
- —
- Monthly cashflow
- —
- DSCR
- —
- Eligible?
- —
No personal income docs; deal must DSCR.
Hard money
10% down · 12.0% · 12mo
- Down + closing
- —
- Monthly P&I
- —
- Monthly cashflow
- —
- DSCR
- —
- Eligible?
- —
Short-term bridge; refi at stabilization.
Rent comps 40 comps
| Address | Beds | Baths | Sqft | Rent | $/sqft | DOM | Units | Dist |
|---|---|---|---|---|---|---|---|---|
| 5613 Statler Ave Saint Louis, MO | 2.0 | 1.0 | 864 | $1,300 | $1.50 | 4d | 1 | 0.05mi |
| 5636 Statler Ave Saint Louis, MO | 1.0 | 1.0 | 777 | $1,200 | $1.54 | 23d | 1 | 0.06mi |
| 7426 Calvin Ave Saint Louis, MO | 2.0 | 1.0 | 1100 | $1,125 | $1.02 | 17d | 1 | 0.12mi |
| 7414 Pleaseway Dr Saint Louis, MO | 2.0 | 1.0 | 768 | $1,100 | $1.43 | 43d | 1 | 0.13mi |
| 5600 Gatesworth Ave Saint Louis, MO | 2.0 | 1.0 | 672 | $1,095 | $1.63 | 4d | 1 | 0.14mi |
| 7420 Pleaseway Dr Saint Louis, MO | 2.0 | 1.0 | 952 | $1,250 | $1.31 | 21d | 1 | 0.14mi |
| 7441 Calvin Ave Saint Louis, MO | 3.0 | 1.0 | 1068 | $1,350 | $1.26 | 12d | 1 | 0.16mi |
| 5640 Sapphire Ave Saint Louis, MO | 2.0 | 1.0 | 900 | $1,100 | $1.22 | 43d | 1 | 0.19mi |
| 7516 Chandler Ave Saint Louis, MO | 1.0 | 1.0 | 728 | $1,000 | $1.37 | 43d | 1 | 0.24mi |
| 7315 Albright Ave Saint Louis, MO | 3.0 | 1.0 | 888 | $1,150 | $1.30 | 43d | 1 | 0.25mi |
| 7431 Esterbrook Dr Saint Louis, MO | 2.0 | 1.0 | 792 | $1,350 | $1.70 | 43d | 1 | 0.28mi |
| 7304 Albright Ave Saint Louis, MO | 2.0 | 1.0 | 800 | $1,100 | $1.38 | 43d | 1 | 0.28mi |
| 7218 Albright Ave Saint Louis, MO | 2.0 | 1.0 | 1100 | $980 | $0.89 | 23d | 1 | 0.33mi |
| 7205 Calvin Ave Saint Louis, MO | 3.0 | 1.0 | 832 | $750 | $0.90 | 43d | 1 | 0.37mi |
| 5615 Beldon Dr Saint Louis, MO | 2.0 | 1.0 | 850 | $950 | $1.12 | 43d | 1 | 0.38mi |
| 7142 Lamont Dr Saint Louis, MO | 2.0 | 1.0 | 750 | $1,100 | $1.47 | 17d | 1 | 0.45mi |
| 5516 Fairridge Ct Saint Louis, MO | 2.0 | 1.0 | 1110 | $995 | $0.90 | 23d | 1 | 0.46mi |
| 2623 Avie Dr Saint Louis, MO | 3.0 | 2.0 | 921 | $1,350 | $1.47 | 43d | 1 | 0.47mi |
| 8347 Eton Pl Saint Louis, MO | 2.0 | 1.0 | 750 | $1,075 | $1.43 | 43d | 1 | 0.51mi |
| 8344 Eton Pl Saint Louis, MO | 2.0 | 1.0 | 750 | $895 | $1.19 | 4d | 1 | 0.53mi |
| 2527 Switzer Ave Saint Louis, MO | 3.0 | 1.0 | 888 | $1,135 | $1.28 | 16d | 1 | 0.57mi |
| 2427 Switzer Ave Saint Louis, MO | 3.0 | 1.0 | 1008 | $1,300 | $1.29 | 43d | 1 | 0.63mi |
| 7030 Emma Ave Saint Louis, MO | 2.0 | 1.0 | 801 | $1,350 | $1.69 | 43d | 1 | 0.65mi |
| 5637 Jennings Station Rd Saint Louis, MO | 3.0 | 1.0 | 1116 | $895 | $0.80 | 43d | 1 | 0.66mi |
| 2415 Shirley Ave Saint Louis, MO | 3.0 | 1.0 | 990 | $1,450 | $1.46 | 23d | 1 | 0.70mi |
| 7131 Garesche Ave Saint Louis, MO | 2.0 | 1.0 | 918 | $1,090 | $1.19 | 4d | 1 | 0.70mi |
| 2617 Hord Ave Saint Louis, MO | 2.0 | 1.0 | 800 | $775 | $0.97 | 4d | 1 | 0.72mi |
| 7024 Idlewild Ave Saint Louis, MO | 2.0 | 1.0 | 588 | $995 | $1.69 | 43d | 1 | 0.76mi |
| 5225 Fletcher St Saint Louis, MO | 3.0 | 2.0 | 918 | $1,295 | $1.41 | 23d | 1 | 0.76mi |
| 7036 Garesche Ave Saint Louis, MO | 2.0 | 1.0 | 864 | $950 | $1.10 | 17d | 1 | 0.79mi |
| 8720 Akins Dr Saint Louis, MO | 2.0 | 1.0 | 1012 | $1,150 | $1.14 | 23d | 1 | 0.80mi |
| 8908 Scottdale Ave Jennings, MO | 2.0 | 1.0 | 790 | $1,000 | $1.27 | 43d | 1 | 0.84mi |
| 7160 Beulah Ave Saint Louis, MO | 2.0 | 1.0 | 784 | $1,059 | $1.35 | 43d | 1 | 0.85mi |
| 5635 Hodiamont Ave Saint Louis, MO | 2.0 | 1.0 | 580 | $899 | $1.55 | 20d | 1 | 0.86mi |
| 3 Pohlman Ln Saint Louis, MO | 2.0 | 1.0 | 704 | $1,000 | $1.42 | 16d | 1 | 0.90mi |
| 8502 Dianthus Ln Saint Louis, MO | 2.0 | 1.0 | 1072 | $1,175 | $1.10 | 23d | 1 | 0.93mi |
| 8527 Dianthus Ln Saint Louis, MO | 3.0 | 1.0 | 976 | $1,295 | $1.33 | 43d | 1 | 0.93mi |
| 5439 Hodiamont Ave Saint Louis, MO | 2.0 | 1.0 | 770 | $950 | $1.23 | 17d | 1 | 0.95mi |
| 5662 Wilborn Dr Saint Louis, MO | 1.0 | 1.0 | 768 | $850 | $1.11 | 23d | 1 | 1.01mi |
| 8817 Shady Grove Ave Saint Louis, MO | 2.0 | 1.0 | 1085 | $1,075 | $0.99 | 23d | 1 | 1.02mi |
Listing history 9 events
-
2026-06-18days on market $89,000 Active 6 DOM
-
2026-06-17days on market $89,000 Active 5 DOM
-
2026-06-16days on market $89,000 Active 4 DOM
-
2026-06-15days on market $89,000 Active 3 DOM
-
2026-06-13statusdays on market $89,000 Active 1 DOM
-
2026-06-09days on market $89,000 Coming Soon 4 DOM
-
2026-06-08days on market $89,000 Coming Soon 3 DOM
-
2026-06-07remarks 699-char remark
-
2026-06-07$89,000 Coming Soon 2 DOM
ⓘ Source: listings_history table (triggers on properties + properties_extension) + one-shot
backfill from property_details.listing_events for pre-trigger history.
Tax reassessment forecast MO · Resets to sale price
- Current annual tax
- $925 · $77/mo
- Projected year-2 tax
- $925 · $77/mo
- Expected delta
- $0/yr ($0/mo · 0.0%)
ⓘ Screening estimate from a state-policy table — verify with the county assessor before closing.
Climate risk First Street
- Flood 1/10 Low FEMA zone X (unshaded) · 0% chance over 30 yrs
- Wildfire 1/10 Low
- Heat 5/10 Major 7 d/yr ≥107°F today · 21 d/yr by 30 yrs out
- Wind 2/10 Low 100% chance of damaging wind over 30 yrs
- Air quality 4/10 Moderate 4 unhealthy d/yr today · 5 by 30 yrs out
Nearby sold comps map
Loading sold comps map…
Walkable amenities ~0.75 mi
Loading nearby amenities…
Taxation est. · year 1
- Rental income
- $13,860
- − Mortgage interest
- −$4,985
- − Property taxes
- −$925
- − Insurance
- −$445
- − Repairs & maintenance
- −$1,109
- − Management
- −$1,109
- − Depreciation
- −$2,589
- Taxable income
- $2,698
- Est. tax owed @ 24.0%
- −$648
- After-tax cash flow
- $3,331/yr
For passive investors: Depreciation is non-cash, so a rental often shows a tax loss while cash-flowing — sheltering income. Rental losses are passive: they offset passive income freely, and up to $25,000/yr can offset ordinary (W-2) income if you actively participate and your MAGI is under $100k (phasing out to $0 by $150k); unused losses carry forward. On sale, claimed depreciation is recaptured at up to 25%, and gains may owe capital-gains tax (a 1031 exchange can defer both). Figures are a year-1 estimate at your 24.0% rate — not tax advice; consult a CPA.
Schools (NCES district)
- District
- Jennings
- NCES district ID
- 2916290
- Math proficiency
- 8% ▼ -16.00%
- Reading proficiency
- 20% ▼ -4.00%
- Median HH income
- $30,595
- Composite
- 11.04/100
- National rank
- #9739
- State rank
- #315 of 324 in MO
Livability — Country Club Hills
- Score
- 60/100
- State rank
- #491
- US rank
- #19080
Category grades
Schools grade is shown separately in the Schools card above.
Census & demographics
- Census place
- Country Club Hills, MO
- County
- Saint Louis County · 888,823 people
- Metro
- St. Louis, MO-IL
- Population (ZIP)
- 40,929
- Household income
- $41,154
- Rent vs Own
- Severe rent burden
- 3085.0
Population outlook (St. Louis County) Hauer SSP2
- Today (2025)
- 1,025,227 people
- By 2030
- 1,028,023 · +0.3%
- By 2040
- 1,020,940 · -0.4%
- By 2050
- 1,007,280 · -1.8%
- By 2075
- 987,277 · -3.7%
- By 2100
- 921,984 · -10.1%
Race, ethnicity, and origin ACS 2023
- Neighborhood character
- Predominantly Black (90%)
- Race & ethnicity
- Black 90% White 5% Two or more races 3%
- Foreign-born
- 1% · Canada
Political lean MEDSL · St. Louis
- 2024 margin
- Strong D (+23.4) · D 60.8% · R 37.4% · Other 1.7%
- 2008→2024 swing
- +3.5pp toward D · 2008: 19.9pp · 2024: 23.4pp
- All cycles
- 2024: D+23.4 2020: D+24.0 2016: D+16.2 2012: D+13.7 2008: D+19.9
Not yet ingested
- Civics
- —
Market trends
- HPI YoY
- ▲ 3.79%
- Current HPI
- 420.28
- Rent YoY
- ▲ 4.97%
- Metro
- St. Louis, MO-IL
- State GDP YoY
- ▲ 1.84%
- F500 in state
- 20
Industry mix (Fortune 500 HQ in MO)
| Industry | F500 HQs | Revenue |
|---|---|---|
| Healthcare | 1 | $163B |
|
||
| Insurance | 1 | $21B |
|
||
| Industrial Technology | 1 | $17B |
|
||
| Retail | 1 | $16B |
|
||
| Industrial Distribution | 1 | $10B |
|
||
| Utilities | 1 | $9B |
|
||
Price history
+134.2% since first listed15 events — show timeline
- 2026-06-05 Coming Soon $89,000 MARIS as Distributed by MLS Grid
- 2024-12-16 Pending — MARIS as Distributed by MLS Grid
- 2024-12-13 Sold (MLS) — MARIS as Distributed by MLS Grid
- 2024-11-24 Contingent — MARIS as Distributed by MLS Grid
- 2024-11-21 Relisted — MARIS as Distributed by MLS Grid
- 2024-11-04 Contingent — MARIS as Distributed by MLS Grid
- 2024-10-23 Listed $75,000 MARIS as Distributed by MLS Grid
- 2012-04-17 Sold (Public Records) $31,500 Public Records
- 2010-04-19 Sold (Public Records) $31,500 Public Records
- 2007-10-29 Sold (Public Records) $34,900 Public Records
- 2007-10-16 Sold (Public Records) $24,900 Public Records
- 2006-04-07 Sold (Public Records) $75,000 Public Records
- 2004-10-07 Sold (Public Records) $73,000 Public Records
- 1993-03-02 Sold (Public Records) $38,000 Public Records
- 1992-10-12 Sold (Public Records) — Public Records
Property tax history
+0.3%/yrLatest (2022): $925 · +1.3% YoY. Source: county tax records.
Cash-flow waterfall
monthlySold comps — $/sqft
last 12 mo · ≤1 miLoading sold comps…