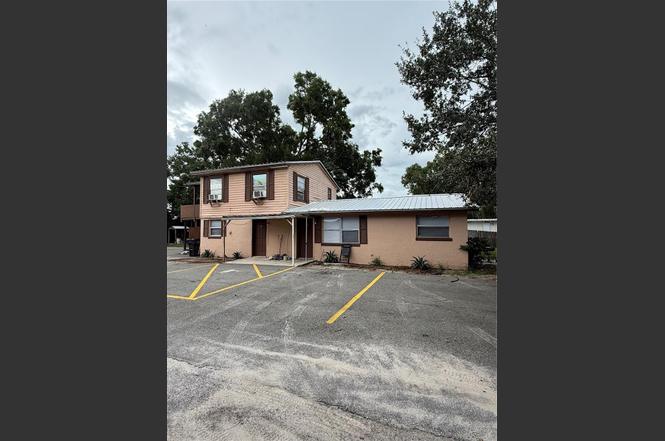
 Triplex
4570 Transport Rd · Eagle Lake, FL
Flood risk 1/10 · Minimal
- FEMA flood zone
- X (unshaded)
- Chance of flooding over 30 yrs
- 0.0%
- Est. flood insurance / yr
- $507 – $1,088
Fire risk 5/10 · Moderate
- Est. fire insurance / yr
- $947 – $1,759
Heat risk 8/10 · Major
- Hot days now (above 107°F)
- 7 days/yr
- Hot days in 30 yrs
- 23 days/yr
Wind risk 10/10 · Severe
- Chance of severe wind over 30 yrs
- 99.0%
Air-quality risk 2/10 · Minimal
- Unhealthy air days now
- 2 days/yr
- Unhealthy air days in 30 yrs
- 2 days/yr
Risk factors via First Street. Map © Google.
Why this score? — see what drove the B- grade
The composite is a weighted blend of 9 inputs, each scored 0–100. Each bar is that input's sub-score; the figure is the points it added to the 100-point composite (weight × sub-score).
- Cash flow +30.0/30.0
- DSCR +10.0/10.0
- 1% rule +8.9/10.0
- ARV discount +7.5/15.0
- Livability +3.9/5.0
- Schools +3.5/10.0
- Rent growth +3.2/5.0
- Condition / age +2.5/5.0
- Appreciation +0.0/10.0
$349,999
🖨 Deal sheet 📄 Offer letter ✓ Due diligence
Multi-family units
County records classify this as Multi-Family (2-4 Unit). Listing-text estimate: 3 units. confirmed
Listing remarks MLS
Great deal on triplex in Bartow. Mostly block construction. Cash offers only please due to condition. All sizes are approximate. Buyer to verify all. Days 1-7: Offers will not be reviewed. Days 8-12: Offers only from NSP buyers, municipalities, non-profit organizations, and owner occupants will be reviewed. Days 13+: Seller will consider offers from all buyers.
Key facts
- Metal roof
- High demand location
- Triplex
Tags
Property features AI
Finance
- Financial info: Gross income reported: $40,740; Annual net income reported: $32,592; Total monthly expenses reported: $679; Tenant pays electricity, sewer and trash collection; Pro forma rents listed: one 1-bedroom at $1,100; two 2-bedrooms at $1,200 each
- HOA & community: No association
Exterior
- Utilities: Well water; Septic tank; Electricity connected; Water connected; Private utilities and other utility arrangements
- Home design: Residential income property (Triplex); One building; Zoned R-3; Lot about 0.35 acre (approx. 152 x 100); Asphalt/paved road access
- Construction: Block construction; Stucco exterior; Metal roof; Block foundation
- Exterior features: Balcony
Interior
- Bedrooms: 5 bedrooms
- Bathrooms: Multiple bathrooms (total unit bathrooms: 1 per listed unit type)
- Heating & cooling: Central heating; Ductless heating; Central air conditioning; Wall/window air conditioning units
- Interior features: Other interior features
- Laundry & utility: Inside laundry; Other laundry features
Neighborhood map
What this means for you Summary
Snapshot
- This is a 3 × 3-bed/1.5-bath units multifamily listed at $350k.
Deal economics
- At list price, monthly cash flow is $2k ($18k/yr) — positive. Per door: $510/mo.
- The deal already cash-flows at list — no discount required.
- Meets the 1% rule at list price ($5k rent vs $350k).
- Recommended offer: $308k (12.0% below list) — sets the bar for market timing.
Location & tenants
- Location reads 77/100 on livability (#196 in FL, #3,096 nationally) — a middle-class / working-renter tenant base. Strengths: crime A+, cost of living A+, housing A+; Watch: schools D+, amenities F, commute F.
- Polk (suburban): math 39% / reading 43% proficiency, ranked #62 of 73 in FL (top 85%) — families likely to look elsewhere, expect single-tenant / working-renter base with shorter leases.
- Market conditions: Rents rising (+2.7%/yr); 386 active listings in the ZIP; 19 comparable units currently listed for rent nearby; rentals at typical pace (median 14d on market — plan ~3-4 weeks tenant-placement turnaround); 10,384 units permitted in Polk County in 2024 (1,716 in 5+ unit buildings).
- At $4,866/mo this rent would consume 91% of the median local household income ($64k/yr) (locally 681% of renters already pay >50% of income on rent) — very limited rent-growth headroom before tenants either downsize or default.
Forward outlook
- Local home prices are declining (-3.0%/yr); year-one equity from $2k of loan paydown is wiped out by about $10k of value loss. Plan a longer hold.
- Polk County population projected at +33% by 2050 — long-run rental-demand tailwind backs the buy-and-hold thesis.
- At projected returns (-3.0% appreciation + 2.7% rent growth), your $98k cash investment doubles in ~7 years — after that, you're playing with house money.
Negotiation context
- It's been on market 310 days — a 12% lower offer ($308k) is reasonable based on typical stale-listing flexibility.
- 12 sale attempts since 21y ago with the ask held roughly flat each time — persistent listings suggest the price (not the market) is what's stuck; bring a comps-based counter.
- Current owner paid $22k; list at $350k implies a 1491% gain — meaningful room to come down on a strong offer.
Risks & watch-outs
- Climate carrying-cost: severe wind risk, 99% chance of damaging wind over 30y; moderate wildfire risk; extreme-heat days projected 7→23/yr by 2055 (HVAC capex compounding) — expect insurance premiums to compound above CPI over the hold.
Questions for the listing agent
- It's been on market 310 days. Have you received any prior offers? Is the seller open to a 12% concession, seller financing, or rate buy-down credit?
- Can we see the unit-by-unit rent roll, current vacancy, and any below-market leases? What's the average tenancy length?
- What capital expenditures (roof, boiler, parking lot, exteriors) have been made in the last 5 years, and what's planned in the next 2?
- Built in 1962 — when were the roof, HVAC, electrical panel, plumbing, and water heater last replaced?
- Why hasn't it sold? Are there any deal-killer items the seller is aware of (foundation, flood, title, zoning, code violations)?
- Is there a deadline driving the sale (1031 exchange, divorce, estate, relocation)? That informs how much negotiation room exists.
- Schools are D-rated, which usually means shorter tenancies and higher turnover. Who's the typical renter profile here, and what's been the actual vacancy rate?
- What's the average days-on-market for RENTAL listings here right now (not sales)? A rising rental-DOM trend means longer vacancies and softer asking-rent achievability than the comps imply.
- What's the recent tenant-quality profile in this submarket — average credit score on applications, eviction rate, late-payment / NSF rate, and stable-employment percentage? A property-management company in the area should have these aggregated.
- How much new apartment / multifamily construction is in the pipeline within 1–3 miles? Heavy new supply (>2% of stock underway) typically softens rents 12–24 months out; light construction supports rent growth.
Investment metrics
- 1% rule
- 1.39% ✓
- Cap rate
- 11.54%
- Cash-on-cash
- 18.75%
- DSCR
- 1.83
- GRM
- 6.0
CMA / ARV
No comps found within radius.
Projected returns pro-forma
-3.0% appreciation · 2.72% rent growth · sell at horizon
- IRR
- 10.2%
- Equity multiple
- 1.40×
- Total profit
- $39,464
- Equity at exit
- $52,186
- IRR
- 19.1%
- Equity multiple
- 2.58×
- Total profit
- $154,416
- Equity at exit
- $30,262
Cash invested: $98,000 (down + closing). Projections, not guarantees.
Landlord ↔ Tenant lean methodology
- Overall (STATE)
- 87 Strongly Landlord-Friendly
- State Florida
- 87 Strongly Landlord-Friendly · R+3
- County
- — inherits STATE
- City
- — inherits STATE
ZIP-level market 33830
- Home prices YoY
- -19.8%
- Rents YoY
- 2.7%
- Active inventory
- 386
- Price-to-rent
- 18.0×
Monthly cashflow live
- Estimated rent
- $4,866 medium interval (Pro) →
- Mortgage (P&I)
- −$1,835
- Tax from tax record
- −$331 /mo · $3,977/yr
- Insurance
- −$146
- HOA
- −$0
- Vacancy / Maint / Mgmt
- −$1,022
- Net cashflow
- $1,531
Break-even live
3-unit breakdown (identical units grouped — click to expand)
| Units | Beds | Baths | Est. rent |
|---|---|---|---|
| 3× units | 3 | 1.5 | $4,866 |
| #1 | 3 | 1.5 | $1,622 |
| #2 | 3 | 1.5 | $1,622 |
| #3 | 3 | 1.5 | $1,622 |
| Total (3 units) | $4,866 | ||
UW: 25.0% down · 7.5% · 30yr · 1.5% tax · 5.0% vac · 8.0% maint · 8.0% mgmt
Financing live
Cash to close
- Down payment
- $87,500
- Closing costs
- $10,500
- Reserves months
- —
- Total cash needed
- —
Loan-product check · same deal, 3 products live
Conventional
25% down · 7.5% · 30yr
- Down + closing
- —
- Monthly P&I
- —
- Monthly cashflow
- —
- DSCR
- —
- Eligible?
- —
Personal DTI + credit; lowest rate.
DSCR
20% down · 8.5% · 30yr
- Down + closing
- —
- Monthly P&I
- —
- Monthly cashflow
- —
- DSCR
- —
- Eligible?
- —
No personal income docs; deal must DSCR.
Hard money
10% down · 12.0% · 12mo
- Down + closing
- —
- Monthly P&I
- —
- Monthly cashflow
- —
- DSCR
- —
- Eligible?
- —
Short-term bridge; refi at stabilization.
Rent comps 19 comps
| Address | Beds | Baths | Sqft | Rent | $/sqft | DOM | Units | Dist |
|---|---|---|---|---|---|---|---|---|
| 303 Corbel Ln Bartow, FL | 3.0 | 2.0 | 1350 | $1,731 | $1.28 | 3d | 1 | 0.21mi |
| 328 Corbel Ln Eagle Lake, FL | 3.0 | 2.0 | 1589 | $1,676 | $1.05 | 21d | 1 | 0.26mi |
| 519 Patton Loop Bartow, FL | 3.0 | 2.0 | 1560 | $1,998 | $1.28 | 3d | 1 | 0.28mi |
| 418 Reina Way Bartow, FL | 3.0 | 2.0 | 1350 | $1,666 | $1.23 | 21d | 1 | 0.30mi |
| 588 Crown Rose Dr Bartow, FL | 3.0 | 2.0 | 1350 | $1,646 | $1.22 | 14d | 1 | 0.39mi |
| 257 Spirit Landings Cir Winter Haven, FL | 3.0 | 2.0 | 1690 | $2,250 | $1.33 | 23d | 1 | 0.89mi |
| 5320 Laurel Oak Dr Winter Haven, FL | 3.0 | 2.0 | 1508 | $1,650 | $1.09 | 23d | 1 | 0.97mi |
| 449 Kensington View Dr Winter Haven, FL | 3.0 | 2.0 | 1541 | $1,889 | $1.23 | 3d | 1 | 1.18mi |
| 1033 Holden Way Winter Haven, FL | 3.0 | 2.0 | 1560 | $1,950 | $1.25 | 14d | 1 | 1.19mi |
| 509 Kensington View Dr Winter Haven, FL | 3.0 | 2.0 | 1604 | $1,809 | $1.13 | 3d | 1 | 1.23mi |
| 948 Craftsman Rd Eagle Lake, FL | 3.0 | 2.0 | 1550 | $1,895 | $1.22 | 3d | 1 | 1.24mi |
| 4189 Radford Rd Bartow, FL | 3.0 | 2.5 | 1486 | $1,800 | $1.21 | 3d | 1 | 1.25mi |
| 233 Kensington View Blvd Winter Haven, FL | 3.0 | 2.0 | 1491 | $1,975 | $1.32 | 23d | 1 | 1.26mi |
| 304 Kensington View Dr Winter Haven, FL | 3.0 | 2.0 | 1678 | $1,889 | $1.13 | 3d | 1 | 1.30mi |
| 2831 Pioneer Trl Eloise, FL | 3.0 | 2.0 | 1843 | $2,300 | $1.25 | 10d | 1 | 1.39mi |
| 2831 Pioneer Trl Eloise, FL | 3.0 | 2.0 | 1843 | $2,300 | $1.25 | 3d | 1 | 1.39mi |
| 1469 Deepwater Cir Eagle Lake, FL | 3.0 | 2.0 | 1461 | $2,000 | $1.37 | 23d | 1 | 1.42mi |
| 2782 Pioneer Trl Eagle Lake, FL | 3.0 | 2.0 | 1486 | $1,940 | $1.31 | 23d | 1 | 1.44mi |
| 108 Brad Cir Winter Haven, FL | 3.0 | 2.0 | 1325 | $1,720 | $1.30 | 23d | 1 | 1.48mi |
Listing history 40 events
-
2026-06-18days on market $349,999 Active 310 DOM
-
2026-06-17days on market $349,999 Active 309 DOM
-
2026-06-16days on market $349,999 Active 308 DOM
-
2026-06-15days on market $349,999 Active 307 DOM
-
2026-06-13days on market $349,999 Active 305 DOM
-
2026-06-10days on market $349,999 Active 302 DOM
-
2026-06-09days on market $349,999 Active 301 DOM
-
2026-06-08days on market $349,999 Active 300 DOM
-
2026-06-07days on market $349,999 Active 299 DOM
-
2026-06-05days on market $349,999 Active 296 DOM
-
2026-06-03days on market $349,999 Active 294 DOM
-
2026-06-01days on market $349,999 Active 293 DOM
-
2026-05-31days on market $349,999 Active 292 DOM
-
2025-08-12$349,999 Active
-
2025-06-26historical $1,050
-
2025-06-04$1,050
-
2025-04-17historical $1,195
-
2025-04-02$1,195
-
2024-11-16historical $995
-
2024-09-14price $995
-
2024-08-22$1,050
-
2023-07-26historical $1,095
-
2023-07-12$1,095
-
2015-01-03historical
-
2014-06-14status Active
-
2014-06-10historical
-
2014-04-07status Active
-
2014-03-29historical
-
2014-01-03$66,900 Active
-
2010-11-11soldstatus $22,000 363-char remark
Show marketing remark (363 chars)
Great deal on triplex in Bartow. Mostly block construction. Cash offers only please due to condition. All sizes are approximate. Buyer to verify all. Days 1-7: Offers will not be reviewed. Days 8-12: Offers only from NSP buyers, municipalities, non-profit organizations, and owner occupants will be reviewed. Days 13+: Seller will consider offers from all buyers.
-
2010-09-07$27,000 363-char remark
Show marketing remark (363 chars)
Great deal on triplex in Bartow. Mostly block construction. Cash offers only please due to condition. All sizes are approximate. Buyer to verify all. Days 1-7: Offers will not be reviewed. Days 8-12: Offers only from NSP buyers, municipalities, non-profit organizations, and owner occupants will be reviewed. Days 13+: Seller will consider offers from all buyers.
-
2010-04-07historical
-
2008-04-01$65,000
-
2007-02-15$195,000
-
2006-01-17soldstatus $122,000
-
2006-01-09soldstatus $122,000
-
2005-09-14$129,000
-
2005-04-05soldstatus $77,400
-
1998-05-01soldstatus $11,000
-
1998-05-01soldstatus $11,000
ⓘ Source: listings_history table (triggers on properties + properties_extension) + one-shot
backfill from property_details.listing_events for pre-trigger history.
Tax reassessment forecast FL · Resets to sale price
- Current annual tax
- $3,977 · $331/mo
- Projected year-2 tax
- $3,977 · $331/mo
- Expected delta
- $0/yr ($0/mo · 0.0%)
ⓘ Screening estimate from a state-policy table — verify with the county assessor before closing.
Climate risk First Street
- Flood 1/10 Low FEMA zone X (unshaded) · 0% chance over 30 yrs
- Wildfire 5/10 Major
- Heat 8/10 Severe 7 d/yr ≥107°F today · 23 d/yr by 30 yrs out
- Wind 10/10 Extreme 99% chance of damaging wind over 30 yrs
- Air quality 2/10 Low 2 unhealthy d/yr today · 2 by 30 yrs out
Nearby sold comps map
Loading sold comps map…
Walkable amenities ~0.75 mi
Loading nearby amenities…
Taxation est. · year 1
- Rental income
- $58,392
- − Mortgage interest
- −$19,605
- − Property taxes
- −$3,977
- − Insurance
- −$1,750
- − Repairs & maintenance
- −$4,671
- − Management
- −$4,671
- − Depreciation
- −$10,182
- Taxable income
- $13,535
- Est. tax owed @ 24.0%
- −$3,248
- After-tax cash flow
- $15,129/yr
For passive investors: Depreciation is non-cash, so a rental often shows a tax loss while cash-flowing — sheltering income. Rental losses are passive: they offset passive income freely, and up to $25,000/yr can offset ordinary (W-2) income if you actively participate and your MAGI is under $100k (phasing out to $0 by $150k); unused losses carry forward. On sale, claimed depreciation is recaptured at up to 25%, and gains may owe capital-gains tax (a 1031 exchange can defer both). Figures are a year-1 estimate at your 24.0% rate — not tax advice; consult a CPA.
Schools (NCES district)
- District
- Polk
- NCES district ID
- 1201590
- Math proficiency
- 39% ▼ -11.00%
- Reading proficiency
- 43% ▼ -4.00%
- Median HH income
- $43,979
- Composite
- 34.74/100
- National rank
- #5132
- State rank
- #62 of 73 in FL
Livability — Eagle Lake
- Score
- 77/100
- State rank
- #196
- US rank
- #3096
Category grades
Schools grade is shown separately in the Schools card above.
Census & demographics
- County
- Polk County · 740,051 people
- City population
- 4,397
- Metro
- Lakeland-Winter Haven, FL
- Population (ZIP)
- 33,740
- Household income
- $63,918
- Rent vs Own
- Severe rent burden
- 681.0
Population outlook (Polk County) Hauer SSP2
- Today (2025)
- 752,975 people
- By 2030
- 804,621 · +6.9%
- By 2040
- 906,117 · +20.3%
- By 2050
- 1,000,476 · +32.9%
- By 2075
- 1,197,520 · +59.0%
- By 2100
- 1,271,518 · +68.9%
Race, ethnicity, and origin ACS 2023
- Neighborhood character
- Diverse neighborhood (Simpson 0.62)
- Race & ethnicity
- White 55% Hispanic / Latino 22% Black 18% Two or more races 13% Asian 2%
- Hispanic origin (detail)
- Mexican 13% Puerto Rican 5%
- Common ancestry
- Italian 3% Slovak 1% Lithuanian 1%
- Foreign-born
- 8% · Canada
- Languages at home
- 81% English-only · Spanish 17% Other Indo-European 1% Other Asian/Pacific 1%
Political lean MEDSL · Polk
- 2024 margin
- Strong R (+20.7) · D 39.2% · R 59.9%
- 2008→2024 swing
- -14.6pp toward R · 2008: -6.1pp · 2024: -20.7pp
- All cycles
- 2024: R+20.7 2020: R+14.4 2016: R+14.1 2012: R+6.8 2008: R+6.1
Not yet ingested
- Civics
- —
Market trends
- HPI YoY
- ▼ -82.47%
- Current HPI
- 333.3392
- Rent YoY
- ▲ 2.72%
- Metro
- Lakeland-Winter Haven, FL
- State GDP YoY
- ▲ 3.28%
- F500 in state
- 36
Industry mix (Fortune 500 HQ in FL)
| Industry | F500 HQs | Revenue |
|---|---|---|
| Industrial Technology | 2 | $29B |
|
||
| Insurance | 2 | $17B |
|
||
| Retail | 1 | $60B |
|
||
| Technology Distribution | 1 | $58B |
|
||
| Homebuilding | 1 | $35B |
|
||
| Technology Manufacturing | 1 | $35B |
|
||
Price history
+3081.8% since first listed27 events — show timeline
- 2025-08-12 Listed $349,999 Stellar MLS as Distributed by MLS Grid
- 2025-06-26 Rental Removed $1,050 APPFOLIO
- 2025-06-04 Listed for Rent $1,050 APPFOLIO
- 2025-04-17 Rental Removed $1,195 APPFOLIO
- 2025-04-02 Listed for Rent $1,195 APPFOLIO
- 2024-11-16 Rental Removed $995 APPFOLIO
- 2024-09-14 Price Changed $995 APPFOLIO
- 2024-08-22 Listed for Rent $1,050 APPFOLIO
- 2023-07-26 Rental Removed $1,095 APPFOLIO
- 2023-07-12 Listed for Rent $1,095 APPFOLIO
- 2015-01-03 Listing Removed — Stellar MLS as Distributed by MLS Grid
- 2014-06-14 Relisted — Stellar MLS as Distributed by MLS Grid
- 2014-06-10 Listing Removed — Stellar MLS as Distributed by MLS Grid
- 2014-04-07 Relisted — Stellar MLS as Distributed by MLS Grid
- 2014-03-29 Listing Removed — Stellar MLS as Distributed by MLS Grid
- 2014-01-03 Listed $66,900 Stellar MLS as Distributed by MLS Grid
- 2010-11-11 Sold (MLS) $22,000 Stellar MLS as Distributed by MLS Grid
- 2010-09-07 Listed $27,000 Stellar MLS as Distributed by MLS Grid
- 2010-04-07 Listing Removed — Stellar MLS as Distributed by MLS Grid
- 2008-04-01 Listed $65,000 Stellar MLS as Distributed by MLS Grid
- 2007-02-15 Listed $195,000 Stellar MLS as Distributed by MLS Grid
- 2006-01-17 Sold (Public Records) $122,000 Public Records
- 2006-01-09 Sold (MLS) $122,000 Stellar MLS as Distributed by MLS Grid
- 2005-09-14 Listed $129,000 Stellar MLS as Distributed by MLS Grid
- 2005-04-05 Sold (Public Records) $77,400 Public Records
- 1998-05-01 Sold (Public Records) $11,000 Public Records
- 1998-05-01 Sold (Public Records) $11,000 Public Records
Property tax history
+17.1%/yrLatest (2025): $3,977 · +15.0% YoY. Source: county tax records.
Cash-flow waterfall
monthlySold comps — $/sqft
last 12 mo · ≤1 miLoading sold comps…