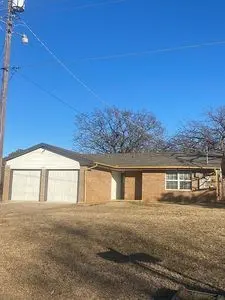
6424 West Dr · Guthrie, OK
Flood risk 1/10 · Minimal
- FEMA flood zone
- X (unshaded)
- Chance of flooding over 30 yrs
- 0.0%
- Est. flood insurance / yr
- $507 – $1,088
Fire risk 5/10 · Moderate
- Est. fire insurance / yr
- $2,463 – $4,575
Heat risk 6/10 · Moderate
- Hot days now (above 109°F)
- 7 days/yr
- Hot days in 30 yrs
- 19 days/yr
Wind risk 2/10 · Minimal
- Chance of severe wind over 30 yrs
- 4.0%
Air-quality risk 3/10 · Minor
- Unhealthy air days now
- 2 days/yr
- Unhealthy air days in 30 yrs
- 3 days/yr
Risk factors via First Street. Map © Google.
Why this score? — see what drove the D- grade
The composite is a weighted blend of 9 inputs, each scored 0–100. Each bar is that input's sub-score; the figure is the points it added to the 100-point composite (weight × sub-score).
- Cash flow +13.6/30.0
- ARV discount +5.2/15.0
- Rent growth +5.0/5.0
- DSCR +4.1/10.0
- Livability +3.7/5.0
- 1% rule +2.8/10.0
- Condition / age +2.5/5.0
- Schools +2.1/10.0
- Appreciation +0.0/10.0
$195,000
🖨 Deal sheet 📄 Offer letter ✓ Due diligence
Listing remarks
This 1119 square foot single family home has 3 bedrooms and 1.0 bathrooms. This home is located at 6424 West Dr, Guthrie, OK 73044.
Key facts
- Built 1973
Neighborhood map
What this means for you Summary
Snapshot
- This is a 3-bed/1.0-bath single-family listed at $195k.
Deal economics
- At list price, monthly cash flow is $12 ($148/yr) — positive.
- The deal already cash-flows at list — no discount required.
- To meet the 1% rule (rent ≥ 1% of price), the offer needs to be $152k (22.2% below list).
- Recommended offer: $152k (22.2% below list) — sets the bar for 1% rule.
- Cap rate 6.4% vs local median 3.0% in Guthrie — top-decile yield for the area; either an underpriced asset or a hidden risk that comps aren't pricing in. Stress-test before assuming the spread holds.
Location & tenants
- Location reads 74/100 on livability (#15 in OK, #4,696 nationally) — a middle-class / working-renter tenant base. Strengths: cost of living A+, housing A+, health & safety A+; Watch: schools F, amenities F, commute F.
- Guthrie (town): math 24% / reading 24% proficiency, ranked #119 of 270 in OK (top 44%) — low school quality limits family demand, transient renter base, plan for 1-2y turnover.
- Market conditions: Rents rising fast (+12.2%/yr); 843 active listings in the ZIP; 102 units permitted in Logan County in 2024 (0 in 5+ unit buildings).
Forward outlook
- Local home prices are declining (-3.0%/yr); year-one equity from $1k of loan paydown is wiped out by about $6k of value loss. Plan a longer hold.
- Logan County population projected at +36% by 2050 — long-run rental-demand tailwind backs the buy-and-hold thesis.
Negotiation context
- Only 1 days on market — expect competitive offers; lowballing is unlikely to land.
- 4 sale attempts since 11y ago with the ask held roughly flat each time — persistent listings suggest the price (not the market) is what's stuck; bring a comps-based counter.
Risks & watch-outs
- Climate carrying-cost: moderate wildfire risk; extreme-heat days projected 7→19/yr by 2055 (HVAC capex compounding) — expect insurance premiums to compound above CPI over the hold.
Questions for the listing agent
- Built in 1973 — when were the roof, HVAC, electrical panel, plumbing, and water heater last replaced?
- Is there a deadline driving the sale (1031 exchange, divorce, estate, relocation)? That informs how much negotiation room exists.
- Schools are F-rated, which usually means shorter tenancies and higher turnover. Who's the typical renter profile here, and what's been the actual vacancy rate?
- The area grade is low — what's the realistic commute time and amenity access for the typical tenant pool here? Any planned neighborhood developments (good or bad) we should know about?
- What's the average days-on-market for RENTAL listings here right now (not sales)? A rising rental-DOM trend means longer vacancies and softer asking-rent achievability than the comps imply.
- What's the recent tenant-quality profile in this submarket — average credit score on applications, eviction rate, late-payment / NSF rate, and stable-employment percentage? A property-management company in the area should have these aggregated.
- How much new for-sale + rental construction is in the pipeline within 1–3 miles? Heavy new supply typically softens prices + rents 12–24 months out; constrained supply supports both.
Investment metrics
- 1% rule
- 0.78% ✗
- Cap rate
- 6.37%
- Cash-on-cash
- 0.27%
- DSCR
- 1.01
- GRM
- 10.7
CMA / ARV
- ARV (on-the-fly)
- $185,588
- Comps found
- 1
Show comp detail 1 sale within ~0.75 mi
| Address | Dist | Beds/Ba | Sqft | Sold | Price | $/sf | Match |
|---|---|---|---|---|---|---|---|
| 6521 West Dr | 0.09mi | 3/1.0 | 1,224 (+13%) | 6mo | $210,000 | $172 | 69 |
Match score weights: distance 35% · size 25% · config 20% · recency 20%. Top-matched comps best support the ARV.
Projected returns pro-forma
-3.0% appreciation · 8.0% rent growth · sell at horizon
- IRR
- -11.1%
- Equity multiple
- 0.58×
- Total profit
- $-22,867
- Equity at exit
- $29,075
- IRR
- 3.6%
- Equity multiple
- 1.32×
- Total profit
- $17,292
- Equity at exit
- $16,860
Cash invested: $54,600 (down + closing). Projections, not guarantees.
Landlord ↔ Tenant lean methodology
- Overall (STATE)
- 83 Strongly Landlord-Friendly
- State Oklahoma
- 83 Strongly Landlord-Friendly · R+20
- County
- — inherits STATE
- City
- — inherits STATE
ZIP-level market 73044
- Home prices YoY
- -25.9%
- Rents YoY
- 12.2%
- Active inventory
- 843
- Price-to-rent
- 10.7×
Monthly cashflow live
- Estimated rent
- $1,517 medium interval (Pro) →
- Mortgage (P&I)
- −$1,023
- Tax from tax record
- −$83 /mo · $991/yr
- Insurance
- −$81
- HOA
- −$0
- Vacancy / Maint / Mgmt
- −$319
- Net cashflow
- $12
Break-even live
UW: 25.0% down · 7.5% · 30yr · 1.5% tax · 5.0% vac · 8.0% maint · 8.0% mgmt
Financing live
Cash to close
- Down payment
- $48,750
- Closing costs
- $5,850
- Reserves months
- —
- Total cash needed
- —
Loan-product check · same deal, 3 products live
Conventional
25% down · 7.5% · 30yr
- Down + closing
- —
- Monthly P&I
- —
- Monthly cashflow
- —
- DSCR
- —
- Eligible?
- —
Personal DTI + credit; lowest rate.
DSCR
20% down · 8.5% · 30yr
- Down + closing
- —
- Monthly P&I
- —
- Monthly cashflow
- —
- DSCR
- —
- Eligible?
- —
No personal income docs; deal must DSCR.
Hard money
10% down · 12.0% · 12mo
- Down + closing
- —
- Monthly P&I
- —
- Monthly cashflow
- —
- DSCR
- —
- Eligible?
- —
Short-term bridge; refi at stabilization.
Listing history 12 events
-
2026-05-26$195,000 Active
-
2026-04-10soldstatus $195,000
-
2015-10-16historical
-
2015-10-07price $105,000
-
2015-10-05status Active
-
2015-08-24status Pending
-
2015-08-03price $109,650
-
2015-07-02status Active
-
2015-06-09status Pending
-
2015-04-15price $114,450
-
2015-04-02$119,450 Active
-
2015-01-12soldstatus $56,500
ⓘ Source: listings_history table (triggers on properties + properties_extension) + one-shot
backfill from property_details.listing_events for pre-trigger history.
Tax reassessment forecast OK · Resets to sale price
- Current annual tax
- $991 · $83/mo
- Projected year-2 tax
- $1,755 · $146/mo
- Expected delta
- +$764/yr (+$64/mo · 77.1%)
ⓘ Screening estimate from a state-policy table — verify with the county assessor before closing.
Climate risk First Street
- Flood 1/10 Low FEMA zone X (unshaded) · 0% chance over 30 yrs
- Wildfire 5/10 Major
- Heat 6/10 Major 7 d/yr ≥109°F today · 19 d/yr by 30 yrs out
- Wind 2/10 Low 4% chance of damaging wind over 30 yrs
- Air quality 3/10 Moderate 2 unhealthy d/yr today · 3 by 30 yrs out
Nearby sold comps map
Loading sold comps map…
Walkable amenities ~0.75 mi
Loading nearby amenities…
Taxation est. · year 1
- Rental income
- $18,210
- − Mortgage interest
- −$10,923
- − Property taxes
- −$991
- − Insurance
- −$975
- − Repairs & maintenance
- −$1,457
- − Management
- −$1,457
- − Depreciation
- −$5,673
- Taxable loss
- −$3,266
- Est. tax savings @ 24.0%
- +$784
- After-tax cash flow
- $932/yr
For passive investors: Depreciation is non-cash, so a rental often shows a tax loss while cash-flowing — sheltering income. Rental losses are passive: they offset passive income freely, and up to $25,000/yr can offset ordinary (W-2) income if you actively participate and your MAGI is under $100k (phasing out to $0 by $150k); unused losses carry forward. On sale, claimed depreciation is recaptured at up to 25%, and gains may owe capital-gains tax (a 1031 exchange can defer both). Figures are a year-1 estimate at your 24.0% rate — not tax advice; consult a CPA.
Schools (NCES district)
- District
- Guthrie
- NCES district ID
- 4013560
- Math proficiency
- 24% ▼ -7.00%
- Reading proficiency
- 24% ▼ -2.00%
- Median HH income
- $45,370
- Composite
- 20.79/100
- National rank
- #8513
- State rank
- #119 of 270 in OK
Livability — Guthrie
- Score
- 74/100
- State rank
- #15
- US rank
- #4696
Category grades
Schools grade is shown separately in the Schools card above.
Census & demographics
- Census place
- Guthrie, OK
- County
- Logan County · 25,398 people
- City population
- 25,398
- Metro
- Oklahoma City, OK
- Population (ZIP)
- 25,398
- Household income
- $72,288
- Rent vs Own
- Severe rent burden
- 397.0
Population outlook (Logan County) Hauer SSP2
- Today (2025)
- 55,683 people
- By 2030
- 60,011 · +7.8%
- By 2040
- 68,071 · +22.2%
- By 2050
- 75,815 · +36.2%
- By 2075
- 94,749 · +70.2%
- By 2100
- 108,057 · +94.1%
Race, ethnicity, and origin ACS 2023
- Neighborhood character
- Predominantly White (77%)
- Race & ethnicity
- White 77% Two or more races 10% Hispanic / Latino 8% Black 6% Native American 3%
- Hispanic origin (detail)
- Mexican 7%
- Common ancestry
- Slovak 3% Lithuanian 3% Italian 2%
- Foreign-born
- 3% · Canada
- Languages at home
- 94% English-only · Spanish 6%
Political lean MEDSL · Logan
- 2024 margin
- Solid R (+49.0) · D 24.4% · R 73.5% · Other 2.1%
- 2008→2024 swing
- -11.6pp toward R · 2008: -37.4pp · 2024: -49.0pp
- All cycles
- 2024: R+49.0 2020: R+47.1 2016: R+49.5 2012: R+44.8 2008: R+37.4
Not yet ingested
- Civics
- —
Market trends
- HPI YoY
- ▼ -86.90%
- Current HPI
- 247.9481
- Rent YoY
- ▲ 12.22%
- Metro
- Oklahoma City, OK
- State GDP YoY
- ▲ 1.55%
- F500 in state
- 6
Industry mix (Fortune 500 HQ in OK)
| Industry | F500 HQs | Revenue |
|---|---|---|
| Energy | 3 | $48B |
|
||
Price history
+245.1% since first listed12 events — show timeline
- 2026-05-26 Listed $195,000 FSBO.com
- 2026-04-10 Sold (Public Records) $195,000 Public Records
- 2015-10-16 Listing Removed — MLSOK
- 2015-10-07 Price Changed $105,000 MLSOK
- 2015-10-05 Relisted — MLSOK
- 2015-08-24 Pending — MLSOK
- 2015-08-03 Price Changed $109,650 MLSOK
- 2015-07-02 Relisted — MLSOK
- 2015-06-09 Pending — MLSOK
- 2015-04-15 Price Changed $114,450 MLSOK
- 2015-04-02 Listed $119,450 MLSOK
- 2015-01-12 Sold (Public Records) $56,500 Public Records
Property tax history
+7.1%/yrLatest (2025): $991 · +6.7% YoY. Source: county tax records.
Cash-flow waterfall
monthlySold comps — $/sqft
last 12 mo · ≤1 miLoading sold comps…