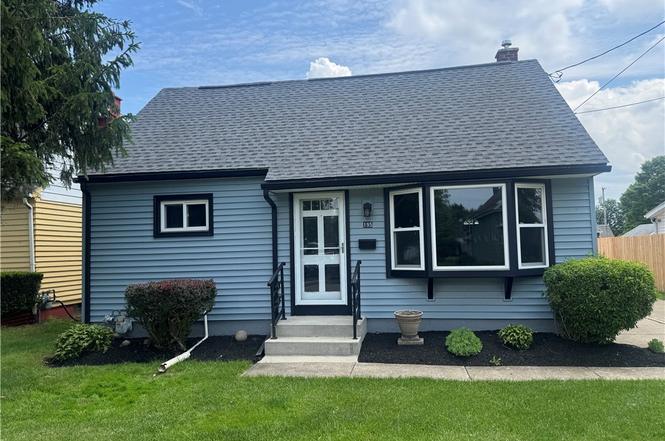
195 Aris Ave · Cheektowaga, NY
Flood risk 1/10 · Minimal
- FEMA flood zone
- X (unshaded)
- Chance of flooding over 30 yrs
- 0.0%
- Est. flood insurance / yr
- $473 – $860
Fire risk 1/10 · Minimal
- Est. fire insurance / yr
- $691 – $1,283
Heat risk 3/10 · Minor
- Hot days now (above 92°F)
- 7 days/yr
- Hot days in 30 yrs
- 16 days/yr
Wind risk 1/10 · Minimal
- Chance of severe wind over 30 yrs
- —
Air-quality risk 3/10 · Minor
- Unhealthy air days now
- 2 days/yr
- Unhealthy air days in 30 yrs
- 3 days/yr
Risk factors via First Street. Map © Google.
Why this score? — see what drove the D+ grade
The composite is a weighted blend of 9 inputs, each scored 0–100. Each bar is that input's sub-score; the figure is the points it added to the 100-point composite (weight × sub-score).
- ARV discount +14.2/15.0
- Appreciation +9.0/10.0
- Cash flow +7.6/30.0
- Livability +4.2/5.0
- 1% rule +3.7/10.0
- Schools +3.0/10.0
- Rent growth +2.5/5.0
- Condition / age +2.5/5.0
- DSCR +1.7/10.0
$189,900
🖨 Deal sheet (PDF) 📄 Offer letter ✓ Due diligence
Listing remarks
Vinyl sided home with newer roof (2025), basesment drainage and sump pump (2023) and HWT (2023). Home has central air, and a transfer switch for generator. Railings at front and rear entrance replaced in last 2 years. Windows replaced in 2018. Negotiations begin Tuesday June 16th at 5pm.
Key facts
- Vinyl sided home
- Basement drainage
- Sump pump
Tags
Property features AI
Exterior
- Parking: Detached garage (1 car)
- Utilities: Public water connected; Sewer connected
- Home design: Single-story home; Vinyl siding; Resale property
- Construction: Poured foundation
- Exterior features: Concrete driveway; Rectangular residential lot; City street frontage
Interior
- Kitchen: Gas range; Gas oven; Refrigerator; Eat-in kitchen
- Bedrooms: Main level bedroom (2); Lower-level bedroom; Lower-level bedroom (dimensions 12 x 9); Additional bedroom (dimensions 14 x 11)
- Flooring: Hardwood; Carpet; Vinyl; Varied flooring
- Bathrooms: One full bathroom (main level)
- Heating & cooling: Gas forced-air heating; Central air conditioning
- Interior features: Eat-in kitchen; Bedroom on main level; Full basement
- Laundry & utility: Washer; Dryer; Gas water heater
Neighborhood map
What this means for you Summary
Snapshot
- This is a 3-bed/1.0-bath single-family listed at $190k.
Deal economics
- At list price, monthly cash flow is $-229 ($-3k/yr) — negative.
- To cash-flow at today's rent, offer at most $149k (21.3% below list).
- To meet the 1% rule (rent ≥ 1% of price), the offer needs to be $165k (13.3% below list).
- Recommended offer: $149k (21.3% below list) — sets the bar for cash-flow.
- Cap rate 4.8% vs local median 3.8% in Cheektowaga — meaningfully above typical; check what's discounted (condition, days-on-market, listing class) to confirm the premium yield is real.
Location & tenants
- Location reads 84/100 on livability (#54 in NY, #811 nationally) — a professional / high-income tenant draw. Strengths: commute A+, housing A+, health & safety A+; Watch: crime C-.
- Cheektowaga-Sloan Union Free School District (urban): math 33% / reading 38% proficiency, ranked #555 of 590 in NY (top 94%) — families likely to look elsewhere, expect single-tenant / working-renter base with shorter leases.
- Zoned schools: Theodore Roosevelt School (328 students, 47% FRL); John F Kennedy Middle School (math 17% / reading 42%, grade F, #550 of 729 statewide, top 77%, 279 students, 54% FRL); John F Kennedy Senior High School (math 82% / reading 24%, grade C-, #934 of 1,100 statewide, top 86%, 370 students, 49% FRL).
- Market conditions: 170 active listings in the ZIP; 2 comparable units currently listed for rent nearby; 1,244 units permitted in Erie County in 2024 (563 in 5+ unit buildings).
- This rent runs 39% of the median local income ($50k/yr) — at the standard rent-burdened threshold; future hikes will face affordability resistance.
Forward outlook
- In year one you build about $17k of equity ($1k loan paydown + $15k appreciation (8.1% local appreciation)).
- By year 3, paydown + projected appreciation supports a ~$42k cash-out refi (75% LTV) — recoverable capital for the next deal without selling this one.
Negotiation context
- Only 11 days on market — expect competitive offers; lowballing is unlikely to land.
Risks & watch-outs
- Watch-outs: property tax is 2.9% of price; built in 1952 — expect roof / HVAC / electrical / plumbing capex.
Questions for the listing agent
- What do current leases actually rent for vs. the listed asking? Can we see a recent rent roll and the last 12 months of T-12 income?
- Built in 1952 — when were the roof, HVAC, electrical panel, plumbing, and water heater last replaced?
- Property tax is high relative to price — has the assessment been appealed recently, and will the sale trigger a re-assessment?
- Is there a deadline driving the sale (1031 exchange, divorce, estate, relocation)? That informs how much negotiation room exists.
- Schools are B-rated — typically a magnet for longer-tenancy family renters. What's the average tenant stay here, and is there a school-zone premium baked into asking?
- The area grade is low — what's the realistic commute time and amenity access for the typical tenant pool here? Any planned neighborhood developments (good or bad) we should know about?
- What's the average days-on-market for RENTAL listings here right now (not sales)? A rising rental-DOM trend means longer vacancies and softer asking-rent achievability than the comps imply.
- What's the recent tenant-quality profile in this submarket — average credit score on applications, eviction rate, late-payment / NSF rate, and stable-employment percentage? A property-management company in the area should have these aggregated.
- How much new for-sale + rental construction is in the pipeline within 1–3 miles? Heavy new supply typically softens prices + rents 12–24 months out; constrained supply supports both.
Investment metrics
- 1% rule
- 0.87% ✗
- Cap rate
- 4.85%
- Cash-on-cash
- -5.17%
- DSCR
- 0.77
- GRM
- 9.6
CMA / ARV
- ARV (on-the-fly)
- $222,948
- Comps found
- 12
Show comp detail 12 sales within ~0.75 mi
| Address | Dist | Beds/Ba | Sqft | Sold | Price | $/sf | Match |
|---|---|---|---|---|---|---|---|
| 108 Crisfield Ave | 0.18mi | 3/1.5 | 1,152 (+2%) | 5mo | $220,000 | $191 | 81 |
| 56 Peoria Ave | 0.33mi | 3/2.0 | 1,136 (+1%) | 0mo | $260,000 | $229 | 79 |
| 180 Bright St | 0.16mi | 3/1.0 | 1,222 (+8%) | 4mo | $242,000 | $198 | 75 |
| 255 Crisfield Ave | 0.10mi | 3/1.0 | 990 (-12%) | 2mo | $195,000 | $197 | 74 |
| 83 Patricia Ln | 0.66mi | 3/1.0 | 1,120 (-0%) | 1mo | $265,000 | $237 | 67 |
| 29 Frederick St | 0.37mi | 3/1.5 | 1,202 (+7%) | 3mo | $232,500 | $193 | 67 |
| 42 Henry St | 0.40mi | 3/1.5 | 1,074 (-5%) | 6mo | $155,000 | $144 | 66 |
| 43 Starlite Ave | 0.64mi | 3/1.0 | 1,120 (-0%) | 4mo | $250,000 | $223 | 66 |
| 2302 William St | 0.28mi | 2/1.0 (-1) | 1,208 (+7%) | 5mo | $142,000 | $118 | 66 |
| 104 Starlite Ave | 0.70mi | 3/1.0 | 1,120 (-0%) | 2mo | $260,000 | $232 | 64 |
| 34 Lehigh St | 0.40mi | 3/1.0 | 1,024 (-9%) | 5mo | $129,000 | $126 | 62 |
| 104 Iroquois Ave | 0.45mi | 3/1.0 | 972 (-14%) | 2mo | $248,500 | $256 | 54 |
Match score weights: distance 35% · size 25% · config 20% · recency 20%. Top-matched comps best support the ARV.
Projected returns pro-forma
8.06% appreciation · 3.0% rent growth · sell at horizon
- IRR
- 16.3%
- Equity multiple
- 2.21×
- Total profit
- $64,511
- Equity at exit
- $145,027
- IRR
- 15.7%
- Equity multiple
- 4.73×
- Total profit
- $198,356
- Equity at exit
- $288,600
Cash invested: $53,172 (down + closing). Projections, not guarantees.
Landlord ↔ Tenant lean methodology
- Overall (STATE)
- 15 Strongly Tenant-Friendly
- State New York
- 15 Strongly Tenant-Friendly · D+10
- County
- — inherits STATE
- City
- — inherits STATE
ZIP-level market 14206
- Home prices YoY
- 1.8%
- Active inventory
- 170
- Price-to-rent
- 9.6×
Monthly cashflow live
- Estimated rent
- $1,647 medium interval (Pro) →
- Mortgage (P&I)
- −$996
- Tax from tax record
- −$455 /mo · $5,465/yr
- Insurance
- −$79
- HOA
- −$0
- Vacancy / Maint / Mgmt
- −$346
- Net cashflow
- $-229
Break-even live
Sensitivity live
| Price | -10% $-122 | -5% $-175 | +0% $-229 | +5% $-283 | +10% $-337 |
|---|---|---|---|---|---|
| Rent | -10% $-359 | -5% $-294 | +0% $-229 | +5% $-164 | +10% $-99 |
| Rate | -1.0pp $-133 | -0.5pp $-181 | base $-229 | +0.5pp $-278 | +1.0pp $-328 |
UW: 25.0% down · 7.5% · 30yr · 1.5% tax · 5.0% vac · 8.0% maint · 8.0% mgmt
Financing live
Cash to close
- Down payment
- $47,475
- Closing costs
- $5,697
- Reserves months
- —
- Total cash needed
- —
Loan-product check · same deal, 3 products live
Conventional
25% down · 7.5% · 30yr
- Down + closing
- —
- Monthly P&I
- —
- Monthly cashflow
- —
- DSCR
- —
- Eligible?
- —
Personal DTI + credit; lowest rate.
DSCR
20% down · 8.5% · 30yr
- Down + closing
- —
- Monthly P&I
- —
- Monthly cashflow
- —
- DSCR
- —
- Eligible?
- —
No personal income docs; deal must DSCR.
Hard money
10% down · 12.0% · 12mo
- Down + closing
- —
- Monthly P&I
- —
- Monthly cashflow
- —
- DSCR
- —
- Eligible?
- —
Short-term bridge; refi at stabilization.
Rent comps 2 comps
| Address | Beds | Baths | Sqft | Rent | $/sqft | DOM | Units | Dist |
|---|---|---|---|---|---|---|---|---|
| 14 Rutland Ave Buffalo, NY | 4.0 | 1.0 | 1430 | $2,200 | $1.54 | 12d | 1 | 1.00mi |
| 65 Edgebrook Ests Buffalo, NY | 1.0–2.0 | 1.0 | 720 | $1,290 | $1.79 | 46d | 1 | 1.48mi |
Listing history 7 events
-
2026-06-21days on market $189,900 Active 11 DOM
-
2026-06-18days on market $189,900 Active 8 DOM
-
2026-06-17days on market $189,900 Active 7 DOM
-
2026-06-16days on market $189,900 Active 6 DOM
-
2026-06-15days on market $189,900 Active 5 DOM
-
2026-06-13remarks 288-char remark
-
2026-06-13$189,900 Active 3 DOM
ⓘ Source: listings_history table (triggers on properties + properties_extension) + one-shot
backfill from property_details.listing_events for pre-trigger history.
Tax reassessment forecast NY · Partial reset (capped growth)
- Current annual tax
- $5,465 · $455/mo
- Projected year-2 tax
- $5,465 · $455/mo
- Expected delta
- $0/yr ($0/mo · 0.0%)
ⓘ Screening estimate from a state-policy table — verify with the county assessor before closing.
Climate risk First Street
- Flood 1/10 Low FEMA zone X (unshaded) · 0% chance over 30 yrs
- Wildfire 1/10 Low
- Heat 3/10 Moderate 7 d/yr ≥92°F today · 16 d/yr by 30 yrs out
- Wind 1/10 Low
- Air quality 3/10 Moderate 2 unhealthy d/yr today · 3 by 30 yrs out
Nearby sold comps map
Loading sold comps map…
Walkable amenities ~0.75 mi
Loading nearby amenities…
Taxation est. · year 1
- Rental income
- $19,768
- − Mortgage interest
- −$10,637
- − Property taxes
- −$5,465
- − Insurance
- −$950
- − Repairs & maintenance
- −$1,581
- − Management
- −$1,581
- − Depreciation
- −$5,524
- Taxable loss
- −$5,971
- Est. tax savings @ 24.0%
- +$1,433
- After-tax cash flow
- $-1,315/yr
For passive investors: Depreciation is non-cash, so a rental often shows a tax loss while cash-flowing — sheltering income. Rental losses are passive: they offset passive income freely, and up to $25,000/yr can offset ordinary (W-2) income if you actively participate and your MAGI is under $100k (phasing out to $0 by $150k); unused losses carry forward. On sale, claimed depreciation is recaptured at up to 25%, and gains may owe capital-gains tax (a 1031 exchange can defer both). Figures are a year-1 estimate at your 24.0% rate — not tax advice; consult a CPA.
Schools (NCES district)
- District
- Cheektowaga-Sloan Union Free School District
- NCES district ID
- 3627000
- Math proficiency
- 33% ▼ -16.00%
- Reading proficiency
- 38% ▼ -6.00%
- Median HH income
- $45,810
- Composite
- 30.35/100
- National rank
- #6263
- State rank
- #555 of 590 in NY
Livability — Cheektowaga
- Score
- 84/100
- State rank
- #54
- US rank
- #811
Category grades
Schools grade is shown separately in the Schools card above.
Census & demographics
- Census place
- Cheektowaga, NY
- County
- Erie County · 714,559 people
- City population
- 440,021
- Metro
- Buffalo-Cheektowaga, NY
- Population (ZIP)
- 21,631
- Household income
- $50,450
- Rent vs Own
- Severe rent burden
- 841.0
Population outlook (Erie County) Hauer SSP2
- Today (2025)
- 933,037 people
- By 2030
- 935,181 · +0.2%
- By 2040
- 928,531 · -0.5%
- By 2050
- 905,725 · -2.9%
- By 2075
- 834,037 · -10.6%
- By 2100
- 708,033 · -24.1%
Race, ethnicity, and origin ACS 2023
- Neighborhood character
- Majority White (65%)
- Race & ethnicity
- White 65% Hispanic / Latino 13% Black 12% Two or more races 8% Asian 4%
- Hispanic origin (detail)
- Mexican 2% Puerto Rican 10%
- Common ancestry
- Romanian 25% Lithuanian 1% Italian 1%
- Foreign-born
- 6% · Canada, China
- Languages at home
- 88% English-only · Spanish 5% Other Indo-European 3% Arabic 2%
Political lean MEDSL · Erie
- 2024 margin
- Lean D (+9.7) · D 54.8% · R 45.2%
- 2008→2024 swing
- -7.9pp toward R · 2008: 17.5pp · 2024: 9.7pp
- All cycles
- 2024: D+9.7 2020: D+14.7 2016: D+4.8 2012: D+15.6 2008: D+17.5
Not yet ingested
- Civics
- —
Market trends
- HPI YoY
- ▲ 8.06%
- Current HPI
- 457.3935
- Rent YoY
- —
- Metro
- Buffalo-Cheektowaga, NY
- State GDP YoY
- ▲ 2.60%
- F500 in state
- 92
Industry mix (Fortune 500 HQ in NY)
| Industry | F500 HQs | Revenue |
|---|---|---|
| Financial Services | 10 | $950B |
|
||
| Consumer Goods | 9 | $162B |
|
||
| Insurance | 4 | $225B |
|
||
| Telecommunications | 2 | $144B |
|
||
| Pharmaceuticals | 2 | $112B |
|
||
| Media / Entertainment | 2 | $69B |
|
||
Price history
1 event — show timeline
- 2026-06-10 Listed $189,900 WNYREIS
Property tax history
+9.5%/yrLatest (2025): $5,465 · +1.2% YoY. Source: county tax records.
Cash-flow waterfall
monthlySold comps — $/sqft
last 12 mo · ≤1 miLoading sold comps…