 Multi-family
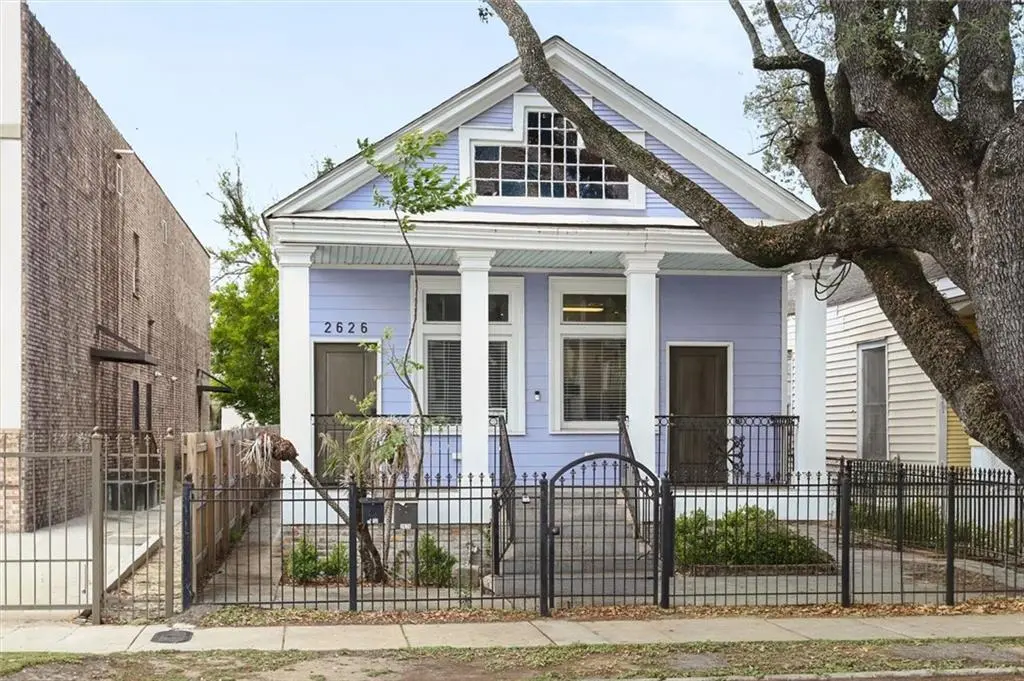
2626 Louisiana Ave · New Orleans, LA
Flood risk 8/10 · Major
- FEMA flood zone
- X (shaded)
- Chance of flooding over 30 yrs
- 0.6%
- Est. flood insurance / yr
- $507 – $1,088
Fire risk 1/10 · Minimal
- Est. fire insurance / yr
- $1,269 – $2,357
Heat risk 10/10 · Severe
- Hot days now (above 108°F)
- 7 days/yr
- Hot days in 30 yrs
- 20 days/yr
Wind risk 10/10 · Severe
- Chance of severe wind over 30 yrs
- 99.0%
Air-quality risk 3/10 · Minor
- Unhealthy air days now
- 3 days/yr
- Unhealthy air days in 30 yrs
- 4 days/yr
Risk factors via First Street. Map © Google.
Why this score? — see what drove the D- grade
The composite is a weighted blend of 9 inputs, each scored 0–100. Each bar is that input's sub-score; the figure is the points it added to the 100-point composite (weight × sub-score).
- Cash flow +13.2/30.0
- ARV discount +8.8/15.0
- DSCR +4.0/10.0
- Livability +4.0/5.0
- 1% rule +3.7/10.0
- Condition / age +2.5/5.0
- Rent growth +2.1/5.0
- Schools +1.6/10.0
- Appreciation +0.0/10.0
$399,000
🖨 Deal sheet (PDF) 📄 Offer letter ✓ Due diligence
Multi-family units
County records classify this as Multi-Family (2-4 Unit). Listing-text estimate: 1 unit. estimate disagrees with records
Listing remarks MLS
Spacious, move-in-ready home offering 5 bedrooms, 4 full bathrooms, and 2,160 square feet of living space. An open and flowing floor plan creates a seamless connection between the main living areas — ideal for everyday living and effortless entertaining. Five generously sized bedrooms offer versatility — whether you need a dedicated home office, a guest suite, a playroom, or all of the above. Additional highlights include two primary suites with private baths and large walk in closets. Practical storage throughout. This property places you close to everything that matters — schools, dining, shopping, and major commuter routes.
Key facts
- Open floor plan
- Close to schools
- Close to dining
Tags
Neighborhood map
What this means for you Summary
Snapshot
- This is a 5-bed/4.0-bath multifamily listed at $399k.
Deal economics
- At list price, monthly cash flow is $-75 ($-903/yr) — negative.
- To cash-flow at today's rent, offer at most $388k (2.7% below list).
- To meet the 1% rule (rent ≥ 1% of price), the offer needs to be $348k (12.8% below list).
- Recommended offer: $348k (12.8% below list) — sets the bar for 1% rule.
- Cap rate 6.3% vs local median 4.4% in New Orleans — top-decile yield for the area; either an underpriced asset or a hidden risk that comps aren't pricing in. Stress-test before assuming the spread holds.
Location & tenants
- Location reads 81/100 on livability (#3 in LA, #1,383 nationally) — a professional / high-income tenant draw. Strengths: amenities A+, commute A+, health & safety A+; Watch: crime C-, employment D.
- Orleans Parish (urban): math 11% / reading 27% proficiency, ranked #69 of 98 in LA (top 70%) — low school quality limits family demand, transient renter base, plan for 1-2y turnover; 68% free/reduced lunch — lower-income household profile, screen leases tightly.
- Zoned schools: Benjamin Franklin Elem. Math And Science (math 12% / reading 23%, grade F, #479 of 646 statewide, top 75%, 747 students, 98% FRL, charter) — zoned schools average 98% FRL vs 68% district-wide (30 pts higher); higher-poverty schools than district average — tighter screening recommended.
- Market conditions: Rents soft (-1.4%/yr); 280 active listings in the ZIP; 38 comparable units currently listed for rent nearby; rentals lingering (median 46d on market — plan ~5-8 weeks vacancy on turnover, expect pricing pressure); 53% of comp listings sitting > 30 days — soft ceiling on asking rent; solid renter incomes; 710 units permitted in Orleans Parish in 2024 (244 in 5+ unit buildings).
- At $3,479/mo this rent would consume 46% of the median local household income ($90k/yr) (locally 1756% of renters already pay >50% of income on rent) — very limited rent-growth headroom before tenants either downsize or default.
Forward outlook
- Local home prices are declining (-3.0%/yr); year-one equity from $3k of loan paydown is wiped out by about $12k of value loss. Plan a longer hold.
- Orleans County population projected at +61% by 2050 — long-run rental-demand tailwind backs the buy-and-hold thesis.
Negotiation context
- It's been on market 69 days — a 6% lower offer ($375k) is reasonable based on typical stale-listing flexibility.
- 7 sale attempts since 18y ago with the ask held roughly flat each time — persistent listings suggest the price (not the market) is what's stuck; bring a comps-based counter.
Risks & watch-outs
- Watch-outs: flood insurance adds $66/mo; built in 1925 — expect roof / HVAC / electrical / plumbing capex.
- Climate carrying-cost: severe flood risk; severe wind risk, 99% chance of damaging wind over 30y; extreme-heat days projected 7→20/yr by 2055 (HVAC capex compounding) — expect insurance premiums to compound above CPI over the hold.
Questions for the listing agent
- What do current leases actually rent for vs. the listed asking? Can we see a recent rent roll and the last 12 months of T-12 income?
- It's been on market 69 days. Have you received any prior offers? Is the seller open to a 13% concession, seller financing, or rate buy-down credit?
- Built in 1925 — when were the roof, HVAC, electrical panel, plumbing, and water heater last replaced?
- What's the actual annual flood-insurance premium (NFIP or private), and is the property in a SFHA with mandatory coverage?
- Why hasn't it sold? Are there any deal-killer items the seller is aware of (foundation, flood, title, zoning, code violations)?
- Is there a deadline driving the sale (1031 exchange, divorce, estate, relocation)? That informs how much negotiation room exists.
- The area grade is low — what's the realistic commute time and amenity access for the typical tenant pool here? Any planned neighborhood developments (good or bad) we should know about?
- What's the average days-on-market for RENTAL listings here right now (not sales)? A rising rental-DOM trend means longer vacancies and softer asking-rent achievability than the comps imply.
- What's the recent tenant-quality profile in this submarket — average credit score on applications, eviction rate, late-payment / NSF rate, and stable-employment percentage? A property-management company in the area should have these aggregated.
- How much new apartment / multifamily construction is in the pipeline within 1–3 miles? Heavy new supply (>2% of stock underway) typically softens rents 12–24 months out; light construction supports rent growth.
Investment metrics
- 1% rule
- 0.87% ✗
- Cap rate
- 6.27%
- Cash-on-cash
- -0.09%
- DSCR
- 1.00
- GRM
- 9.6
CMA / ARV
- ARV (median comp)
- $411,182
- List price
- $399,000
- Delta
- -2.96%
- Verdict
- FAIR
- Comps
- 20 within 1.0 mi
Show comp detail 12 sales within ~0.75 mi
| Address | Dist | Beds/Ba | Sqft | Sold | Price | $/sf | Match |
|---|---|---|---|---|---|---|---|
| 3505-07 07 Dryades St | 0.54mi | 5/3.5 | 2,214 (+2%) | 2mo | $220,000 | $99 | 67 |
| 2315 Peniston St | 0.24mi | 4/2.0 (-1) | 2,115 (-2%) | 7mo | $275,000 | $130 | 66 |
| 3721 23 Willow St | 0.20mi | 6/2.0 (+1) | 2,281 (+6%) | 3mo | $117,000 | $51 | 66 |
| 3619-25 Delachaise St | 0.67mi | 4/4.0 (-1) | 2,162 (+0%) | 7mo | $315,000 | $146 | 58 |
| 4617 19 Clara St | 0.46mi | 6/2.0 (+1) | 2,037 (-6%) | 0mo | $140,000 | $69 | 56 |
| 2113 15 Fourth St | 0.51mi | 5/3.0 | 2,379 (+10%) | 0mo | $315,000 | $132 | 55 |
| 2419 S Saratoga St | 0.61mi | 6/3.0 (+1) | 2,280 (+6%) | 0mo | $400,000 | $175 | 53 |
| 4617-19 Clara St | 0.59mi | 6/2.0 (+1) | 2,036 (-6%) | 0mo | $140,000 | $69 | 50 |
| 2122 24 Rev John Raphel Jr Way | 0.68mi | 4/4.0 (-1) | 2,369 (+10%) | 5mo | $199,900 | $84 | 43 |
| 2712 14 S Johnson St | 0.56mi | 4/4.0 (-1) | 1,870 (-13%) | 6mo | $246,200 | $132 | 41 |
| 2023 A B First St | 0.68mi | 6/4.5 (+1) | 2,445 (+13%) | 1mo | $485,000 | $198 | 38 |
| 1917 Jena St | 0.69mi | 4/2.0 (-1) | 1,857 (-14%) | 1mo | $215,000 | $116 | 30 |
Match score weights: distance 35% · size 25% · config 20% · recency 20%. Top-matched comps best support the ARV.
Projected returns pro-forma
-3.0% appreciation · 0.0% rent growth · sell at horizon
- IRR
- -21.1%
- Equity multiple
- 0.29×
- Total profit
- $-79,549
- Equity at exit
- $59,492
- IRR
- -23.9%
- Equity multiple
- -0.02×
- Total profit
- $-114,466
- Equity at exit
- $34,498
Cash invested: $111,720 (down + closing). Projections, not guarantees.
Landlord ↔ Tenant lean methodology
- Overall (STATE)
- 90 Strongly Landlord-Friendly
- State Louisiana
- 90 Strongly Landlord-Friendly · R+12
- County
- — inherits STATE
- City
- — inherits STATE
ZIP-level market 70115
- Rents YoY
- -1.4%
- Active inventory
- 280
- Price-to-rent
- 9.6×
Monthly cashflow live
- Estimated rent
- $3,479 high interval (Pro) →
- Mortgage (P&I)
- −$2,092
- Tax est. 1.5%
- −$499 /mo · $5,985/yr
- Insurance
- −$166
- Flood insurance flood zone
- −$66 /mo · $798/yr
- HOA
- −$0
- Vacancy / Maint / Mgmt
- −$731
- Net cashflow
- $-75
Break-even live
Sensitivity live
| Price | -10% $201 | -5% $63 | +0% $-75 | +5% $-213 | +10% $-351 |
|---|---|---|---|---|---|
| Rent | -10% $-350 | -5% $-213 | +0% $-75 | +5% $62 | +10% $200 |
| Rate | -1.0pp $126 | -0.5pp $26 | base $-75 | +0.5pp $-179 | +1.0pp $-284 |
UW: 25.0% down · 7.5% · 30yr · 1.5% tax · 5.0% vac · 8.0% maint · 8.0% mgmt
Financing live
Cash to close
- Down payment
- $99,750
- Closing costs
- $11,970
- Reserves months
- —
- Total cash needed
- —
Loan-product check · same deal, 3 products live
Conventional
25% down · 7.5% · 30yr
- Down + closing
- —
- Monthly P&I
- —
- Monthly cashflow
- —
- DSCR
- —
- Eligible?
- —
Personal DTI + credit; lowest rate.
DSCR
20% down · 8.5% · 30yr
- Down + closing
- —
- Monthly P&I
- —
- Monthly cashflow
- —
- DSCR
- —
- Eligible?
- —
No personal income docs; deal must DSCR.
Hard money
10% down · 12.0% · 12mo
- Down + closing
- —
- Monthly P&I
- —
- Monthly cashflow
- —
- DSCR
- —
- Eligible?
- —
Short-term bridge; refi at stabilization.
Rent comps 38 comps
| Address | Beds | Baths | Sqft | Rent | $/sqft | DOM | Units | Dist |
|---|---|---|---|---|---|---|---|---|
| 2600 Peniston St New Orleans, LA | 4.0 | 2.0 | 2342 | $3,500 | $1.49 | 45d | 1 | 0.17mi |
| 2608 Magnolia St New Orleans, LA | 4.0 | 2.5 | 1950 | $3,200 | $1.64 | 45d | 1 | 0.34mi |
| 3200 Washington Ave Unit NA New Orleans, LA | 4.0 | 3.0 | 2490 | $3,400 | $1.37 | 5d | 1 | 0.43mi |
| 4213 Dryades St New Orleans, LA | 4.0 | 2.0 | 2000 | $2,800 | $1.40 | 25d | 1 | 0.62mi |
| 4442 S Johnson St Unit 4442 New Orleans, LA | 4.0 | 4.5 | 3000 | $4,500 | $1.50 | 13d | 1 | 0.66mi |
| 1907 Napoleon Ave New Orleans, LA | 4.0 | 2.0 | 2500 | $2,800 | $1.12 | 19d | 1 | 0.67mi |
| 3112 Upperline St New Orleans, LA | 5.0 | 3.5 | 2800 | $3,650 | $1.30 | 25d | 1 | 0.72mi |
| 2625 Jefferson Ave New Orleans, LA | 4.0 | 2.0 | 2000 | $2,600 | $1.30 | 45d | 1 | 0.85mi |
| 2519 Octavia St New Orleans, LA | 4.0 | 2.0 | 1600 | $3,900 | $2.44 | 45d | 1 | 0.92mi |
| 5718 Cucullu St New Orleans, LA | 4.0 | 3.0 | 1873 | $2,500 | $1.33 | 19d | 1 | 1.00mi |
| 2229 Joseph St New Orleans, LA | 4.0 | 2.0 | 1830 | $4,000 | $2.19 | 19d | 1 | 1.02mi |
| 5533 S Tonti St New Orleans, LA | 4.0 | 4.0 | 3000 | $3,000 | $1.00 | 16d | 1 | 1.04mi |
| 2117 S Lopez St New Orleans, LA | 5.0 | 2.0 | 1920 | $2,000 | $1.04 | 25d | 1 | 1.07mi |
| 5819 Clara St New Orleans, LA | 4.0 | 2.0 | 1596 | $2,500 | $1.57 | 45d | 1 | 1.08mi |
| 5832 Willow St New Orleans, LA | 4.0 | 3.5 | 1400 | $3,295 | $2.35 | 45d | 1 | 1.09mi |
| 2322 Nashville Ave New Orleans, LA | 4.0 | 2.0 | 2249 | $2,750 | $1.22 | 45d | 1 | 1.10mi |
| 5830 Clara St Unit 1 New Orleans, LA | 4.0 | 2.0 | 2100 | $4,500 | $2.14 | 45d | 1 | 1.11mi |
| 2325 State St New Orleans, LA | 5.0 | 3.0 | 1800 | $4,000 | $2.22 | 25d | 1 | 1.13mi |
| 3737 Nashville Ave New Orleans, LA | 4.0 | 2.0 | 2000 | $3,400 | $1.70 | 23d | 1 | 1.14mi |
| 2703 Palmer Ave New Orleans, LA | 5.0 | 2.0 | 2349 | $5,500 | $2.34 | 45d | 1 | 1.15mi |
| 2715 Palmer Ave New Orleans, LA | 5.0 | 2.0 | 2184 | $4,900 | $2.24 | 45d | 1 | 1.16mi |
| 2211 State St New Orleans, LA | 4.0 | 4.0 | 1650 | $4,200 | $2.55 | 19d | 1 | 1.16mi |
| 2832 Palmer Ave Unit Up New Orleans, LA | 4.0 | 2.0 | 1720 | $2,900 | $1.69 | 45d | 1 | 1.17mi |
| 2818 Palmer Ave New Orleans, LA | 5.0 | 2.0 | 1832 | $4,900 | $2.67 | 45d | 1 | 1.18mi |
| 2738 Calhoun St New Orleans, LA | 4.0 | 2.0 | 1900 | $4,800 | $2.53 | 5d | 1 | 1.23mi |
| 6326 S Johnson St Unit 1 New Orleans, LA | 5.0 | 2.0 | 2013 | $3,950 | $1.96 | 45d | 1 | 1.23mi |
| 2616 Calhoun St New Orleans, LA | 4.0 | 2.5 | 2850 | $2,500 | $0.88 | 45d | 1 | 1.24mi |
| 6321 S Prieur St New Orleans, LA | 6.0 | 2.0 | 1900 | $4,200 | $2.21 | 45d | 1 | 1.25mi |
| 1021 1st St New Orleans, LA | 4.0 | 4.0 | 2621 | $4,500 | $1.72 | 5d | 1 | 1.25mi |
| 2227 29 Joseph St New Orleans, LA | 4.0 | 2.0 | 1830 | $4,000 | $2.19 | 45d | 1 | 1.28mi |
| 1435 Euterpe St New Orleans, LA | 4.0 | 3.5 | 2825 | $16,000 | $5.66 | 17d | 1 | 1.29mi |
| 4 Cromwell Pl New Orleans, LA | 5.0 | 2.0 | 2600 | $7,000 | $2.69 | 45d | 1 | 1.32mi |
| 822 Howard Ave Unit 1272354P New Orleans, LA | 1.0–5.0 | 1.0–4.0 | 1749 | $11,882 | $6.79 | 3d | 3 | 1.36mi |
| 2308 Audubon St New Orleans, LA | 4.0 | 1.5 | 1480 | $3,050 | $2.06 | 17d | 1 | 1.46mi |
| 2651 Poydras St New Orleans, LA | 1.0–4.0 | 1.0–2.0 | 1095 | $2,545 | $2.32 | 3d | 16 | 1.46mi |
| 7011 Jeannette St Unit A New Orleans, LA | 5.0 | 3.0 | 2200 | $5,000 | $2.27 | 45d | 1 | 1.48mi |
| 2201 Broadway St Unit 2 New Orleans, LA | 4.0 | 2.0 | 2000 | $3,000 | $1.50 | 45d | 1 | 1.49mi |
| 7015 Willow St New Orleans, LA | 5.0 | 3.0 | 2000 | $4,200 | $2.10 | 45d | 1 | 1.50mi |
Listing history 22 events
-
2026-06-21days on market $399,000 Active 69 DOM
-
2026-06-18days on market $399,000 Active 66 DOM
-
2026-06-17days on market $399,000 Active 65 DOM
-
2026-06-16days on market $399,000 Active 64 DOM
-
2026-06-15days on market $399,000 Active 63 DOM
-
2026-06-13days on market $399,000 Active 61 DOM
-
2026-06-10days on market $399,000 Active 58 DOM
-
2026-06-09days on market $399,000 Active 57 DOM
-
2026-06-08pricedays on market $399,000 Active 56 DOM
-
2026-06-07days on market $419,000 Active 55 DOM
-
2026-06-05days on market $419,000 Active 52 DOM
-
2026-06-03days on market $419,000 Active 51 DOM
-
2026-06-02days on market $419,000 Active 50 DOM
-
2026-06-01days on market $419,000 Active 49 DOM
-
2026-05-31days on market $419,000 Active 48 DOM
-
2026-04-13$419,000 Active 652-char remark
Show marketing remark (637 chars)
Spacious, move-in-ready home offering 5 bedrooms, 4 full bathrooms, and 2,160 square feet of living space. An open and flowing floor plan creates a seamless connection between the main living areas -- ideal for everyday living and effortless entertaining. Five generously sized bedrooms offer versatility -- whether you need a dedicated home office, a guest suite, a playroom, or all of the above. Additional highlights include two primary suites with private baths and large walk in closets. Practical storage throughout. This property places you close to everything that matters -- schools, dining, shopping, and major commuter routes.
-
2026-04-13$419,000 Active 637-char remark
Show marketing remark (637 chars)
Spacious, move-in-ready home offering 5 bedrooms, 4 full bathrooms, and 2,160 square feet of living space. An open and flowing floor plan creates a seamless connection between the main living areas -- ideal for everyday living and effortless entertaining. Five generously sized bedrooms offer versatility -- whether you need a dedicated home office, a guest suite, a playroom, or all of the above. Additional highlights include two primary suites with private baths and large walk in closets. Practical storage throughout. This property places you close to everything that matters -- schools, dining, shopping, and major commuter routes.
-
2010-04-07$249,900
-
2009-06-15$195,000
-
2008-09-11$199,000
-
2008-09-10$109,000
-
2008-09-10$109,000
ⓘ Source: listings_history table (triggers on properties + properties_extension) + one-shot
backfill from property_details.listing_events for pre-trigger history.
Climate risk First Street
- Flood 8/10 Severe FEMA zone X (shaded) · 60% chance over 30 yrs
- Wildfire 1/10 Low
- Heat 10/10 Extreme 7 d/yr ≥108°F today · 20 d/yr by 30 yrs out
- Wind 10/10 Extreme 99% chance of damaging wind over 30 yrs
- Air quality 3/10 Moderate 3 unhealthy d/yr today · 4 by 30 yrs out
Nearby sold comps map
Loading sold comps map…
Walkable amenities ~0.75 mi
Loading nearby amenities…
Taxation est. · year 1
- Rental income
- $41,751
- − Mortgage interest
- −$22,350
- − Property taxes
- −$5,985
- − Insurance
- −$2,792
- − Repairs & maintenance
- −$3,340
- − Management
- −$3,340
- − Depreciation
- −$11,607
- Taxable loss
- −$7,664
- Est. tax savings @ 24.0%
- +$1,839
- After-tax cash flow
- $937/yr
For passive investors: Depreciation is non-cash, so a rental often shows a tax loss while cash-flowing — sheltering income. Rental losses are passive: they offset passive income freely, and up to $25,000/yr can offset ordinary (W-2) income if you actively participate and your MAGI is under $100k (phasing out to $0 by $150k); unused losses carry forward. On sale, claimed depreciation is recaptured at up to 25%, and gains may owe capital-gains tax (a 1031 exchange can defer both). Figures are a year-1 estimate at your 24.0% rate — not tax advice; consult a CPA.
Schools (NCES district)
- District
- Orleans Parish
- NCES district ID
- 2201170
- Math proficiency
- 11% ▼ -52.00%
- Reading proficiency
- 27% ▼ -46.00%
- Median HH income
- $37,011
- Composite
- 15.78/100
- National rank
- #9271
- State rank
- #69 of 98 in LA
Livability — New Orleans
- Score
- 81/100
- State rank
- #3
- US rank
- #1383
Category grades
Schools grade is shown separately in the Schools card above.
Census & demographics
- Census place
- New Orleans, LA
- County
- Orleans Parish · 338,817 people
- City population
- 338,817
- Metro
- New Orleans-Metairie, LA
- Population (ZIP)
- 31,183
- Household income
- $90,182
- Rent vs Own
- Severe rent burden
- 1756.0
Population outlook (Orleans County) Hauer SSP2
- Today (2025)
- 513,025 people
- By 2030
- 575,781 · +12.2%
- By 2040
- 700,174 · +36.5%
- By 2050
- 826,541 · +61.1%
- By 2075
- 1,123,374 · +119.0%
- By 2100
- 1,355,609 · +164.2%
Race, ethnicity, and origin ACS 2023
- Neighborhood character
- Diverse neighborhood (Simpson 0.58)
- Race & ethnicity
- White 59% Black 26% Two or more races 8% Hispanic / Latino 7% Asian 3%
- Hispanic origin (detail)
- Mexican 1%
- Common ancestry
- Lithuanian 8% Italian 3% Slovak 3%
- Foreign-born
- 5% · Canada, China
- Languages at home
- 91% English-only · Spanish 4% French/Haitian/Cajun 2% Other Indo-European 1%
Political lean MEDSL · Orleans
- 2024 margin
- Solid D (+67.0) · D 82.2% · R 15.2% · Other 2.7%
- 2008→2024 swing
- +6.7pp toward D · 2008: 60.3pp · 2024: 67.0pp
- All cycles
- 2024: D+67.0 2020: D+68.2 2016: D+66.2 2012: D+62.5 2008: D+60.3
Not yet ingested
- Civics
- —
Market trends
- HPI YoY
- ▼ -272.08%
- Current HPI
- 287.2138
- Rent YoY
- ▼ -1.42%
- Metro
- New Orleans-Metairie, LA
- State GDP YoY
- ▲ 3.29%
- F500 in state
- 10
Industry mix (Fortune 500 HQ in LA)
| Industry | F500 HQs | Revenue |
|---|---|---|
| Telecommunications | 2 | $23B |
|
||
| Utilities | 1 | $12B |
|
||
| Wholesale / Distribution | 1 | $5B |
|
||
| Advertising | 1 | $2B |
|
||
Price history
+284.4% since first listed7 events — show timeline
- 2026-04-13 Listed $419,000 AcadianaMLS
- 2026-04-13 Listed $419,000 GSREIN
- 2010-04-07 Listed $249,900 GSREIN
- 2009-06-15 Listed $195,000 GSREIN
- 2008-09-11 Listed $199,000 GSREIN
- 2008-09-10 Listed $109,000 GSREIN
- 2008-09-10 Listed $109,000 AcadianaMLS
Cash-flow waterfall
monthlySold comps — $/sqft
last 12 mo · ≤1 miLoading sold comps…