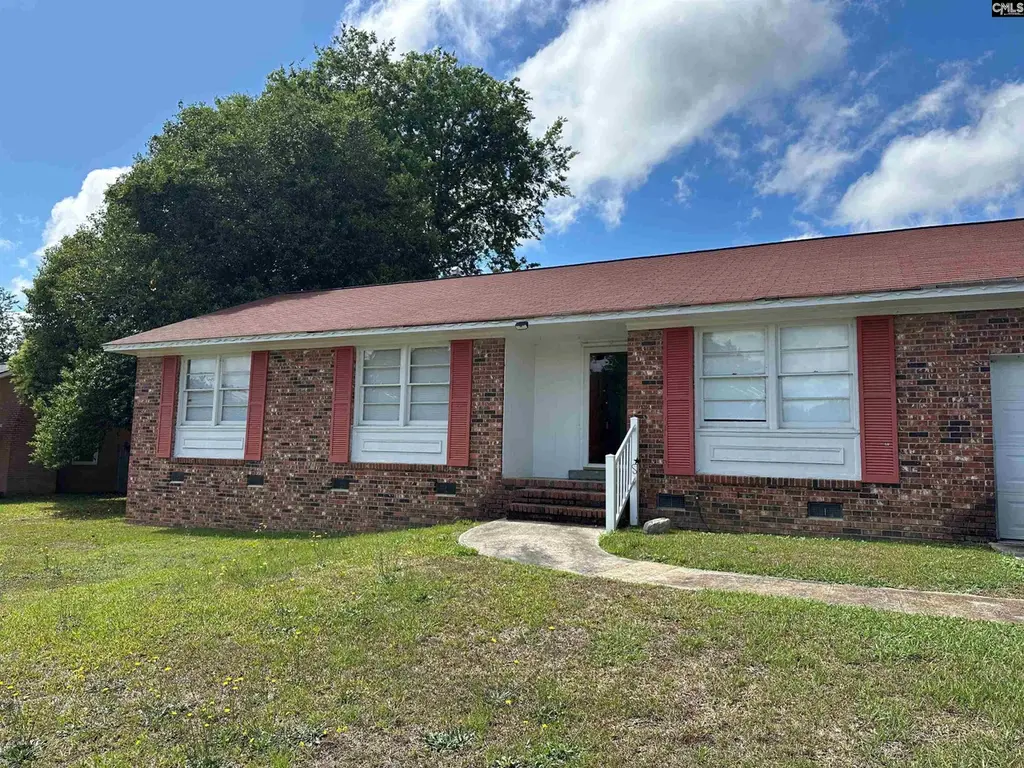
1703 Alba Dr · Capitol View, SC
Flood risk 1/10 · Minimal
- FEMA flood zone
- X (unshaded)
- Chance of flooding over 30 yrs
- 0.0%
- Est. flood insurance / yr
- $507 – $1,088
Fire risk 4/10 · Minor
- Est. fire insurance / yr
- $783 – $1,453
Heat risk 7/10 · Major
- Hot days now (above 108°F)
- 7 days/yr
- Hot days in 30 yrs
- 16 days/yr
Wind risk 7/10 · Major
- Chance of severe wind over 30 yrs
- 76.0%
Air-quality risk 3/10 · Minor
- Unhealthy air days now
- 2 days/yr
- Unhealthy air days in 30 yrs
- 2 days/yr
Risk factors via First Street. Map © Google.
Why this score? — see what drove the C- grade
The composite is a weighted blend of 9 inputs, each scored 0–100. Each bar is that input's sub-score; the figure is the points it added to the 100-point composite (weight × sub-score).
- Cash flow +23.2/30.0
- DSCR +7.5/10.0
- ARV discount +5.3/15.0
- 1% rule +5.1/10.0
- Rent growth +3.0/5.0
- Schools +2.6/10.0
- Livability +2.5/5.0
- Condition / age +2.5/5.0
- Appreciation +0.0/10.0
$193,500
🖨 Deal sheet 📄 Offer letter ✓ Due diligence
Listing remarks
Hazelwood Subdivision in Columbia, SC, All Brick, 4 bedrooms, 2 baths, one car garage, dining room, family room and eat in kitchen. Conveniently located to downtown Columbia, I-77, I-26. Large lot could add a shop, home with lots of potential. Disclaimer: CMLS has not reviewed and, therefore, does not endorse vendors who may appear in listings.
Key facts
- Eat in kitchen
- All brick
- Large lot
Tags
Property features AI
Exterior
- Parking: Attached garage with 1 parking space
- Utilities: Public sewer; Public water
- Home design: Single-family property
- Construction: Crawlspace foundation
- Exterior features: Brick exterior above foundation; Chain link fence; Paved road access; Public water
Interior
- Kitchen: Formica countertops; Free-standing range; Dishwasher
- Bedrooms: Master bedroom on main level; All other bedrooms on main level
- Bathrooms: Two full bathrooms
- Heating & cooling: Central heating; Central air conditioning
- Interior features: Dishwasher; Free-standing range; Formica countertops
- Laundry & utility: Washer and dryer located on the main level
Neighborhood map
What this means for you Summary
Snapshot
- This is a 4-bed/2.0-bath single-family listed at $194k.
Deal economics
- At list price, monthly cash flow is $350 ($4k/yr) — positive.
- The deal already cash-flows at list — no discount required.
- Meets the 1% rule at list price ($2k rent vs $194k).
- Recommended offer: $188k (3.0% below list) — sets the bar for market timing.
Location & tenants
- Location reads: area grade C — affects rentability + tenant quality, not the cash-flow math above.
- Richland 01 (urban): math 26% / reading 36% proficiency, ranked #54 of 80 in SC (top 68%) — families likely to look elsewhere, expect single-tenant / working-renter base with shorter leases; 64% free/reduced lunch — lower-income household profile, screen leases tightly.
- Zoned schools: Annie Burnside Elementary (math 12% / reading 22%, grade F, #515 of 597 statewide, top 89%, 328 students, 100% FRL); A. C. Flora High (math 42% / reading 92%, grade B, #73 of 196 statewide, top 41%, 1,352 students, 100% FRL) — zoned schools average 100% FRL vs 64% district-wide (36 pts higher); higher-poverty schools than district average — tighter screening recommended.
- Market conditions: Rents rising (+2.1%/yr); 295 active listings in the ZIP; 18 comparable units currently listed for rent nearby; rentals at typical pace (median 14d on market — plan ~3-4 weeks tenant-placement turnaround); 3,472 units permitted in Richland County in 2024 (1,096 in 5+ unit buildings).
- This rent runs 40% of the median local income ($59k/yr) — at the standard rent-burdened threshold; future hikes will face affordability resistance.
Forward outlook
- Local home prices are declining (-3.0%/yr); year-one equity from $1k of loan paydown is wiped out by about $6k of value loss. Plan a longer hold.
- Richland County population projected at +30% by 2050 — long-run rental-demand tailwind backs the buy-and-hold thesis.
Negotiation context
- It's been on market 33 days — a 3% lower offer ($188k) is reasonable based on typical stale-listing flexibility.
Risks & watch-outs
- Climate carrying-cost: major wind risk, 76% chance of damaging wind over 30y; extreme-heat days projected 7→16/yr by 2055 (HVAC capex compounding) — expect insurance premiums to compound above CPI over the hold.
Questions for the listing agent
- It's been on market 33 days. Have you received any prior offers? Is the seller open to a 3% concession, seller financing, or rate buy-down credit?
- Built in 1966 — when were the roof, HVAC, electrical panel, plumbing, and water heater last replaced?
- Is there a deadline driving the sale (1031 exchange, divorce, estate, relocation)? That informs how much negotiation room exists.
- What's the average days-on-market for RENTAL listings here right now (not sales)? A rising rental-DOM trend means longer vacancies and softer asking-rent achievability than the comps imply.
- What's the recent tenant-quality profile in this submarket — average credit score on applications, eviction rate, late-payment / NSF rate, and stable-employment percentage? A property-management company in the area should have these aggregated.
- How much new for-sale + rental construction is in the pipeline within 1–3 miles? Heavy new supply typically softens prices + rents 12–24 months out; constrained supply supports both.
Investment metrics
- 1% rule
- 1.01% ✓
- Cap rate
- 8.47%
- Cash-on-cash
- 7.76%
- DSCR
- 1.35
- GRM
- 8.3
CMA / ARV
- ARV (on-the-fly)
- $184,338
- Comps found
- 2
Show comp detail 2 sales within ~0.75 mi
| Address | Dist | Beds/Ba | Sqft | Sold | Price | $/sf | Match |
|---|---|---|---|---|---|---|---|
| 1527 Burnside Ave | 0.35mi | 3/2.0 (-1) | 1,601 (-1%) | 5mo | $183,000 | $114 | 73 |
| 7901 Tradd St | 0.65mi | 3/2.5 (-1) | 1,612 (-0%) | 1mo | $160,000 | $99 | 61 |
Match score weights: distance 35% · size 25% · config 20% · recency 20%. Top-matched comps best support the ARV.
Projected returns pro-forma
-3.0% appreciation · 2.08% rent growth · sell at horizon
- IRR
- -5.4%
- Equity multiple
- 0.80×
- Total profit
- $-10,886
- Equity at exit
- $28,851
- IRR
- 3.1%
- Equity multiple
- 1.22×
- Total profit
- $11,805
- Equity at exit
- $16,730
Cash invested: $54,180 (down + closing). Projections, not guarantees.
Landlord ↔ Tenant lean methodology
- Overall (STATE)
- 90 Strongly Landlord-Friendly
- State South Carolina
- 90 Strongly Landlord-Friendly · R+6
- County
- — inherits STATE
- City
- — inherits STATE
ZIP-level market 29209
- Rents YoY
- 2.1%
- Active inventory
- 295
- Price-to-rent
- 8.3×
Monthly cashflow live
- Estimated rent
- $1,951 high interval (Pro) →
- Mortgage (P&I)
- −$1,015
- Tax from tax record
- −$96 /mo · $1,146/yr
- Insurance
- −$81
- HOA
- −$0
- Vacancy / Maint / Mgmt
- −$410
- Net cashflow
- $350
Break-even live
UW: 25.0% down · 7.5% · 30yr · 1.5% tax · 5.0% vac · 8.0% maint · 8.0% mgmt
Financing live
Cash to close
- Down payment
- $48,375
- Closing costs
- $5,805
- Reserves months
- —
- Total cash needed
- —
Loan-product check · same deal, 3 products live
Conventional
25% down · 7.5% · 30yr
- Down + closing
- —
- Monthly P&I
- —
- Monthly cashflow
- —
- DSCR
- —
- Eligible?
- —
Personal DTI + credit; lowest rate.
DSCR
20% down · 8.5% · 30yr
- Down + closing
- —
- Monthly P&I
- —
- Monthly cashflow
- —
- DSCR
- —
- Eligible?
- —
No personal income docs; deal must DSCR.
Hard money
10% down · 12.0% · 12mo
- Down + closing
- —
- Monthly P&I
- —
- Monthly cashflow
- —
- DSCR
- —
- Eligible?
- —
Short-term bridge; refi at stabilization.
Rent comps 18 comps
| Address | Beds | Baths | Sqft | Rent | $/sqft | DOM | Units | Dist |
|---|---|---|---|---|---|---|---|---|
| 1727 Sandra Dr Columbia, SC | 4.0 | 2.5 | 1750 | $1,900 | $1.09 | 11d | 1 | 0.06mi |
| 7116 Tama Rd Columbia, SC | 3.0 | 1.0–1.5 | 600 | $1,225 | $2.04 | 23d | 1 | 0.38mi |
| 149 Moores Creek Dr Columbia, SC | 3.0 | 2.0 | 1600 | $2,069 | $1.29 | 14d | 1 | 0.60mi |
| 7015 Mirror Lake Rd Columbia, SC | 3.0 | 2.0 | 2043 | $1,800 | $0.88 | 23d | 1 | 0.65mi |
| 1101 Hallbrook Dr Columbia, SC | 1.0–3.0 | 1.0–2.0 | 1050 | $1,229 | $1.17 | 14d | 1 | 0.78mi |
| 150 Daphne Rd Columbia, SC | 3.0 | 2.0 | 1123 | $1,025 | $0.91 | 23d | 1 | 0.85mi |
| 7648 Garners Ferry Rd Columbia, SC | 3.0 | 1.0–2.0 | 828 | $1,279 | $1.54 | 14d | 1 | 0.93mi |
| 7524 Marie St Columbia, SC | 3.0 | 1.0 | 1075 | $1,350 | $1.26 | 21d | 1 | 0.96mi |
| 7743 Garners Ferry Rd Columbia, SC | 1.0–3.0 | 1.0–2.5 | 1045 | $2,534 | $2.42 | 2d | 19 | 1.06mi |
| 79 Blue Fescue Way Columbia, SC | 4.0 | 2.5 | 2075 | $2,295 | $1.11 | 11d | 1 | 1.20mi |
| 72 Blue Fescue Way Columbia, SC | 4.0 | 2.5 | 2075 | $2,233 | $1.08 | 14d | 1 | 1.20mi |
| 27 Blue Fescue Way Columbia, SC | 4.0 | 2.5 | 2075 | $2,283 | $1.10 | 23d | 1 | 1.31mi |
| 600 Greenlawn Dr Columbia, SC | 1.0–3.0 | 1.0–2.0 | 1017 | $1,830 | $1.80 | 2d | 25 | 1.36mi |
| 156 Top Forest Dr Columbia, SC | 3.0 | 2.5 | 1855 | $2,500 | $1.35 | 23d | 1 | 1.37mi |
| 76 Springway Dr Columbia, SC | 3.0 | 2.5 | 1326 | $1,829 | $1.38 | 11d | 1 | 1.42mi |
| 320 Beacons Field Rd Columbia, SC | 3.0 | 2.5 | 1663 | $2,183 | $1.31 | 14d | 1 | 1.46mi |
| 448 Red Poll Way Columbia, SC | 4.0 | 2.5 | 1783 | $2,183 | $1.22 | 23d | 1 | 1.46mi |
| 425 Red Poll Way Columbia, SC | 4.0 | 2.5 | 1783 | $2,133 | $1.20 | 23d | 1 | 1.48mi |
Listing history 12 events
-
2026-06-15status $193,500 Pending 33 DOM
-
2026-06-15days on market $193,500 Active 33 DOM
-
2026-06-14days on market $193,500 Active 31 DOM
-
2026-06-10days on market $193,500 Active 28 DOM
-
2026-06-09days on market $193,500 Active 27 DOM
-
2026-06-08days on market $193,500 Active 26 DOM
-
2026-06-07days on market $193,500 Active 25 DOM
-
2026-06-03days on market $193,500 Active 21 DOM
-
2026-06-03days on market $193,500 Active 20 DOM
-
2026-06-01days on market $193,500 Active 19 DOM
-
2026-05-31days on market $193,500 Active 18 DOM
-
2026-05-13$193,500 Active
ⓘ Source: listings_history table (triggers on properties + properties_extension) + one-shot
backfill from property_details.listing_events for pre-trigger history.
Tax reassessment forecast SC · Resets to sale price
- Current annual tax
- $1,146 · $96/mo
- Projected year-2 tax
- $1,146 · $96/mo
- Expected delta
- $0/yr ($0/mo · 0.0%)
ⓘ Screening estimate from a state-policy table — verify with the county assessor before closing.
Climate risk First Street
- Flood 1/10 Low FEMA zone X (unshaded) · 0% chance over 30 yrs
- Wildfire 4/10 Moderate
- Heat 7/10 Severe 7 d/yr ≥108°F today · 16 d/yr by 30 yrs out
- Wind 7/10 Severe 76% chance of damaging wind over 30 yrs
- Air quality 3/10 Moderate 2 unhealthy d/yr today · 2 by 30 yrs out
Nearby sold comps map
Loading sold comps map…
Walkable amenities ~0.75 mi
Loading nearby amenities…
Taxation est. · year 1
- Rental income
- $23,412
- − Mortgage interest
- −$10,839
- − Property taxes
- −$1,146
- − Insurance
- −$968
- − Repairs & maintenance
- −$1,873
- − Management
- −$1,873
- − Depreciation
- −$5,629
- Taxable income
- $1,084
- Est. tax owed @ 24.0%
- −$260
- After-tax cash flow
- $3,945/yr
For passive investors: Depreciation is non-cash, so a rental often shows a tax loss while cash-flowing — sheltering income. Rental losses are passive: they offset passive income freely, and up to $25,000/yr can offset ordinary (W-2) income if you actively participate and your MAGI is under $100k (phasing out to $0 by $150k); unused losses carry forward. On sale, claimed depreciation is recaptured at up to 25%, and gains may owe capital-gains tax (a 1031 exchange can defer both). Figures are a year-1 estimate at your 24.0% rate — not tax advice; consult a CPA.
Schools (NCES district)
- District
- Richland 01
- NCES district ID
- 4503360
- Math proficiency
- 26% ▼ -7.00%
- Reading proficiency
- 36% ▼ -5.00%
- Median HH income
- $38,931
- Composite
- 25.94/100
- National rank
- #7335
- State rank
- #54 of 80 in SC
Livability — Capitol View
No livability data for this city. (Only ~50 U.S. cities are tracked.)
Census & demographics
- Census place
- Capitol View, SC
- County
- Richland County · 389,530 people
- Metro
- Columbia, SC
- Population (ZIP)
- 38,041
- Household income
- $58,772
- Rent vs Own
- Severe rent burden
- 1716.0
Population outlook (Richland County) Hauer SSP2
- Today (2025)
- 459,667 people
- By 2030
- 487,524 · +6.1%
- By 2040
- 542,035 · +17.9%
- By 2050
- 595,371 · +29.5%
- By 2075
- 732,998 · +59.5%
- By 2100
- 820,415 · +78.5%
Race, ethnicity, and origin ACS 2023
- Neighborhood character
- Diverse neighborhood (Simpson 0.62)
- Race & ethnicity
- Black 48% White 39% Two or more races 6% Hispanic / Latino 6% Asian 2%
- Hispanic origin (detail)
- Mexican 3% Puerto Rican 2%
- Common ancestry
- Slovak 2% Serbian 2% Italian 1%
- Foreign-born
- 6% · Canada, Jamaica
- Languages at home
- 93% English-only · Spanish 3% Arabic 1% Other Indo-European 1%
Political lean MEDSL · Richland
- 2024 margin
- Solid D (+34.6) · D 66.4% · R 31.8% · Other 1.8%
- 2008→2024 swing
- +5.7pp toward D · 2008: 28.9pp · 2024: 34.6pp
- All cycles
- 2024: D+34.6 2020: D+38.3 2016: D+32.9 2012: D+33.3 2008: D+28.9
Not yet ingested
- Civics
- —
Market trends
- HPI YoY
- ▼ -142.10%
- Current HPI
- 205.5679
- Rent YoY
- ▲ 2.08%
- Metro
- Columbia, SC
- State GDP YoY
- ▲ 4.51%
- F500 in state
- 2
Industry mix (Fortune 500 HQ in SC)
| Industry | F500 HQs | Revenue |
|---|---|---|
| Packaging | 1 | $7B |
|
||
Price history
1 event — show timeline
- 2026-05-13 Listed $193,500 Consolidated MLS
Property tax history
+6.3%/yrLatest (2025): $1,146 · +4.2% YoY. Source: county tax records.
Cash-flow waterfall
monthlySold comps — $/sqft
last 12 mo · ≤1 miLoading sold comps…