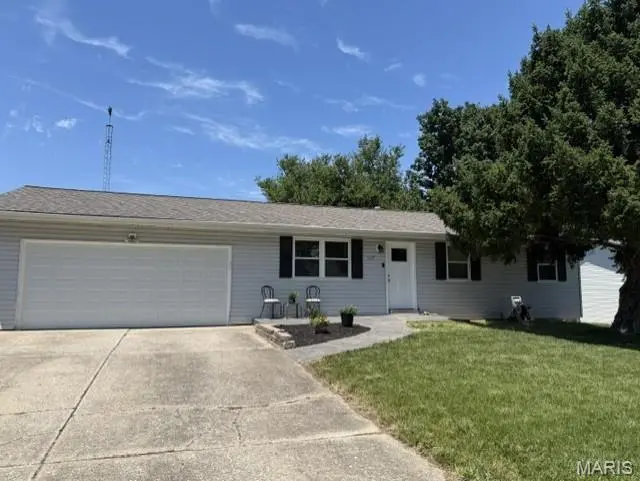
3629 Chervil Dr · St. Peters, MO
Flood risk 1/10 · Minimal
- FEMA flood zone
- X (unshaded)
- Chance of flooding over 30 yrs
- 0.0%
- Est. flood insurance / yr
- $473 – $860
Fire risk 1/10 · Minimal
- Est. fire insurance / yr
- $1,054 – $1,958
Heat risk 5/10 · Moderate
- Hot days now (above 108°F)
- 7 days/yr
- Hot days in 30 yrs
- 20 days/yr
Wind risk 2/10 · Minimal
- Chance of severe wind over 30 yrs
- 1.0%
Air-quality risk 2/10 · Minimal
- Unhealthy air days now
- 2 days/yr
- Unhealthy air days in 30 yrs
- 2 days/yr
Risk factors via First Street. Map © Google.
Why this score? — see what drove the D grade
The composite is a weighted blend of 9 inputs, each scored 0–100. Each bar is that input's sub-score; the figure is the points it added to the 100-point composite (weight × sub-score).
- Cash flow +13.9/30.0
- ARV discount +9.7/15.0
- Schools +5.2/10.0
- DSCR +4.2/10.0
- Rent growth +3.3/5.0
- 1% rule +3.2/10.0
- Livability +2.5/5.0
- Condition / age +2.5/5.0
- Appreciation +0.0/10.0
$275,000
🖨 Deal sheet (PDF) 📄 Offer letter ✓ Due diligence
Listing remarks MLS
*PRICE IMPROVEMENT!!* CLEAN CLEAN CLEAN! This is YOUR opportunity to own just under 2000sf of living space for just under $200k in an Unincorporated St. Charles County neighborhood!! Freshly painted! NEW Luxury Vinyl Flooring; NEW 6 Panel Doors; NEW Carpet in all 3 Bedrooms; NEW Kitchen Countertop; NEW Ceiling fans in Living Room & Kitchen; Finished Lower Level (also has NEW Luxury Vinyl Flooring) has possible extra sleeping room with walk in closet! Kitchen is updated and has oversized sliding window to offer great view of backyard. Walkways to front door are GRAY STAMPED CONCRETE creating a beautiful entrance to this home! Driveway has third row of parking leading to the Two Car Garage with Electric Opener. Garage has NEW man-door leading to LEVEL, FENCED backyard. This Home has been priced to sell; MOVE IN READY!!
Key facts
- Walk-in closet
- Stainless appliances
- Finished lower level
Tags
Property features AI
Finance
- Other: No other structures on the property; Level lot; Asphalt city street frontage
- Financial info: Lease not considered
Exterior
- Parking: Attached garage with garage door opener; Garage faces front; Two garage spaces; Additional parking and parking pad
- Security: Smoke detector(s)
- Utilities: Public water; Public sewer (sewer connected); 220-volt electric service; Cable available
- Home design: Single family residence; Updated / remodeled condition; One level; House structure; Private ownership
- Construction: Vinyl siding; Asphalt roof; Concrete perimeter foundation; Basement with concrete pour and 8+ ft ceiling
- Exterior features: Private yard; Back yard fencing; Patio; Porch; Panel doors
Interior
- Kitchen: Dishwasher; Disposal; Microwave; Electric oven; Eat-in kitchen
- Bedrooms: Three bedrooms on the main level
- Bathrooms: One full bathroom on the main level
- Heating & cooling: Forced air heating; Central air conditioning; Ceiling fans for additional cooling
- Interior features: Ceiling fans; Eat-in kitchen; Insulated windows with screens; Storage space in basement; Smoke detectors
- Laundry & utility: Laundry located on the lower level
Neighborhood map
What this means for you Summary
Snapshot
- This is a 3-bed/1.0-bath single-family listed at $275k.
Deal economics
- At list price, monthly cash flow is $28 ($338/yr) — positive.
- The deal already cash-flows at list — no discount required.
- To meet the 1% rule (rent ≥ 1% of price), the offer needs to be $226k (17.7% below list).
- Recommended offer: $226k (17.7% below list) — sets the bar for 1% rule.
- Cap rate 6.4% vs local median 4.2% in St. Peters — top-decile yield for the area; either an underpriced asset or a hidden risk that comps aren't pricing in. Stress-test before assuming the spread holds.
Location & tenants
- Location reads: area grade D — affects rentability + tenant quality, not the cash-flow math above.
- Francis Howell R-III (suburban): math 53% / reading 63% proficiency, ranked #11 of 324 in MO (top 3%) — acceptable for families but not a draw, mixed tenant base, ~2y average lease; only 15% free/reduced lunch — higher-income household profile.
- Zoned schools: Becky-David Elem. (math 62% / reading 71%, grade B+, #57 of 1,115 statewide, top 5%, 849 students, 13% FRL); Barnwell Middle (math 51% / reading 64%, grade B, #30 of 391 statewide, top 8%, 741 students, 16% FRL); Francis Howell North High (math 40% / reading 55%, grade D, #154 of 521 statewide, top 29%, 1,679 students, 19% FRL) — zoned schools at 16% FRL track the district average.
- Market conditions: Rents rising (+3.3%/yr); 202 active listings in the ZIP; 12 comparable units currently listed for rent nearby; rentals leasing fast (median 13d on market — plan ~1-2 weeks tenant-placement turnaround); solid renter incomes; 2,021 units permitted in St. Charles County in 2024 (568 in 5+ unit buildings).
Forward outlook
- Local home prices are declining (-3.0%/yr); year-one equity from $2k of loan paydown is wiped out by about $8k of value loss. Plan a longer hold.
- St. Charles County population projected at +22% by 2050 — long-run rental-demand tailwind backs the buy-and-hold thesis.
Negotiation context
- Only 3 days on market — expect competitive offers; lowballing is unlikely to land.
- Current owner paid $185k; 49% above their basis — modest negotiation headroom, anchor on the comps not their cost.
Risks & watch-outs
- Climate carrying-cost: extreme-heat days projected 7→20/yr by 2055 (HVAC capex compounding) — expect insurance premiums to compound above CPI over the hold.
Questions for the listing agent
- Built in 1976 — when were the roof, HVAC, electrical panel, plumbing, and water heater last replaced?
- Is there a deadline driving the sale (1031 exchange, divorce, estate, relocation)? That informs how much negotiation room exists.
- The area grade is low — what's the realistic commute time and amenity access for the typical tenant pool here? Any planned neighborhood developments (good or bad) we should know about?
- What's the average days-on-market for RENTAL listings here right now (not sales)? A rising rental-DOM trend means longer vacancies and softer asking-rent achievability than the comps imply.
- What's the recent tenant-quality profile in this submarket — average credit score on applications, eviction rate, late-payment / NSF rate, and stable-employment percentage? A property-management company in the area should have these aggregated.
- How much new for-sale + rental construction is in the pipeline within 1–3 miles? Heavy new supply typically softens prices + rents 12–24 months out; constrained supply supports both.
Investment metrics
- 1% rule
- 0.82% ✗
- Cap rate
- 6.42%
- Cash-on-cash
- 0.44%
- DSCR
- 1.02
- GRM
- 10.1
CMA / ARV
- ARV (on-the-fly)
- $288,992
- Comps found
- 12
Show comp detail 12 sales within ~0.75 mi
| Address | Dist | Beds/Ba | Sqft | Sold | Price | $/sf | Match |
|---|---|---|---|---|---|---|---|
| 3633 Coriander Dr | 0.11mi | 3/1.0 | 1,728 (+5%) | 1mo | $250,000 | $145 | 86 |
| 3605 Thyme Dr | 0.17mi | 3/2.5 | 1,680 (+2%) | 3mo | $290,000 | $173 | 79 |
| 1427 Caulks Hill Rd | 0.27mi | 3/1.0 | 1,536 (-6%) | 4mo | $270,000 | $176 | 73 |
| 1349 Nutmeg Dr | 0.08mi | 3/2.5 | 1,505 (-8%) | 4mo | $295,000 | $196 | 73 |
| 3235 Country Knoll Dr | 0.40mi | 3/2.0 | 1,594 (-3%) | 1mo | $345,000 | $216 | 72 |
| 1124 Concord Dr | 0.62mi | 3/2.0 | 1,744 (+6%) | 0mo | $325,000 | $186 | 57 |
| 3143 La Baron Ln | 0.35mi | 3/2.0 | 1,881 (+15%) | 1mo | $485,000 | $258 | 55 |
| 1126 Yorktown Dr | 0.58mi | 3/2.5 | 1,748 (+6%) | 3mo | $299,900 | $172 | 54 |
| 3515 Eagles Hill Rdg | 0.54mi | 3/2.0 | 1,854 (+13%) | 6mo | $380,000 | $205 | 44 |
| 1188 Musket Dr | 0.58mi | 3/2.5 | 1,884 (+15%) | 6mo | $310,000 | $165 | 37 |
| 1401 Westin Dr | 0.74mi | 3/2.0 | 1,879 (+14%) | 2mo | $300,000 | $160 | 36 |
| 3528 Arlington Dr | 0.71mi | 3/3.0 | 1,885 (+15%) | 4mo | $315,000 | $167 | 30 |
Match score weights: distance 35% · size 25% · config 20% · recency 20%. Top-matched comps best support the ARV.
Projected returns pro-forma
-3.0% appreciation · 3.27% rent growth · sell at horizon
- IRR
- -15.3%
- Equity multiple
- 0.45×
- Total profit
- $-42,203
- Equity at exit
- $41,003
- IRR
- -6.4%
- Equity multiple
- 0.58×
- Total profit
- $-32,109
- Equity at exit
- $23,777
Cash invested: $77,000 (down + closing). Projections, not guarantees.
Landlord ↔ Tenant lean methodology
- Overall (STATE)
- 81 Strongly Landlord-Friendly
- State Missouri
- 81 Strongly Landlord-Friendly · R+10
- County
- — inherits STATE
- City
- — inherits STATE
ZIP-level market 63303
- Rents YoY
- 3.3%
- Active inventory
- 202
- Price-to-rent
- 10.1×
Monthly cashflow live
- Estimated rent
- $2,263 high interval (Pro) →
- Mortgage (P&I)
- −$1,442
- Tax from tax record
- −$203 /mo · $2,432/yr
- Insurance
- −$115
- HOA
- −$0
- Vacancy / Maint / Mgmt
- −$475
- Net cashflow
- $28
Break-even live
Sensitivity live
| Price | -10% $184 | -5% $106 | +0% $28 | +5% $-50 | +10% $-127 |
|---|---|---|---|---|---|
| Rent | -10% $-151 | -5% $-61 | +0% $28 | +5% $118 | +10% $207 |
| Rate | -1.0pp $167 | -0.5pp $98 | base $28 | +0.5pp $-43 | +1.0pp $-116 |
UW: 25.0% down · 7.5% · 30yr · 1.5% tax · 5.0% vac · 8.0% maint · 8.0% mgmt
Financing live
Cash to close
- Down payment
- $68,750
- Closing costs
- $8,250
- Reserves months
- —
- Total cash needed
- —
Loan-product check · same deal, 3 products live
Conventional
25% down · 7.5% · 30yr
- Down + closing
- —
- Monthly P&I
- —
- Monthly cashflow
- —
- DSCR
- —
- Eligible?
- —
Personal DTI + credit; lowest rate.
DSCR
20% down · 8.5% · 30yr
- Down + closing
- —
- Monthly P&I
- —
- Monthly cashflow
- —
- DSCR
- —
- Eligible?
- —
No personal income docs; deal must DSCR.
Hard money
10% down · 12.0% · 12mo
- Down + closing
- —
- Monthly P&I
- —
- Monthly cashflow
- —
- DSCR
- —
- Eligible?
- —
Short-term bridge; refi at stabilization.
Rent comps 12 comps
| Address | Beds | Baths | Sqft | Rent | $/sqft | DOM | Units | Dist |
|---|---|---|---|---|---|---|---|---|
| 145 Sesame Loop Unit 1 St Charles, MO | 3.0 | 2.5 | 1869 | $2,450 | $1.31 | 9d | 1 | 0.47mi |
| 3515 Ridgewood Dr Saint Charles, MO | 3.0 | 2.5 | 1677 | $2,535 | $1.51 | 6d | 1 | 0.69mi |
| 1321 Forest Creek Dr St Peters, MO | 2.0 | 1.0 | 1359 | $2,000 | $1.47 | 46d | 1 | 0.84mi |
| 3039 Plum Creek Dr Saint Peters, MO | 3.0 | 2.0 | 1300 | $2,180 | $1.68 | 24d | 1 | 0.94mi |
| 1000 Jasper Ln St Peters, MO | 1.0–3.0 | 1.0–2.0 | 1047 | $2,332 | $2.23 | 4d | 12 | 0.98mi |
| 206 Waterside Crossing Ct Saint Peters, MO | 2.0 | 2.0 | 1256 | $2,100 | $1.67 | 12d | 1 | 1.05mi |
| 2970 Aintree Dr Saint Charles, MO | 3.0 | 2.0 | 1318 | $2,380 | $1.81 | 46d | 1 | 1.05mi |
| 641 Autumn Oaks Dr Saint Peters, MO | 3.0 | 2.0 | 2200 | $2,441 | $1.11 | 24d | 1 | 1.06mi |
| 733 Pecan Hill Dr Saint Charles, MO | 3.0 | 2.0 | 1882 | $2,750 | $1.46 | 46d | 1 | 1.12mi |
| 1200 Belfast Dr St Peters, MO | 1.0–3.0 | 1.0–2.0 | 1031 | $2,114 | $2.05 | 0d | 11 | 1.20mi |
| 3891 Cambridge Crossing Dr Saint Charles, MO | 3.0 | 2.0 | 1509 | $2,396 | $1.59 | 6d | 1 | 1.25mi |
| 4157 Attleboro Ct Saint Charles, MO | 4.0 | 3.0 | 1382 | $2,450 | $1.77 | 0d | 1 | 1.40mi |
Listing history 4 events
-
2026-06-21days on market $275,000 Active 3 DOM
-
2026-06-19statusdays on market $275,000 Active 1 DOM
-
2026-06-18days on market $275,000 Coming Soon 2 DOM
-
2026-06-17$275,000 Coming Soon 1 DOM
ⓘ Source: listings_history table (triggers on properties + properties_extension) + one-shot
backfill from property_details.listing_events for pre-trigger history.
Tax reassessment forecast MO · Resets to sale price
- Current annual tax
- $2,432 · $203/mo
- Projected year-2 tax
- $2,668 · $222/mo
- Expected delta
- +$235/yr (+$20/mo · 9.7%)
ⓘ Screening estimate from a state-policy table — verify with the county assessor before closing.
Climate risk First Street
- Flood 1/10 Low FEMA zone X (unshaded) · 0% chance over 30 yrs
- Wildfire 1/10 Low
- Heat 5/10 Major 7 d/yr ≥108°F today · 20 d/yr by 30 yrs out
- Wind 2/10 Low 100% chance of damaging wind over 30 yrs
- Air quality 2/10 Low 2 unhealthy d/yr today · 2 by 30 yrs out
Nearby sold comps map
Loading sold comps map…
Walkable amenities ~0.75 mi
Loading nearby amenities…
Taxation est. · year 1
- Rental income
- $27,153
- − Mortgage interest
- −$15,404
- − Property taxes
- −$2,432
- − Insurance
- −$1,375
- − Repairs & maintenance
- −$2,172
- − Management
- −$2,172
- − Depreciation
- −$8,000
- Taxable loss
- −$4,403
- Est. tax savings @ 24.0%
- +$1,057
- After-tax cash flow
- $1,395/yr
For passive investors: Depreciation is non-cash, so a rental often shows a tax loss while cash-flowing — sheltering income. Rental losses are passive: they offset passive income freely, and up to $25,000/yr can offset ordinary (W-2) income if you actively participate and your MAGI is under $100k (phasing out to $0 by $150k); unused losses carry forward. On sale, claimed depreciation is recaptured at up to 25%, and gains may owe capital-gains tax (a 1031 exchange can defer both). Figures are a year-1 estimate at your 24.0% rate — not tax advice; consult a CPA.
Schools (NCES district)
- District
- Francis Howell R-III
- NCES district ID
- 2928950
- Math proficiency
- 53% ▼ -12.00%
- Reading proficiency
- 63% ▼ -5.00%
- Median HH income
- $79,768
- Composite
- 52.23/100
- National rank
- #1602
- State rank
- #11 of 324 in MO
Livability — St. Peters
No livability data for this city. (Only ~50 U.S. cities are tracked.)
Census & demographics
- County
- Saint Charles County · 399,703 people
- City population
- 74,876
- Metro
- St. Louis, MO-IL
- Population (ZIP)
- 46,089
- Household income
- $99,138
- Rent vs Own
- Severe rent burden
- 1026.0
Population outlook (St. Charles County) Hauer SSP2
- Today (2025)
- 437,857 people
- By 2030
- 461,707 · +5.4%
- By 2040
- 503,222 · +14.9%
- By 2050
- 534,684 · +22.1%
- By 2075
- 597,047 · +36.4%
- By 2100
- 609,682 · +39.2%
Race, ethnicity, and origin ACS 2023
- Neighborhood character
- Predominantly White (79%)
- Race & ethnicity
- White 79% Black 6% Asian 6% Two or more races 6% Hispanic / Latino 5%
- Common ancestry
- Lithuanian 3% Romanian 3% Slovak 2%
- Foreign-born
- 7% · Canada, China, South Korea
- Languages at home
- 91% English-only · Spanish 3% Other Indo-European 1% Other Asian/Pacific 1%
Political lean MEDSL · St. Charles
- 2024 margin
- R (+17.0) · D 40.8% · R 57.8% · Other 1.4%
- 2008→2024 swing
- -7.2pp toward R · 2008: -9.7pp · 2024: -17.0pp
- All cycles
- 2024: R+17.0 2020: R+17.5 2016: R+26.4 2012: R+21.0 2008: R+9.7
Not yet ingested
- Civics
- —
Market trends
- HPI YoY
- ▼ -260.84%
- Current HPI
- 224.7406
- Rent YoY
- ▲ 3.27%
- Metro
- St. Louis, MO-IL
- State GDP YoY
- ▲ 1.84%
- F500 in state
- 20
Industry mix (Fortune 500 HQ in MO)
| Industry | F500 HQs | Revenue |
|---|---|---|
| Healthcare | 1 | $163B |
|
||
| Insurance | 1 | $21B |
|
||
| Industrial Technology | 1 | $17B |
|
||
| Retail | 1 | $16B |
|
||
| Industrial Distribution | 1 | $10B |
|
||
| Utilities | 1 | $9B |
|
||
Price history
+406.9% since first listed10 events — show timeline
- 2026-06-16 Coming Soon $275,000 MARIS as Distributed by MLS Grid
- 2020-10-01 Sold (Public Records) $185,000 Public Records
- 2020-09-23 Sold (MLS) — MARIS as Distributed by MLS Grid
- 2020-08-21 Pending — MARIS as Distributed by MLS Grid
- 2020-08-20 Price Changed $185,000 MARIS as Distributed by MLS Grid
- 2020-08-14 Listed $195,000 MARIS as Distributed by MLS Grid
- 2006-06-01 Sold (Public Records) $139,900 Public Records
- 2003-05-27 Sold (Public Records) $103,250 Public Records
- 1987-02-01 Sold (Public Records) $54,250 Public Records
- 1987-02-01 Sold (Public Records) $54,250 Public Records
Property tax history
+4.6%/yrLatest (2025): $2,432 · -1.1% YoY. Source: county tax records.
Cash-flow waterfall
monthlySold comps — $/sqft
last 12 mo · ≤1 miLoading sold comps…