 🔨 Auction
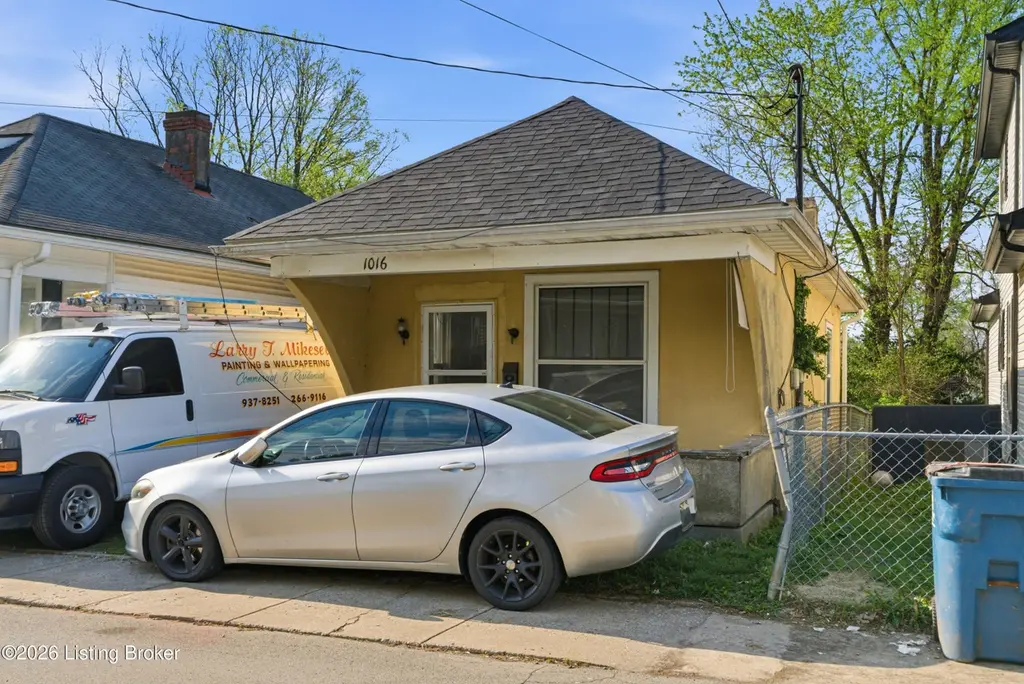
1016 High St · Shelbyville, KY
Flood risk 1/10 · Minimal
- FEMA flood zone
- X (unshaded)
- Chance of flooding over 30 yrs
- 0.0%
- Est. flood insurance / yr
- $473 – $860
Fire risk 1/10 · Minimal
- Est. fire insurance / yr
- $839 – $1,559
Heat risk 5/10 · Moderate
- Hot days now (above 104°F)
- 7 days/yr
- Hot days in 30 yrs
- 19 days/yr
Wind risk 2/10 · Minimal
- Chance of severe wind over 30 yrs
- 1.0%
Air-quality risk 2/10 · Minimal
- Unhealthy air days now
- 1 days/yr
- Unhealthy air days in 30 yrs
- 2 days/yr
Risk factors via First Street. Map © Google.
Why this score? — see what drove the F grade
The composite is a weighted blend of 9 inputs, each scored 0–100. Each bar is that input's sub-score; the figure is the points it added to the 100-point composite (weight × sub-score).
- ARV discount +7.5/15.0
- Cash flow +5.0/30.0
- Livability +3.8/5.0
- Schools +2.8/10.0
- Rent growth +2.5/5.0
- Condition / age +2.2/5.0
- 1% rule +0.8/10.0
- DSCR +0.0/10.0
- Appreciation +0.0/10.0
$1
🖨 Deal sheet (PDF) 📄 Offer letter ✓ Due diligence
Listing remarks MLS
Public auction May 9th,2026 At Shelby County Fair Grounds in the Floral Hall. Open house will be April 19th, 2026, from 2 to 4 PM. This home has new paint, new floor covering, Shingles replaced in 2025 Home is vacant. Age and lot size are estimated,
Key facts
- 0.25 acre lot
- Built 1976
- Listed 34 days
Neighborhood map
What this means for you Summary
Snapshot
- This is a 1-bed/1.0-bath single-family listed at $1. Condition is rated fair.
Deal economics
- At list price, monthly cash flow is $-487 ($-6k/yr) — negative.
- The deal already cash-flows at list — no discount required.
- Meets the 1% rule at list price ($1k rent vs $1).
Location & tenants
- Location reads 75/100 on livability (#101 in KY, #4,143 nationally) — a middle-class / working-renter tenant base. Strengths: cost of living A+, housing A+, crime A; Watch: schools D, amenities F, commute F.
- Shelby County (town): math 26% / reading 37% proficiency, ranked #77 of 165 in KY (top 47%) — families likely to look elsewhere, expect single-tenant / working-renter base with shorter leases.
- Market conditions: 292 active listings in the ZIP; 5 comparable units currently listed for rent nearby; rentals at typical pace (median 18d on market — plan ~3-4 weeks tenant-placement turnaround); solid renter incomes; 237 units permitted in Shelby County in 2024 (0 in 5+ unit buildings).
Forward outlook
- Local home prices are declining (-3.0%/yr); year-one equity from $1k of loan paydown is wiped out by about $6k of value loss. Plan a longer hold.
- Shelby County population projected at +34% by 2050 — long-run rental-demand tailwind backs the buy-and-hold thesis.
Negotiation context
- It's been on market 34 days — a 3% lower offer ($0) is reasonable based on typical stale-listing flexibility.
- 2 sale attempts since 17y ago with the ask held roughly flat each time — persistent listings suggest the price (not the market) is what's stuck; bring a comps-based counter.
Risks & watch-outs
- Watch-outs: property tax is 309978.1% of price.
- Climate carrying-cost: extreme-heat days projected 7→19/yr by 2055 (HVAC capex compounding) — expect insurance premiums to compound above CPI over the hold.
Questions for the listing agent
- What do current leases actually rent for vs. the listed asking? Can we see a recent rent roll and the last 12 months of T-12 income?
- It's been on market 34 days. Have you received any prior offers? Is the seller open to a 5% concession, seller financing, or rate buy-down credit?
- Have any recent inspections been done? Can we get a copy of the seller's disclosures and any deferred-maintenance estimates?
- Built in 1976 — when were the roof, HVAC, electrical panel, plumbing, and water heater last replaced?
- Property tax is high relative to price — has the assessment been appealed recently, and will the sale trigger a re-assessment?
- Is there a deadline driving the sale (1031 exchange, divorce, estate, relocation)? That informs how much negotiation room exists.
- Schools are D-rated, which usually means shorter tenancies and higher turnover. Who's the typical renter profile here, and what's been the actual vacancy rate?
- The area grade is low — what's the realistic commute time and amenity access for the typical tenant pool here? Any planned neighborhood developments (good or bad) we should know about?
- What's the average days-on-market for RENTAL listings here right now (not sales)? A rising rental-DOM trend means longer vacancies and softer asking-rent achievability than the comps imply.
- What's the recent tenant-quality profile in this submarket — average credit score on applications, eviction rate, late-payment / NSF rate, and stable-employment percentage? A property-management company in the area should have these aggregated.
- How much new for-sale + rental construction is in the pipeline within 1–3 miles? Heavy new supply typically softens prices + rents 12–24 months out; constrained supply supports both.
Investment metrics
- 1% rule
- 0.58% ✗
- Cap rate
- 3.47%
- Cash-on-cash
- -10.10%
- DSCR
- 0.55
- GRM
- 14.5
CMA / ARV
- ARV (median comp)
- $206,652
- List price
- $1
- Delta
- -100.00%
- Verdict
- UNDERPRICED
- Comps
- 20 within 1.0 mi
Show comp detail 7 sales within ~0.75 mi
| Address | Dist | Beds/Ba | Sqft | Sold | Price | $/sf | Match |
|---|---|---|---|---|---|---|---|
| 112 Ada Ave | 0.47mi | 2/1.0 (+1) | 1,215 (-4%) | 18mo | $150,000 | $123 | 51 |
| 1030 Main St | 0.21mi | 2/2.0 (+1) | 1,077 (-15%) | 10mo | $274,600 | $255 | 48 |
| 28 7th St | 0.40mi | 2/1.0 (+1) | 1,112 (-12%) | 11mo | $210,000 | $189 | 47 |
| 95 Smithfield Rd | 0.58mi | 2/1.0 (+1) | 1,376 (+8%) | 9mo | $154,000 | $112 | 46 |
| 1017 Horse Shoe Dr | 0.66mi | 2/2.0 (+1) | 1,200 (-5%) | 9mo | $234,000 | $195 | 44 |
| 1004 Brown Ave | 0.65mi | 2/2.0 (+1) | 1,315 (+4%) | 20mo | $213,000 | $162 | 38 |
| 1100 Brown Ave | 0.70mi | 2/1.0 (+1) | 1,155 (-9%) | 17mo | $148,000 | $128 | 34 |
Match score weights: distance 35% · size 25% · config 20% · recency 20%. Top-matched comps best support the ARV.
Projected returns pro-forma
-3.0% appreciation · 3.0% rent growth · sell at horizon
- IRR
- -34.5%
- Equity multiple
- -0.11×
- Total profit
- $-64,484
- Equity at exit
- $30,812
- IRR
- -44.2%
- Equity multiple
- -0.66×
- Total profit
- $-96,015
- Equity at exit
- $17,867
Cash invested: $57,863 (down + closing). Projections, not guarantees.
Landlord ↔ Tenant lean methodology
- Overall (STATE)
- 83 Strongly Landlord-Friendly
- State Kentucky
- 83 Strongly Landlord-Friendly · R+16
- County
- — inherits STATE
- City
- — inherits STATE
ZIP-level market 40065
- Active inventory
- 292
Monthly cashflow live
- Estimated rent
- $1,191 high interval (Pro) →
- Mortgage (P&I)
- −$1,084
- Tax est. 1.5%
- −$258 /mo · $3,100/yr
- Insurance
- −$86
- HOA
- −$0
- Vacancy / Maint / Mgmt
- −$250
- Net cashflow
- $-487
Break-even live
Sensitivity live
| Price | -10% $-344 | -5% $-416 | +0% $-487 | +5% $-558 | +10% $-630 |
|---|---|---|---|---|---|
| Rent | -10% $-581 | -5% $-534 | +0% $-487 | +5% $-440 | +10% $-393 |
| Rate | -1.0pp $-383 | -0.5pp $-434 | base $-487 | +0.5pp $-541 | +1.0pp $-595 |
UW: 25.0% down · 7.5% · 30yr · 1.5% tax · 5.0% vac · 8.0% maint · 8.0% mgmt
Financing live
Cash to close
- Down payment
- $51,663
- Closing costs
- $6,200
- Reserves months
- —
- Total cash needed
- —
Loan-product check · same deal, 3 products live
Conventional
25% down · 7.5% · 30yr
- Down + closing
- —
- Monthly P&I
- —
- Monthly cashflow
- —
- DSCR
- —
- Eligible?
- —
Personal DTI + credit; lowest rate.
DSCR
20% down · 8.5% · 30yr
- Down + closing
- —
- Monthly P&I
- —
- Monthly cashflow
- —
- DSCR
- —
- Eligible?
- —
No personal income docs; deal must DSCR.
Hard money
10% down · 12.0% · 12mo
- Down + closing
- —
- Monthly P&I
- —
- Monthly cashflow
- —
- DSCR
- —
- Eligible?
- —
Short-term bridge; refi at stabilization.
Rent comps 5 comps
| Address | Beds | Baths | Sqft | Rent | $/sqft | DOM | Units | Dist |
|---|---|---|---|---|---|---|---|---|
| 103 Martin Luther King Jr St Shelbyville, KY | 2.0 | 1.0 | 909 | $1,295 | $1.42 | 17d | 1 | 0.06mi |
| 113 Ada Ave Shelbyville, KY | 2.0 | 1.5 | 1008 | $1,025 | $1.02 | 44d | 1 | 0.46mi |
| 1569 Sanford Ln Shelbyville, KY | 1.0–2.0 | 1.0–2.0 | 1017 | $1,010 | $0.99 | 2d | 5 | 0.70mi |
| 149 Gray Hill Ct Shelbyville, KY | 2.0 | 1.5 | 1050 | $895 | $0.85 | 24d | 1 | 0.84mi |
| 874 Marian Village Dr Shelbyville, KY | 2.0–3.0 | 1.5–2.0 | 1015 | $1,095 | $1.08 | 2d | 4 | 1.09mi |
Listing history 4 events
-
2026-05-12status Pending 249-char remark
Show marketing remark (249 chars)
Public auction May 9th,2026 At Shelby County Fair Grounds in the Floral Hall. Open house will be April 19th, 2026, from 2 to 4 PM. This home has new paint, new floor covering, Shingles replaced in 2025 Home is vacant. Age and lot size are estimated,
-
2026-04-08$1 Active 249-char remark
Show marketing remark (249 chars)
Public auction May 9th,2026 At Shelby County Fair Grounds in the Floral Hall. Open house will be April 19th, 2026, from 2 to 4 PM. This home has new paint, new floor covering, Shingles replaced in 2025 Home is vacant. Age and lot size are estimated,
-
2010-09-25historical
-
2009-09-25$59,000
ⓘ Source: listings_history table (triggers on properties + properties_extension) + one-shot
backfill from property_details.listing_events for pre-trigger history.
Climate risk First Street
- Flood 1/10 Low FEMA zone X (unshaded) · 0% chance over 30 yrs
- Wildfire 1/10 Low
- Heat 5/10 Major 7 d/yr ≥104°F today · 19 d/yr by 30 yrs out
- Wind 2/10 Low 100% chance of damaging wind over 30 yrs
- Air quality 2/10 Low 1 unhealthy d/yr today · 2 by 30 yrs out
Nearby sold comps map
Loading sold comps map…
Walkable amenities ~0.75 mi
Loading nearby amenities…
Taxation est. · year 1
- Rental income
- $14,296
- − Mortgage interest
- −$11,576
- − Property taxes
- −$3,100
- − Insurance
- −$1,033
- − Repairs & maintenance
- −$1,144
- − Management
- −$1,144
- − Depreciation
- −$6,012
- Taxable loss
- −$9,712
- Est. tax savings @ 24.0%
- +$2,331
- After-tax cash flow
- $-3,513/yr
For passive investors: Depreciation is non-cash, so a rental often shows a tax loss while cash-flowing — sheltering income. Rental losses are passive: they offset passive income freely, and up to $25,000/yr can offset ordinary (W-2) income if you actively participate and your MAGI is under $100k (phasing out to $0 by $150k); unused losses carry forward. On sale, claimed depreciation is recaptured at up to 25%, and gains may owe capital-gains tax (a 1031 exchange can defer both). Figures are a year-1 estimate at your 24.0% rate — not tax advice; consult a CPA.
Condition & rehab AI · 10 photos
This home requires moderate renovations, including painting, new flooring, and window replacements, to improve its condition and value.
Repairs flagged
- Major Paint — Peeling paint on exterior
- Major Siding — Damaged siding
- Major Flooring — Needs replacement
- Major Interior walls — Paint peeling
- Minor Windows — Some appear old
Value-add opportunities
- Both Paint job — Fresh paint enhances curb appeal and interior
- Both New flooring — New flooring improves aesthetics and functionality
- Both Window replacements — New windows improve energy efficiency and appearance
Renovation cost estimate screening
| Repair item | Severity | Est. cost |
|---|---|---|
| Paint · Peeling paint on exterior | Major | $15,000–50,000 |
| Siding · Damaged siding | Major | $15,000–50,000 |
| Flooring · Needs replacement | Major | $15,000–50,000 |
| Interior walls · Paint peeling | Major | $15,000–50,000 |
| Windows · Some appear old | Minor | $500–3,000 |
| Total estimated repair cost · 5 items | $60,500–203,000 |
Value-add ROI direction
- Both Paint job — Fresh paint enhances curb appeal and interior ↑
- Both New flooring — New flooring improves aesthetics and functionality ↑
- Both Window replacements — New windows improve energy efficiency and appearance ↑
ⓘ Cost ranges are severity-bucket heuristics (US national rule-of-thumb). Get contractor quotes + a written scope before underwriting a rehab budget.
Schools (NCES district)
- District
- Shelby County
- NCES district ID
- 2105320
- Math proficiency
- 26% ▼ -10.00%
- Reading proficiency
- 37% ▼ -11.00%
- Median HH income
- $58,163
- Composite
- 28.19/100
- National rank
- #6809
- State rank
- #77 of 165 in KY
Livability — Shelbyville
- Score
- 75/100
- State rank
- #101
- US rank
- #4143
Category grades
Schools grade is shown separately in the Schools card above.
Census & demographics
- Census place
- Shelbyville, KY
- County
- Shelby County · 32,160 people
- City population
- 32,160
- Metro
- Louisville/Jefferson County, KY-IN
- Population (ZIP)
- 32,160
- Household income
- $77,869
- Rent vs Own
- Severe rent burden
- 655.0
Population outlook (Shelby County) Hauer SSP2
- Today (2025)
- 52,947 people
- By 2030
- 56,624 · +6.9%
- By 2040
- 63,983 · +20.8%
- By 2050
- 70,917 · +33.9%
- By 2075
- 87,345 · +65.0%
- By 2100
- 97,345 · +83.9%
Race, ethnicity, and origin ACS 2023
- Neighborhood character
- Predominantly White (74%)
- Race & ethnicity
- White 74% Hispanic / Latino 14% Two or more races 10% Black 6% Asian 1%
- Hispanic origin (detail)
- Mexican 7% Puerto Rican 1%
- Common ancestry
- Slovak 3% Serbian 2% Italian 2%
- Foreign-born
- 8% · Canada
- Languages at home
- 87% English-only · Spanish 11% Tagalog/Filipino 1% Other Asian/Pacific 1%
Political lean MEDSL · Shelby
- 2024 margin
- Solid R (+34.7) · D 31.8% · R 66.5% · Other 1.7%
- 2008→2024 swing
- -10.0pp toward R · 2008: -24.7pp · 2024: -34.7pp
- All cycles
- 2024: R+34.7 2020: R+29.6 2016: R+33.6 2012: R+27.6 2008: R+24.7
Not yet ingested
- Civics
- —
Market trends
- HPI YoY
- ▼ -144.73%
- Current HPI
- 177.2875
- Rent YoY
- —
- Metro
- Louisville/Jefferson County, KY-IN
- State GDP YoY
- ▲ 1.81%
- F500 in state
- 4
Industry mix (Fortune 500 HQ in KY)
| Industry | F500 HQs | Revenue |
|---|---|---|
| Healthcare | 1 | $118B |
|
||
| Food / Beverage | 1 | $7B |
|
||
Price history
4 events — show timeline
- 2026-05-12 Pending — Metro Search MLS
- 2026-04-08 Listed $1 Metro Search MLS
- 2010-09-25 Listing Removed — Metro Search MLS
- 2009-09-25 Listed $59,000 Metro Search MLS
Property tax history
+1.3%/yrLatest (2025): $253 · -0.9% YoY. Source: county tax records.
Cash-flow waterfall
monthlySold comps — $/sqft
last 12 mo · ≤1 miLoading sold comps…