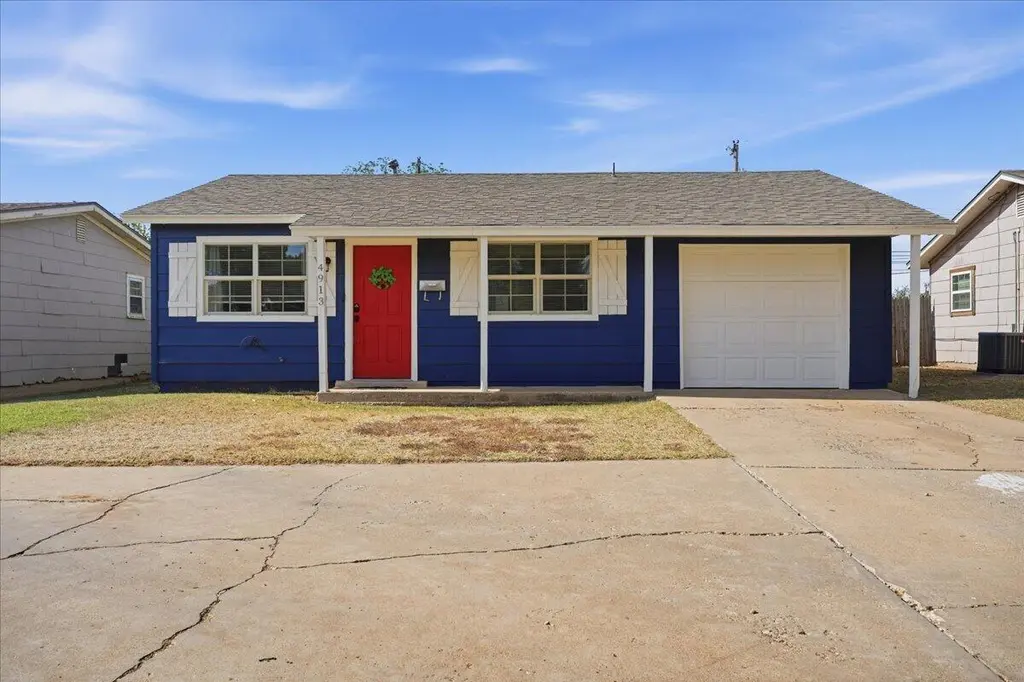
4913 39th St · Lubbock, TX
Flood risk 1/10 · Minimal
- FEMA flood zone
- X (unshaded)
- Chance of flooding over 30 yrs
- 0.0%
- Est. flood insurance / yr
- $507 – $1,088
Fire risk 1/10 · Minimal
- Est. fire insurance / yr
- $1,222 – $2,270
Heat risk 5/10 · Moderate
- Hot days now (above 99°F)
- 7 days/yr
- Hot days in 30 yrs
- 21 days/yr
Wind risk 2/10 · Minimal
- Chance of severe wind over 30 yrs
- —
Air-quality risk 2/10 · Minimal
- Unhealthy air days now
- 1 days/yr
- Unhealthy air days in 30 yrs
- 1 days/yr
Risk factors via First Street. Map © Google.
Why this score? — see what drove the D+ grade
The composite is a weighted blend of 9 inputs, each scored 0–100. Each bar is that input's sub-score; the figure is the points it added to the 100-point composite (weight × sub-score).
- ARV discount +13.9/15.0
- Cash flow +12.7/30.0
- Livability +4.0/5.0
- DSCR +3.8/10.0
- 1% rule +3.3/10.0
- Schools +3.1/10.0
- Rent growth +2.6/5.0
- Condition / age +2.5/5.0
- Appreciation +0.0/10.0
$139,000
🖨 Deal sheet 📄 Offer letter ✓ Due diligence
Listing remarks
Welcome home to this charming 3-bedroom, 1-bath house full of warmth and character. Featuring tile throughout the main living areas and kitchen and a welcoming atmosphere perfect for relaxing evenings and everyday living. Step outside to enjoy a spacious backyard; ideal for pets, gatherings, or simply enjoying your own private outdoor space. The front patio adds the perfect touch for morning coffee or unwinding after a long day. With its inviting feel and functional layout, this home is ready to create lasting memories.
Key facts
- Front patio
- Spacious backyard
- 6,625 sq ft lot
Tags
Property features AI
Exterior
- Parking: Attached garage with garage door opener; 1 garage space; Additional parking; Circular driveway; Concrete driveway
- Utilities: Public water; Public sewer; Electricity connected; Natural gas connected/available; Gas water heater
- Home design: Single-family residence; One story
- Construction: Wood siding; Composition roof; Slab foundation; Built as residential single family
- Exterior features: Private yard; Storage; Shed(s)
Interior
- Kitchen: Cooktop; Electric cooktop; Electric oven; Free-standing electric range; Dishwasher
- Bedrooms: Total of 6 rooms (bedrooms included in room count)
- Flooring: Carpet; Tile
- Bathrooms: 1 full bathroom
- Heating & cooling: Central heating (natural gas); Attic fan; Electric cooling; Ceiling fans
- Interior features: Ceiling fans; Crown molding; Pantry; Storage; Walk-in closets; Blinds/window coverings
- Laundry & utility: Washer hookup; Dryer hookup (electric); Inside laundry room
Neighborhood map
What this means for you Summary
Snapshot
- This is a 2-bed/1.0-bath single-family listed at $139k.
Deal economics
- At list price, monthly cash flow is $-15 ($-176/yr) — negative.
- To cash-flow at today's rent, offer at most $136k (1.9% below list).
- To meet the 1% rule (rent ≥ 1% of price), the offer needs to be $115k (17.1% below list).
- Recommended offer: $115k (17.1% below list) — sets the bar for 1% rule.
Location & tenants
- Location reads 80/100 on livability (#37 in TX, #1,749 nationally) — a professional / high-income tenant draw. Strengths: commute A+, cost of living A+, housing A+; Watch: employment C-, crime F.
- Lubbock ISD (urban): math 36% / reading 39% proficiency, ranked #481 of 826 in TX (top 58%) — families likely to look elsewhere, expect single-tenant / working-renter base with shorter leases; 60% free/reduced lunch — lower-income household profile, screen leases tightly.
- Zoned schools: Williams El (math 32% / reading 37%, grade F, #1,995 of 4,322 statewide, top 50%, 307 students, 76% FRL); Evans Middle (math 34% / reading 43%, grade F, #704 of 1,662 statewide, top 43%, 799 students, 58% FRL); Coronado H S (math 34% / reading 38%, grade F, #930 of 1,632 statewide, top 57%, 1,960 students, 66% FRL).
- Market conditions: Rents flat; 89 active listings in the ZIP; 40 comparable units currently listed for rent nearby; rentals at typical pace (median 21d on market — plan ~3-4 weeks tenant-placement turnaround); 2,219 units permitted in Lubbock County in 2024 (252 in 5+ unit buildings).
Forward outlook
- Local home prices are declining (-3.0%/yr); year-one equity from $961 of loan paydown is wiped out by about $4k of value loss. Plan a longer hold.
- Lubbock County population projected at +39% by 2050 — long-run rental-demand tailwind backs the buy-and-hold thesis.
Negotiation context
- Only 6 days on market — expect competitive offers; lowballing is unlikely to land.
Risks & watch-outs
- Climate carrying-cost: extreme-heat days projected 7→21/yr by 2055 (HVAC capex compounding) — expect insurance premiums to compound above CPI over the hold.
Questions for the listing agent
- What do current leases actually rent for vs. the listed asking? Can we see a recent rent roll and the last 12 months of T-12 income?
- Built in 1973 — when were the roof, HVAC, electrical panel, plumbing, and water heater last replaced?
- Is there a deadline driving the sale (1031 exchange, divorce, estate, relocation)? That informs how much negotiation room exists.
- Schools are D-rated, which usually means shorter tenancies and higher turnover. Who's the typical renter profile here, and what's been the actual vacancy rate?
- Crime grade is F in this area — have there been break-ins, vandalism, or insurance claims at this property in the last 3 years? What carrier currently insures it and at what premium?
- The area grade is low — what's the realistic commute time and amenity access for the typical tenant pool here? Any planned neighborhood developments (good or bad) we should know about?
- What's the average days-on-market for RENTAL listings here right now (not sales)? A rising rental-DOM trend means longer vacancies and softer asking-rent achievability than the comps imply.
- What's the recent tenant-quality profile in this submarket — average credit score on applications, eviction rate, late-payment / NSF rate, and stable-employment percentage? A property-management company in the area should have these aggregated.
- How much new for-sale + rental construction is in the pipeline within 1–3 miles? Heavy new supply typically softens prices + rents 12–24 months out; constrained supply supports both.
Investment metrics
- 1% rule
- 0.83% ✗
- Cap rate
- 6.17%
- Cash-on-cash
- -0.45%
- DSCR
- 0.98
- GRM
- 10.1
CMA / ARV
- ARV (median comp)
- $161,996
- List price
- $139,000
- Delta
- -14.20%
- Verdict
- UNDERPRICED
- Comps
- 1 within 2.0 mi
Projected returns pro-forma
-3.0% appreciation · 0.56% rent growth · sell at horizon
- IRR
- -19.7%
- Equity multiple
- 0.33×
- Total profit
- $-26,222
- Equity at exit
- $20,725
- IRR
- -18.5%
- Equity multiple
- 0.10×
- Total profit
- $-34,845
- Equity at exit
- $12,018
Cash invested: $38,920 (down + closing). Projections, not guarantees.
Landlord ↔ Tenant lean methodology
- Overall (STATE)
- 87 Strongly Landlord-Friendly
- State Texas
- 87 Strongly Landlord-Friendly · R+5
- County
- — inherits STATE
- City
- — inherits STATE
ZIP-level market 79414
- Home prices YoY
- -27.8%
- Rents YoY
- 0.6%
- Active inventory
- 89
- Price-to-rent
- 10.1×
Monthly cashflow live
- Estimated rent
- $1,152 high interval (Pro) →
- Mortgage (P&I)
- −$729
- Tax from tax record
- −$138 /mo · $1,658/yr
- Insurance
- −$58
- HOA
- −$0
- Vacancy / Maint / Mgmt
- −$242
- Net cashflow
- $-15
Break-even live
UW: 25.0% down · 7.5% · 30yr · 1.5% tax · 5.0% vac · 8.0% maint · 8.0% mgmt
Financing live
Cash to close
- Down payment
- $34,750
- Closing costs
- $4,170
- Reserves months
- —
- Total cash needed
- —
Loan-product check · same deal, 3 products live
Conventional
25% down · 7.5% · 30yr
- Down + closing
- —
- Monthly P&I
- —
- Monthly cashflow
- —
- DSCR
- —
- Eligible?
- —
Personal DTI + credit; lowest rate.
DSCR
20% down · 8.5% · 30yr
- Down + closing
- —
- Monthly P&I
- —
- Monthly cashflow
- —
- DSCR
- —
- Eligible?
- —
No personal income docs; deal must DSCR.
Hard money
10% down · 12.0% · 12mo
- Down + closing
- —
- Monthly P&I
- —
- Monthly cashflow
- —
- DSCR
- —
- Eligible?
- —
Short-term bridge; refi at stabilization.
Rent comps 40 comps
| Address | Beds | Baths | Sqft | Rent | $/sqft | DOM | Units | Dist |
|---|---|---|---|---|---|---|---|---|
| 4907 37th St Lubbock, TX | 3.0 | 1.0 | 1000 | $1,100 | $1.10 | 43d | 1 | 0.10mi |
| 4817 40th St Lubbock, TX | 3.0 | 2.0 | 1254 | $1,300 | $1.04 | 13d | 1 | 0.13mi |
| 4907 41st St Lubbock, TX | 3.0 | 2.0 | 1196 | $1,200 | $1.00 | 43d | 1 | 0.16mi |
| 4907 36th St Lubbock, TX | 2.0 | 1.0 | 1020 | $1,095 | $1.07 | 13d | 1 | 0.16mi |
| 4818 36th St Lubbock, TX | 3.0 | 2.0 | 1285 | $1,400 | $1.09 | 21d | 1 | 0.21mi |
| 4801 36th St Lubbock, TX | 3.0 | 2.0 | 1424 | $1,275 | $0.90 | 21d | 1 | 0.23mi |
| 5105 36th St Lubbock, TX | 2.0 | 1.0 | 788 | $900 | $1.14 | 21d | 1 | 0.27mi |
| 4815 43rd St Lubbock, TX | 3.0 | 2.0 | 1282 | $1,500 | $1.17 | 21d | 1 | 0.29mi |
| 5024 35th St Lubbock, TX | 3.0 | 2.0 | 1364 | $1,300 | $0.95 | 21d | 1 | 0.31mi |
| 4702 37th St Lubbock, TX | 3.0 | 1.0 | 900 | $1,150 | $1.28 | 13d | 1 | 0.32mi |
| 4803 43rd St Lubbock, TX | 3.0 | 2.0 | 1412 | $1,200 | $0.85 | 21d | 1 | 0.32mi |
| 5106 35th St Lubbock, TX | 2.0 | 1.0 | 840 | $900 | $1.07 | 21d | 1 | 0.33mi |
| 4819 44th St Lubbock, TX | 3.0 | 2.0 | 1412 | $1,300 | $0.92 | 43d | 1 | 0.35mi |
| 4707 42nd St Lubbock, TX | 3.0 | 1.0 | 1053 | $1,049 | $1.00 | 13d | 1 | 0.35mi |
| 4708 43rd St Lubbock, TX | 3.0 | 1.5 | 1249 | $1,350 | $1.08 | 43d | 1 | 0.37mi |
| 5101 44th St Lubbock, TX | 3.0 | 2.0 | 1160 | $1,350 | $1.16 | 21d | 1 | 0.40mi |
| 5214 38th St Lubbock, TX | 2.0 | 1.0 | 922 | $825 | $0.89 | 43d | 1 | 0.40mi |
| 5304 38th St Lubbock, TX | 2.0 | 1.0 | 922 | $825 | $0.89 | 43d | 1 | 0.42mi |
| 4619 43rd St Lubbock, TX | 3.0 | 1.0 | 1404 | $1,500 | $1.07 | 43d | 1 | 0.43mi |
| 5306 38th St Lubbock, TX | 2.0 | 1.0 | 922 | $825 | $0.89 | 43d | 1 | 0.44mi |
| 4916 46th St Lubbock, TX | 3.0 | 2.0 | 1377 | $1,450 | $1.05 | 13d | 1 | 0.44mi |
| 5002 46th St Lubbock, TX | 3.0 | 2.0 | 1369 | $1,450 | $1.06 | 43d | 1 | 0.44mi |
| 2902 Vicksburg Ave Lubbock, TX | 1.0–2.0 | 1.0 | 750 | $710 | $0.95 | 13d | 3 | 0.52mi |
| 3333 Toledo Ave Lubbock, TX | 2.0 | 1.0–1.5 | 924 | $741 | $0.80 | 13d | 7 | 0.53mi |
| 4926 48th St Lubbock, TX | 3.0 | 2.0 | 1354 | $1,500 | $1.11 | 21d | 1 | 0.56mi |
| 4510 35th St Unit A Lubbock, TX | 2.0 | 1.0 | 888 | $750 | $0.84 | 21d | 1 | 0.57mi |
| 4510 35th St Unit A Lubbock, TX | 2.0 | 1.0 | 888 | $750 | $0.84 | 43d | 1 | 0.57mi |
| 4430 33rd St Lubbock, TX | 3.0 | 2.0 | 1402 | $1,100 | $0.78 | 43d | 1 | 0.62mi |
| 4601 32nd St Lubbock, TX | 3.0 | 1.0 | 928 | $995 | $1.07 | 13d | 1 | 0.63mi |
| 4409 38th St Lubbock, TX | 3.0 | 1.5 | 1000 | $1,350 | $1.35 | 13d | 1 | 0.64mi |
| 4413 40th St Lubbock, TX | 3.0 | 1.0 | 1152 | $1,350 | $1.17 | 21d | 1 | 0.64mi |
| 5415 42nd St Lubbock, TX | 3.0 | 2.0 | 1417 | $1,450 | $1.02 | 21d | 1 | 0.69mi |
| 4602 50th St Lubbock, TX | 1.0–3.0 | 1.0–2.5 | 1080 | $1,043 | $0.97 | 13d | 9 | 0.70mi |
| 5302 48th St Lubbock, TX | 3.0 | 2.0 | 1368 | $1,450 | $1.06 | 21d | 1 | 0.70mi |
| 4425 31st St Unit Fs Lubbock, TX | 2.0 | 1.0 | 1000 | $899 | $0.90 | 21d | 1 | 0.70mi |
| 4705 Albany Ave Lubbock, TX | 2.0 | 2.0 | 926 | $742 | $0.80 | 13d | 5 | 0.71mi |
| 4423 31st St Unit 1 FS Lubbock, TX | 2.0 | 1.0 | 1024 | $885 | $0.86 | 21d | 1 | 0.71mi |
| 5406 36th St Lubbock, TX | 3.0 | 2.0 | 1400 | $695 | $0.50 | 43d | 1 | 0.76mi |
| 3506 Peoria Ave Unit B Lubbock, TX | 2.0 | 1.0 | 750 | $625 | $0.83 | 13d | 1 | 0.77mi |
| 5204 50th St Lubbock, TX | 2.0–3.0 | 2.0 | 1050 | $939 | $0.89 | 13d | 2 | 0.77mi |
Listing history 3 events
-
2026-05-15$139,000 Active 525-char remark
-
2023-04-11soldstatus
-
1990-05-01soldstatus
ⓘ Source: listings_history table (triggers on properties + properties_extension) + one-shot
backfill from property_details.listing_events for pre-trigger history.
Tax reassessment forecast TX · Resets to sale price
- Current annual tax
- $1,658 · $138/mo
- Projected year-2 tax
- $2,544 · $212/mo
- Expected delta
- +$886/yr (+$74/mo · 53.4%)
ⓘ Screening estimate from a state-policy table — verify with the county assessor before closing.
Climate risk First Street
- Flood 1/10 Low FEMA zone X (unshaded) · 0% chance over 30 yrs
- Wildfire 1/10 Low
- Heat 5/10 Major 7 d/yr ≥99°F today · 21 d/yr by 30 yrs out
- Wind 2/10 Low
- Air quality 2/10 Low 1 unhealthy d/yr today · 1 by 30 yrs out
Nearby sold comps map
Loading sold comps map…
Walkable amenities ~0.75 mi
Loading nearby amenities…
Taxation est. · year 1
- Rental income
- $13,829
- − Mortgage interest
- −$7,786
- − Property taxes
- −$1,658
- − Insurance
- −$695
- − Repairs & maintenance
- −$1,106
- − Management
- −$1,106
- − Depreciation
- −$4,044
- Taxable loss
- −$2,567
- Est. tax savings @ 24.0%
- +$616
- After-tax cash flow
- $440/yr
For passive investors: Depreciation is non-cash, so a rental often shows a tax loss while cash-flowing — sheltering income. Rental losses are passive: they offset passive income freely, and up to $25,000/yr can offset ordinary (W-2) income if you actively participate and your MAGI is under $100k (phasing out to $0 by $150k); unused losses carry forward. On sale, claimed depreciation is recaptured at up to 25%, and gains may owe capital-gains tax (a 1031 exchange can defer both). Figures are a year-1 estimate at your 24.0% rate — not tax advice; consult a CPA.
Schools (NCES district)
- District
- Lubbock ISD
- NCES district ID
- 4828500
- Math proficiency
- 36% ▼ -8.00%
- Reading proficiency
- 39% ▼ -1.00%
- Median HH income
- $39,820
- Composite
- 31.44/100
- National rank
- #5984
- State rank
- #481 of 826 in TX
Livability — Lubbock
- Score
- 80/100
- State rank
- #37
- US rank
- #1749
Category grades
Schools grade is shown separately in the Schools card above.
Census & demographics
- Census place
- Lubbock, TX
- County
- Lubbock County · 293,542 people
- City population
- 283,030
- Metro
- Lubbock, TX
- Population (ZIP)
- 17,596
- Household income
- $49,057
- Rent vs Own
- Severe rent burden
- 1330.0
Population outlook (Lubbock County) Hauer SSP2
- Today (2025)
- 345,960 people
- By 2030
- 371,449 · +7.4%
- By 2040
- 424,539 · +22.7%
- By 2050
- 481,150 · +39.1%
- By 2075
- 633,467 · +83.1%
- By 2100
- 746,853 · +115.9%
Race, ethnicity, and origin ACS 2023
- Neighborhood character
- Diverse neighborhood (Simpson 0.62)
- Race & ethnicity
- White 47% Hispanic / Latino 39% Two or more races 21% Black 9% Asian 1%
- Hispanic origin (detail)
- Mexican 30%
- Common ancestry
- Slovak 2% Serbian 1% Italian 1%
- Foreign-born
- 3% · Canada, China
- Languages at home
- 82% English-only · Spanish 16%
Political lean MEDSL · Lubbock
- 2024 margin
- Solid R (+39.5) · D 29.7% · R 69.2% · Other 1.0%
- 2008→2024 swing
- -2.8pp toward R · 2008: -36.7pp · 2024: -39.5pp
- All cycles
- 2024: R+39.5 2020: R+32.2 2016: R+38.4 2012: R+40.9 2008: R+36.7
Not yet ingested
- Civics
- —
Market trends
- HPI YoY
- ▼ -95.31%
- Current HPI
- 247.7963
- Rent YoY
- ▲ 0.56%
- Metro
- Lubbock, TX
- State GDP YoY
- ▲ 3.95%
- F500 in state
- 110
Industry mix (Fortune 500 HQ in TX)
| Industry | F500 HQs | Revenue |
|---|---|---|
| Energy | 16 | $1,198B |
|
||
| Technology | 5 | $198B |
|
||
| Engineering / Construction | 4 | $72B |
|
||
| Energy Services | 3 | $60B |
|
||
| Utilities | 3 | $41B |
|
||
| Healthcare | 2 | $330B |
|
||
Price history
4 events — show timeline
- 2026-05-22 Pending — LARMLS
- 2026-05-15 Listed $139,000 LARMLS
- 2023-04-11 Sold (Public Records) — Public Records
- 1990-05-01 Sold (Public Records) — Public Records
Property tax history
+7.3%/yrLatest (2025): $1,658 · -9.1% YoY. Source: county tax records.
Cash-flow waterfall
monthlySold comps — $/sqft
last 12 mo · ≤1 miLoading sold comps…