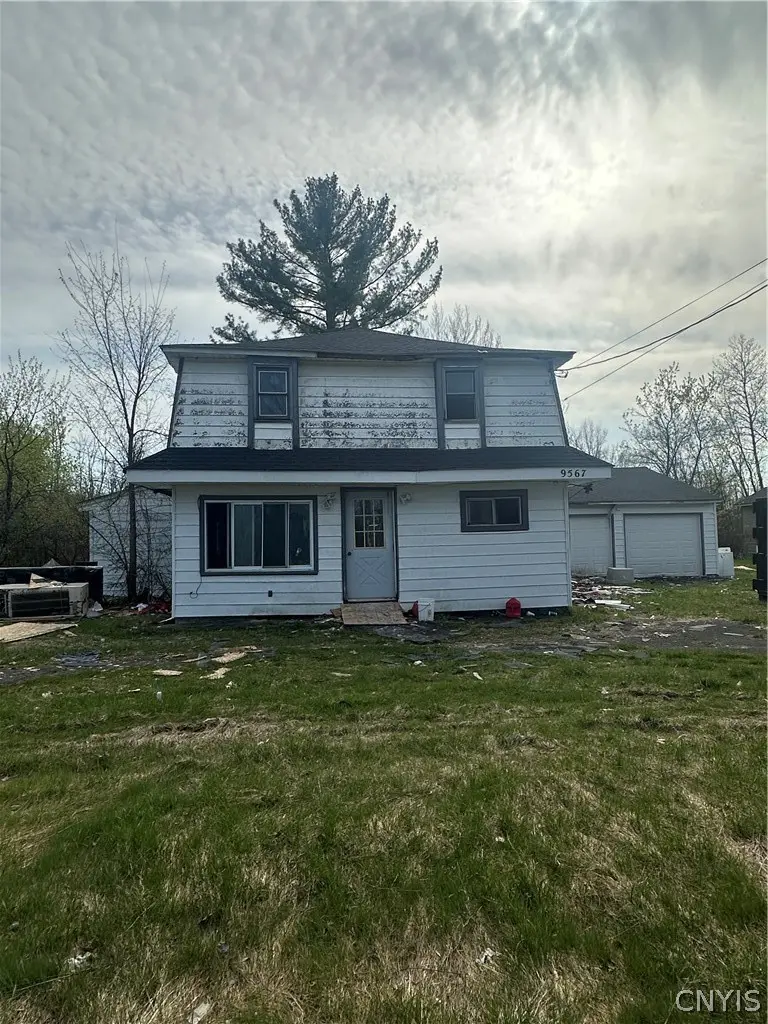
9567 Black Creek Rd · Sand Ridge, NY
Flood risk 1/10 · Minimal
- FEMA flood zone
- X (unshaded)
- Chance of flooding over 30 yrs
- 0.0%
- Est. flood insurance / yr
- $473 – $860
Fire risk 3/10 · Minor
- Est. fire insurance / yr
- $691 – $1,283
Heat risk 2/10 · Minimal
- Hot days now (above 95°F)
- 7 days/yr
- Hot days in 30 yrs
- 16 days/yr
Wind risk 1/10 · Minimal
- Chance of severe wind over 30 yrs
- 0.0%
Air-quality risk 2/10 · Minimal
- Unhealthy air days now
- 1 days/yr
- Unhealthy air days in 30 yrs
- 1 days/yr
Risk factors via First Street. Map © Google.
Why this score? — see what drove the B- grade
The composite is a weighted blend of 9 inputs, each scored 0–100. Each bar is that input's sub-score; the figure is the points it added to the 100-point composite (weight × sub-score).
- Cash flow +30.0/30.0
- 1% rule +10.0/10.0
- DSCR +10.0/10.0
- ARV discount +7.5/15.0
- Schools +3.5/10.0
- Livability +3.1/5.0
- Rent growth +2.5/5.0
- Condition / age +2.5/5.0
- Appreciation +0.0/10.0
$115,000
🖨 Deal sheet (PDF) 📄 Offer letter ✓ Due diligence
Listing remarks
9567 Black Creek Rd, Brewerton, NY 13029 Prime Investment Opportunity on 1 Acre – Minutes from Micron Site Unlock the potential of this rare value-add opportunity in a rapidly growing corridor of Central New York. Situated on a full 1-acre lot, this property offers the perfect canvas for investors, flippers, or developers looking to capitalize on the massive growth driven by the nearby Micron Technology development. The home has been taken down to the studs, providing a clean slate for a full renovation. A new roof is already in place, saving on one of the major capital expenses. The property does require extensive rehab, including foundation repair, making it ideal for experi
Key facts
- Future potential
- Full gut renovation
- 1 acre lot
Tags
Property features AI
Exterior
- Parking: Attached garage with 2 spaces
- Utilities: Well water; Septic tank
- Home design: Two-story existing structure; Vinyl siding exterior
- Construction: Vinyl siding construction; Existing property
- Exterior features: Dirt driveway; Rectangular residential lot (approximately 1.0044 acres, dimensions ~175 x 250); City street frontage
Interior
- Bathrooms: Two full bathrooms; One bathroom on the main level
- Heating & cooling: Heating: see remarks
- Interior features: Other features (see remarks)
Neighborhood map
What this means for you Summary
Snapshot
- This is a 3-bed/2.0-bath single-family listed at $115k.
Deal economics
- At list price, monthly cash flow is $732 ($9k/yr) — positive.
- The deal already cash-flows at list — no discount required.
- Meets the 1% rule at list price ($2k rent vs $115k).
- Recommended offer: $112k (3.0% below list) — sets the bar for market timing.
- Cap rate 13.9% vs local median 3.4% in Sand Ridge — top-decile yield for the area; either an underpriced asset or a hidden risk that comps aren't pricing in. Stress-test before assuming the spread holds.
Location & tenants
- Location reads 61/100 on livability (#926 in NY) — a middle-class / working-renter tenant base. Strengths: housing A+, cost of living A, crime A-; Watch: employment D+, amenities F, commute F.
- Central Square Central School District (suburban): math 40% / reading 40% proficiency, ranked #507 of 590 in NY (top 86%) — families likely to look elsewhere, expect single-tenant / working-renter base with shorter leases.
- Zoned schools: Brewerton Elementary School (math 42% / reading 52%, grade D-, #1,195 of 2,108 statewide, top 60%, 375 students, 36% FRL); Central Square Middle School (math 19% / reading 35%, grade F, #587 of 729 statewide, top 81%, 833 students, 45% FRL); Paul V Moore High School (math 91% / reading 75%, grade A, #440 of 1,100 statewide, top 40%, 1,101 students, 44% FRL).
- Zoned-school proficiency averages 52% at this address vs 40% district-wide (+12 pts) — the actual schools serving this property are materially stronger than the Central Square Central School District average implies; a family-tenant draw the district grade alone would hide.
- Market conditions: 36 active listings in the ZIP; 616 units permitted in Onondaga County in 2024 (256 in 5+ unit buildings).
Forward outlook
- Local home prices are declining (-3.0%/yr); year-one equity from $795 of loan paydown is wiped out by about $3k of value loss. Plan a longer hold.
- Onondaga County population projected to shrink 9% by 2050 — rents likely to lag national; underwrite the cash flow, not the appreciation.
- At projected returns (-3.0% appreciation + 3.0% rent growth), your $32k cash investment doubles in ~5 years — after that, you're playing with house money.
Negotiation context
- It's been on market 56 days — a 3% lower offer ($112k) is reasonable based on typical stale-listing flexibility.
- 3 sale attempts since 12y ago with the ask held roughly flat each time — persistent listings suggest the price (not the market) is what's stuck; bring a comps-based counter.
- Current owner paid $16k; list at $115k implies a 597% gain — meaningful room to come down on a strong offer.
Risks & watch-outs
- Watch-outs: built in 1938 — expect roof / HVAC / electrical / plumbing capex.
Questions for the listing agent
- It's been on market 56 days. Have you received any prior offers? Is the seller open to a 3% concession, seller financing, or rate buy-down credit?
- Built in 1938 — when were the roof, HVAC, electrical panel, plumbing, and water heater last replaced?
- Is there a deadline driving the sale (1031 exchange, divorce, estate, relocation)? That informs how much negotiation room exists.
- Schools are F-rated, which usually means shorter tenancies and higher turnover. Who's the typical renter profile here, and what's been the actual vacancy rate?
- What's the average days-on-market for RENTAL listings here right now (not sales)? A rising rental-DOM trend means longer vacancies and softer asking-rent achievability than the comps imply.
- What's the recent tenant-quality profile in this submarket — average credit score on applications, eviction rate, late-payment / NSF rate, and stable-employment percentage? A property-management company in the area should have these aggregated.
- How much new for-sale + rental construction is in the pipeline within 1–3 miles? Heavy new supply typically softens prices + rents 12–24 months out; constrained supply supports both.
Investment metrics
- 1% rule
- 1.71% ✓
- Cap rate
- 13.93%
- Cash-on-cash
- 27.28%
- DSCR
- 2.21
- GRM
- 4.9
CMA / ARV
- ARV (median comp)
- $540,304
- List price
- $115,000
- Delta
- -78.72%
- Verdict
- UNDERPRICED
- Comps
- 7 within 1.0 mi
Show comp detail 1 sale within ~0.75 mi
| Address | Dist | Beds/Ba | Sqft | Sold | Price | $/sf | Match |
|---|---|---|---|---|---|---|---|
| 9517 Caughdenoy Rd | 0.35mi | 3/1.5 | 2,112 (-1%) | 24mo | $225,000 | $107 | 60 |
Match score weights: distance 35% · size 25% · config 20% · recency 20%. Top-matched comps best support the ARV.
Projected returns pro-forma
-3.0% appreciation · 3.0% rent growth · sell at horizon
- IRR
- 21.3%
- Equity multiple
- 1.87×
- Total profit
- $28,029
- Equity at exit
- $17,147
- IRR
- 29.4%
- Equity multiple
- 3.63×
- Total profit
- $84,622
- Equity at exit
- $9,943
Cash invested: $32,200 (down + closing). Projections, not guarantees.
Landlord ↔ Tenant lean methodology
- Overall (STATE)
- 15 Strongly Tenant-Friendly
- State New York
- 15 Strongly Tenant-Friendly · D+10
- County
- — inherits STATE
- City
- — inherits STATE
ZIP-level market 13029
- Home prices YoY
- -12.0%
- Active inventory
- 36
- Price-to-rent
- 4.9×
Monthly cashflow live
- Estimated rent
- $1,966 medium interval (Pro) →
- Mortgage (P&I)
- −$603
- Tax from tax record
- −$170 /mo · $2,045/yr
- Insurance
- −$48
- HOA
- −$0
- Vacancy / Maint / Mgmt
- −$413
- Net cashflow
- $732
Break-even live
Sensitivity live
| Price | -10% $797 | -5% $764 | +0% $732 | +5% $699 | +10% $667 |
|---|---|---|---|---|---|
| Rent | -10% $577 | -5% $654 | +0% $732 | +5% $810 | +10% $887 |
| Rate | -1.0pp $790 | -0.5pp $761 | base $732 | +0.5pp $702 | +1.0pp $672 |
UW: 25.0% down · 7.5% · 30yr · 1.5% tax · 5.0% vac · 8.0% maint · 8.0% mgmt
Financing live
Cash to close
- Down payment
- $28,750
- Closing costs
- $3,450
- Reserves months
- —
- Total cash needed
- —
Loan-product check · same deal, 3 products live
Conventional
25% down · 7.5% · 30yr
- Down + closing
- —
- Monthly P&I
- —
- Monthly cashflow
- —
- DSCR
- —
- Eligible?
- —
Personal DTI + credit; lowest rate.
DSCR
20% down · 8.5% · 30yr
- Down + closing
- —
- Monthly P&I
- —
- Monthly cashflow
- —
- DSCR
- —
- Eligible?
- —
No personal income docs; deal must DSCR.
Hard money
10% down · 12.0% · 12mo
- Down + closing
- —
- Monthly P&I
- —
- Monthly cashflow
- —
- DSCR
- —
- Eligible?
- —
Short-term bridge; refi at stabilization.
Listing history 26 events
-
2026-06-22days on market $115,000 Active 56 DOM
-
2026-06-21days on market $115,000 Active 55 DOM
-
2026-06-21days on market $115,000 Active 54 DOM
-
2026-06-18days on market $115,000 Active 52 DOM
-
2026-06-17days on market $115,000 Active 51 DOM
-
2026-06-16days on market $115,000 Active 50 DOM
-
2026-06-15days on market $115,000 Active 49 DOM
-
2026-06-13days on market $115,000 Active 47 DOM
-
2026-06-12days on market $115,000 Active 46 DOM
-
2026-06-09days on market $115,000 Active 43 DOM
-
2026-06-08days on market $115,000 Active 42 DOM
-
2026-06-07days on market $115,000 Active 41 DOM
-
2026-06-07days on market $115,000 Active 40 DOM
-
2026-06-04days on market $115,000 Active 37 DOM
-
2026-06-02days on market $115,000 Active 36 DOM
-
2026-06-01days on market $115,000 Active 35 DOM
-
2026-05-31days on market $115,000 Active 34 DOM
-
2026-04-26$115,000 Active 1287-char remark
-
2025-05-01status Pending
-
2025-05-01historical
-
2025-04-19price $69,900
-
2025-03-26price $74,900
-
2025-03-09$79,900 Active
-
2015-04-02soldstatus $16,500
-
2015-01-02historical
-
2014-06-19$29,900
ⓘ Source: listings_history table (triggers on properties + properties_extension) + one-shot
backfill from property_details.listing_events for pre-trigger history.
Tax reassessment forecast NY · Partial reset (capped growth)
- Current annual tax
- $2,045 · $170/mo
- Projected year-2 tax
- $2,045 · $170/mo
- Expected delta
- $0/yr ($0/mo · 0.0%)
ⓘ Screening estimate from a state-policy table — verify with the county assessor before closing.
Climate risk First Street
- Flood 1/10 Low FEMA zone X (unshaded) · 0% chance over 30 yrs
- Wildfire 3/10 Moderate
- Heat 2/10 Low 7 d/yr ≥95°F today · 16 d/yr by 30 yrs out
- Wind 1/10 Low 0% chance of damaging wind over 30 yrs
- Air quality 2/10 Low 1 unhealthy d/yr today · 1 by 30 yrs out
Nearby sold comps map
Loading sold comps map…
Walkable amenities ~0.75 mi
Loading nearby amenities…
Taxation est. · year 1
- Rental income
- $23,595
- − Mortgage interest
- −$6,442
- − Property taxes
- −$2,045
- − Insurance
- −$575
- − Repairs & maintenance
- −$1,888
- − Management
- −$1,888
- − Depreciation
- −$3,345
- Taxable income
- $7,413
- Est. tax owed @ 24.0%
- −$1,779
- After-tax cash flow
- $7,004/yr
For passive investors: Depreciation is non-cash, so a rental often shows a tax loss while cash-flowing — sheltering income. Rental losses are passive: they offset passive income freely, and up to $25,000/yr can offset ordinary (W-2) income if you actively participate and your MAGI is under $100k (phasing out to $0 by $150k); unused losses carry forward. On sale, claimed depreciation is recaptured at up to 25%, and gains may owe capital-gains tax (a 1031 exchange can defer both). Figures are a year-1 estimate at your 24.0% rate — not tax advice; consult a CPA.
Schools (NCES district)
- District
- Central Square Central School District
- NCES district ID
- 3606900
- Math proficiency
- 40% ▼ -18.00%
- Reading proficiency
- 40% ▼ -12.00%
- Median HH income
- $55,807
- Composite
- 35.05/100
- National rank
- #5035
- State rank
- #507 of 590 in NY
Livability — Sand Ridge
- Score
- 61/100
- State rank
- #926
- US rank
- #18073
Category grades
Schools grade is shown separately in the Schools card above.
Census & demographics
- Population (ZIP)
- 7,594
Population outlook (Onondaga County) Hauer SSP2
- Today (2025)
- 467,894 people
- By 2030
- 463,381 · -1.0%
- By 2040
- 447,697 · -4.3%
- By 2050
- 426,399 · -8.9%
- By 2075
- 373,661 · -20.1%
- By 2100
- 307,967 · -34.2%
Race, ethnicity, and origin ACS 2023
- Neighborhood character
- Predominantly White (90%)
- Race & ethnicity
- White 90% Two or more races 6% Black 2% Hispanic / Latino 1%
- Common ancestry
- Lithuanian 6% Romanian 4% Subsaharan African 2%
- Foreign-born
- 3% · Vietnam
- Languages at home
- 97% English-only · Russian/Polish/Slavic 1% Vietnamese 1%
Political lean MEDSL · Onondaga
- 2024 margin
- D (+17.3) · D 58.6% · R 41.4%
- 2008→2024 swing
- -3.0pp toward R · 2008: 20.3pp · 2024: 17.3pp
- All cycles
- 2024: D+17.3 2020: D+20.6 2016: D+12.8 2012: D+21.1 2008: D+20.3
Not yet ingested
- Civics
- —
Market trends
- HPI YoY
- ▼ -45.58%
- Current HPI
- 333.4803
- Rent YoY
- —
- Metro
- —
- State GDP YoY
- ▲ 2.60%
- F500 in state
- 92
Industry mix (Fortune 500 HQ in NY)
| Industry | F500 HQs | Revenue |
|---|---|---|
| Financial Services | 10 | $950B |
|
||
| Consumer Goods | 9 | $162B |
|
||
| Insurance | 4 | $225B |
|
||
| Telecommunications | 2 | $144B |
|
||
| Pharmaceuticals | 2 | $112B |
|
||
| Media / Entertainment | 2 | $69B |
|
||
Price history
+284.6% since first listed9 events — show timeline
- 2026-04-26 Listed $115,000 CNYIS
- 2025-05-01 Pending — UNYREIS
- 2025-05-01 Listing Removed — UNYREIS
- 2025-04-19 Price Changed $69,900 UNYREIS
- 2025-03-26 Price Changed $74,900 UNYREIS
- 2025-03-09 Listed $79,900 UNYREIS
- 2015-04-02 Sold (Public Records) $16,500 Public Records
- 2015-01-02 Listing Removed — CNYIS
- 2014-06-19 Listed $29,900 CNYIS
Property tax history
-4.1%/yrLatest (2025): $2,045 · +4.7% YoY. Source: county tax records.
Cash-flow waterfall
monthlySold comps — $/sqft
last 12 mo · ≤1 miLoading sold comps…