 6-Plex
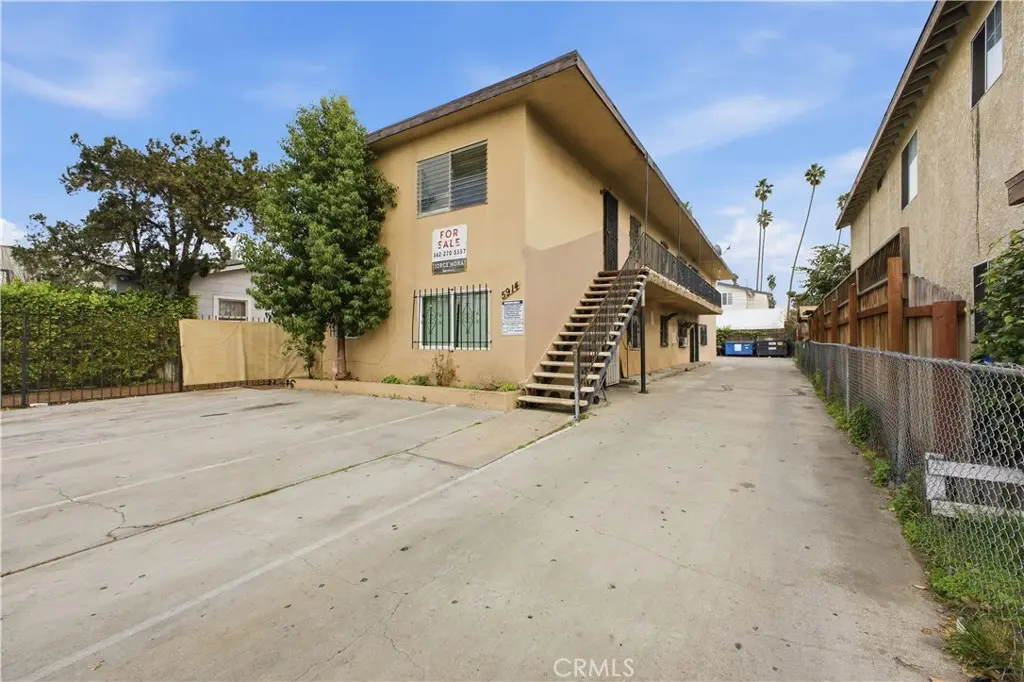
5914 S Hoover · Los Angeles, CA
Flood risk 1/10 · Minimal
- FEMA flood zone
- X (unshaded)
- Chance of flooding over 30 yrs
- 0.0%
- Est. flood insurance / yr
- $507 – $1,088
Fire risk 1/10 · Minimal
- Est. fire insurance / yr
- $659 – $1,223
Heat risk 5/10 · Moderate
- Hot days now (above 88°F)
- 7 days/yr
- Hot days in 30 yrs
- 21 days/yr
Wind risk 1/10 · Minimal
- Chance of severe wind over 30 yrs
- —
Air-quality risk 5/10 · Moderate
- Unhealthy air days now
- 7 days/yr
- Unhealthy air days in 30 yrs
- 7 days/yr
Risk factors via First Street. Map © Google.
Why this score? — see what drove the C- grade
The composite is a weighted blend of 9 inputs, each scored 0–100. Each bar is that input's sub-score; the figure is the points it added to the 100-point composite (weight × sub-score).
- Cash flow +26.0/30.0
- DSCR +8.8/10.0
- 1% rule +6.9/10.0
- Schools +3.6/10.0
- Livability +3.4/5.0
- Condition / age +2.5/5.0
- Rent growth +1.9/5.0
- ARV discount +0.0/15.0
- Appreciation +0.0/10.0
$1,100,000
🖨 Deal sheet 📄 Offer letter ✓ Due diligence
Multi-family units
County records classify this as Multi-Family (5+ Unit). Listing-text estimate: 6 units. confirmed
5+ unit building — per-unit beds/baths from public records are typically unavailable; the breakdown below (if shown) is an estimate from the listing text.
Listing remarks MLS
Excellent investment opportunity with this 6-unit multifamily property located at 5914 S Hoover Ave. The property features six well-designed units, each offering 2 bedrooms and 1 bathroom, along with one assigned parking space per unit — a major value add in the area. 1 unit potential for owner-occupants or investors looking to set market rent. The remaining units offer a solid layout ideal for long-term tenancy. Centrally located with close proximity to major freeways, Downtown Los Angeles, SoFi Stadium, and the Intuit Dome, making this a highly desirable rental location with strong demand. A great opportunity to acquire a stable income property in a prime Los Angeles location with upside potential.
Key facts
- Multifamily property
- Centrally located
- 4,733 sq ft lot
Tags
Neighborhood map
What this means for you Summary
Snapshot
- This is a 6 × 2-bed/1-bath units multifamily listed at $1.10M.
Deal economics
- At list price, monthly cash flow is $3k ($33k/yr) — positive. Per door: $459/mo.
- The deal already cash-flows at list — no discount required.
- Meets the 1% rule at list price ($13k rent vs $1.10M).
- Cap rate 9.3% vs local median 2.1% in Los Angeles — top-decile yield for the area; either an underpriced asset or a hidden risk that comps aren't pricing in. Stress-test before assuming the spread holds.
Location & tenants
- Location reads 68/100 on livability (#273 in CA) — a middle-class / working-renter tenant base. Strengths: amenities A+, commute A+, employment B; Watch: health & safety C-, schools D+, crime F.
- Los Angeles Unified (urban): math 29% / reading 54% proficiency, ranked #223 of 517 in CA (top 43%) — families likely to look elsewhere, expect single-tenant / working-renter base with shorter leases; 67% free/reduced lunch — lower-income household profile, screen leases tightly.
- Market conditions: Rents soft (-2.5%/yr); 172 active listings in the ZIP; 19,697 units permitted in Los Angeles County in 2024 (9,426 in 5+ unit buildings).
- At $13,069/mo this rent would consume 294% of the median local household income ($53k/yr) (locally 7490% of renters already pay >50% of income on rent) — very limited rent-growth headroom before tenants either downsize or default.
Forward outlook
- Local home prices are declining (-3.0%/yr); year-one equity from $8k of loan paydown is wiped out by about $33k of value loss. Plan a longer hold.
- Los Angeles County population projected at +9% by 2050 — modest demand growth; plan on rents tracking national, not racing it.
Negotiation context
- Only 2 days on market — expect competitive offers; lowballing is unlikely to land.
- 7 sale attempts since 9y ago; this cycle's ask has dropped $150k (12%) from the opening price — seller is motivated, your offer sets the floor, not the list.
Risks & watch-outs
- Watch-outs: built in 1957 — expect roof / HVAC / electrical / plumbing capex.
- Climate carrying-cost: extreme-heat days projected 7→21/yr by 2055 (HVAC capex compounding) — expect insurance premiums to compound above CPI over the hold.
Questions for the listing agent
- Can we see the unit-by-unit rent roll, current vacancy, and any below-market leases? What's the average tenancy length?
- What capital expenditures (roof, boiler, parking lot, exteriors) have been made in the last 5 years, and what's planned in the next 2?
- Built in 1957 — when were the roof, HVAC, electrical panel, plumbing, and water heater last replaced?
- Is there a deadline driving the sale (1031 exchange, divorce, estate, relocation)? That informs how much negotiation room exists.
- Schools are D-rated, which usually means shorter tenancies and higher turnover. Who's the typical renter profile here, and what's been the actual vacancy rate?
- Crime grade is F in this area — have there been break-ins, vandalism, or insurance claims at this property in the last 3 years? What carrier currently insures it and at what premium?
- What's the average days-on-market for RENTAL listings here right now (not sales)? A rising rental-DOM trend means longer vacancies and softer asking-rent achievability than the comps imply.
- What's the recent tenant-quality profile in this submarket — average credit score on applications, eviction rate, late-payment / NSF rate, and stable-employment percentage? A property-management company in the area should have these aggregated.
- How much new apartment / multifamily construction is in the pipeline within 1–3 miles? Heavy new supply (>2% of stock underway) typically softens rents 12–24 months out; light construction supports rent growth.
Investment metrics
- 1% rule
- 1.19% ✓
- Cap rate
- 9.30%
- Cash-on-cash
- 10.73%
- DSCR
- 1.48
- GRM
- 7.0
CMA / ARV
- ARV (median comp)
- $869,523
- List price
- $1,100,000
- Delta
- 43.76%
- Verdict
- OVERPRICED
- Comps
- 20 within 1.0 mi
Show comp detail 3 sales within ~0.75 mi
| Address | Dist | Beds/Ba | Sqft | Sold | Price | $/sf | Match |
|---|---|---|---|---|---|---|---|
| 624 W 53rd St | 0.50mi | 12/6.0 | 3,715 (+8%) | 12mo | $1,400,000 | $377 | 53 |
| 609 W 54th St | 0.48mi | 12/6.0 | 3,715 (+8%) | 18mo | $1,325,000 | $357 | 50 |
| 822 W 60th St | 0.13mi | 13/9.0 (+1) | 2,957 (-14%) | 22mo | $900,000 | $304 | 35 |
Match score weights: distance 35% · size 25% · config 20% · recency 20%. Top-matched comps best support the ARV.
Projected returns pro-forma
-3.0% appreciation · 0.0% rent growth · sell at horizon
- IRR
- -3.7%
- Equity multiple
- 0.87×
- Total profit
- $-40,955
- Equity at exit
- $164,014
- IRR
- 2.3%
- Equity multiple
- 1.14×
- Total profit
- $42,918
- Equity at exit
- $95,108
Cash invested: $308,000 (down + closing). Projections, not guarantees.
Landlord ↔ Tenant lean methodology
- Overall (CITY)
- 0 Strongly Tenant-Friendly
- State California
- 18 Strongly Tenant-Friendly · D+13
- County
- — inherits STATE
- City Los Angeles
- 0 Strongly Tenant-Friendly · D+22
ZIP-level market 90044
- Rents YoY
- -2.5%
- Active inventory
- 172
- Price-to-rent
- 42.1×
Monthly cashflow live
- Estimated rent
- $13,069 high interval (Pro) →
- Mortgage (P&I)
- −$5,769
- Tax from tax record
- −$1,343 /mo · $16,122/yr
- Insurance
- −$458
- HOA
- −$0
- Vacancy / Maint / Mgmt
- −$2,744
- Net cashflow
- $2,754
Break-even live
6-unit breakdown (identical units grouped — click to expand)
| Units | Beds | Baths | Est. rent |
|---|---|---|---|
| 6× units | 2 | 1 | $13,068 |
| #1 | 2 | 1 | $2,178 |
| #2 | 2 | 1 | $2,178 |
| #3 | 2 | 1 | $2,178 |
| #4 | 2 | 1 | $2,178 |
| #5 | 2 | 1 | $2,178 |
| #6 | 2 | 1 | $2,178 |
| Total (6 units) | $13,069 | ||
UW: 25.0% down · 7.5% · 30yr · 1.5% tax · 5.0% vac · 8.0% maint · 8.0% mgmt
Financing live
Cash to close
- Down payment
- $275,000
- Closing costs
- $33,000
- Reserves months
- —
- Total cash needed
- —
Loan-product check · same deal, 3 products live
Conventional
25% down · 7.5% · 30yr
- Down + closing
- —
- Monthly P&I
- —
- Monthly cashflow
- —
- DSCR
- —
- Eligible?
- —
Personal DTI + credit; lowest rate.
DSCR
20% down · 8.5% · 30yr
- Down + closing
- —
- Monthly P&I
- —
- Monthly cashflow
- —
- DSCR
- —
- Eligible?
- —
No personal income docs; deal must DSCR.
Hard money
10% down · 12.0% · 12mo
- Down + closing
- —
- Monthly P&I
- —
- Monthly cashflow
- —
- DSCR
- —
- Eligible?
- —
Short-term bridge; refi at stabilization.
Listing history 35 events
-
2026-06-18days on market $1,100,000 Active 2 DOM
-
2026-06-17pricedays on market $1,100,000 Active 1 DOM
-
2026-06-09days on market $1,250,000 Active 131 DOM
-
2026-06-08days on market $1,250,000 Active 130 DOM
-
2026-06-07days on market $1,250,000 Active 129 DOM
-
2026-06-04days on market $1,250,000 Active 126 DOM
-
2026-06-03days on market $1,250,000 Active 125 DOM
-
2026-06-02days on market $1,250,000 Active 124 DOM
-
2026-06-01days on market $1,250,000 Active 123 DOM
-
2026-05-31days on market $1,250,000 Active 122 DOM
-
2026-01-29$1,250,000 Active 715-char remark
Show marketing remark (715 chars)
Excellent investment opportunity with this 6-unit multifamily property located at 5914 S Hoover Ave. The property features six well-designed units, each offering 2 bedrooms and 1 bathroom, along with one assigned parking space per unit — a major value add in the area. 1 unit potential for owner-occupants or investors looking to set market rent. The remaining units offer a solid layout ideal for long-term tenancy. Centrally located with close proximity to major freeways, Downtown Los Angeles, SoFi Stadium, and the Intuit Dome, making this a highly desirable rental location with strong demand. A great opportunity to acquire a stable income property in a prime Los Angeles location with upside potential.
-
2026-01-15historical $1,250,000 715-char remark
Show marketing remark (715 chars)
Excellent investment opportunity with this 6-unit multifamily property located at 5914 S Hoover Ave. The property features six well-designed units, each offering 2 bedrooms and 1 bathroom, along with one assigned parking space per unit — a major value add in the area. 1 unit potential for owner-occupants or investors looking to set market rent. The remaining units offer a solid layout ideal for long-term tenancy. Centrally located with close proximity to major freeways, Downtown Los Angeles, SoFi Stadium, and the Intuit Dome, making this a highly desirable rental location with strong demand. A great opportunity to acquire a stable income property in a prime Los Angeles location with upside potential.
-
2025-12-31historical
-
2025-09-20status Active
-
2025-09-19price $1,250,000
-
2025-06-21price $1,350,000
-
2025-02-28$1,450,000 Active
-
2022-03-31soldstatus $1,200,000 Closed Sale
-
2022-03-31soldstatus $1,200,000
-
2022-03-01status Pending Sale
-
2021-11-29price $1,270,000
-
2021-11-01$1,295,000 Active
-
2020-11-25soldstatus $1,055,000
-
2017-07-25historical
-
2017-07-17status Pending Sale
-
2017-06-28soldstatus $805,000 Closed Sale
-
2017-06-28soldstatus $805,000 Closed Sale
-
2017-06-28soldstatus $805,000
-
2017-06-27soldstatus $805,000
-
2017-05-27status Pending Sale
-
2017-05-27status Active
-
2017-05-19historical Hold Do Not Show
-
2017-05-17$707,888 Active
-
2017-05-16$707,888
-
1990-08-21soldstatus $275,000
ⓘ Source: listings_history table (triggers on properties + properties_extension) + one-shot
backfill from property_details.listing_events for pre-trigger history.
Tax reassessment forecast CA · Resets to sale price
- Current annual tax
- $16,122 · $1,343/mo
- Projected year-2 tax
- $16,122 · $1,343/mo
- Expected delta
- $0/yr ($0/mo · 0.0%)
ⓘ Screening estimate from a state-policy table — verify with the county assessor before closing.
Climate risk First Street
- Flood 1/10 Low FEMA zone X (unshaded) · 0% chance over 30 yrs
- Wildfire 1/10 Low
- Heat 5/10 Major 7 d/yr ≥88°F today · 21 d/yr by 30 yrs out
- Wind 1/10 Low
- Air quality 5/10 Major 7 unhealthy d/yr today · 7 by 30 yrs out
Nearby sold comps map
Loading sold comps map…
Walkable amenities ~0.75 mi
Loading nearby amenities…
Taxation est. · year 1
- Rental income
- $156,828
- − Mortgage interest
- −$61,617
- − Property taxes
- −$16,122
- − Insurance
- −$5,500
- − Repairs & maintenance
- −$12,546
- − Management
- −$12,546
- − Depreciation
- −$32,000
- Taxable income
- $16,497
- Est. tax owed @ 24.0%
- −$3,959
- After-tax cash flow
- $29,091/yr
For passive investors: Depreciation is non-cash, so a rental often shows a tax loss while cash-flowing — sheltering income. Rental losses are passive: they offset passive income freely, and up to $25,000/yr can offset ordinary (W-2) income if you actively participate and your MAGI is under $100k (phasing out to $0 by $150k); unused losses carry forward. On sale, claimed depreciation is recaptured at up to 25%, and gains may owe capital-gains tax (a 1031 exchange can defer both). Figures are a year-1 estimate at your 24.0% rate — not tax advice; consult a CPA.
Schools (NCES district)
- District
- Los Angeles Unified
- NCES district ID
- 0622710
- Math proficiency
- 29% ▼ -4.00%
- Reading proficiency
- 54% ▲ 10.00%
- Median HH income
- $50,403
- Composite
- 35.67/100
- National rank
- #4875
- State rank
- #223 of 517 in CA
Livability — Los Angeles
- Score
- 68/100
- State rank
- #273
- US rank
- #9237
Category grades
Schools grade is shown separately in the Schools card above.
Census & demographics
- Census place
- Los Angeles, CA
- County
- Los Angeles County · 9,444,647 people
- City population
- 3,838,149
- Metro
- Los Angeles-Long Beach-Anaheim, CA
- Population (ZIP)
- 94,830
- Household income
- $53,302
- Rent vs Own
- Severe rent burden
- 7490.0
Population outlook (Los Angeles County) Hauer SSP2
- Today (2025)
- 10,940,515 people
- By 2030
- 11,256,481 · +2.9%
- By 2040
- 11,729,929 · +7.2%
- By 2050
- 11,948,407 · +9.2%
- By 2075
- 11,818,114 · +8.0%
- By 2100
- 10,842,928 · -0.9%
Race, ethnicity, and origin ACS 2023
- Neighborhood character
- Predominantly Hispanic (67%)
- Race & ethnicity
- Hispanic / Latino 67% Black 29% Two or more races 23% White 1% Native American 1%
- Hispanic origin (detail)
- Mexican 39%
- Foreign-born
- 34% · Canada
- Languages at home
- 37% English-only · Spanish 62%
Political lean MEDSL · Los Angeles
- 2024 margin
- Solid D (+32.9) · D 64.8% · R 31.9% · Other 3.3%
- 2008→2024 swing
- -7.4pp toward R · 2008: 40.4pp · 2024: 32.9pp
- All cycles
- 2024: D+32.9 2020: D+44.2 2016: D+48.0 2012: D+40.0 2008: D+40.4
Not yet ingested
- Civics
- —
Market trends
- HPI YoY
- ▼ -691.99%
- Current HPI
- 467.9845
- Rent YoY
- ▼ -2.50%
- Metro
- Los Angeles-Long Beach-Anaheim, CA
- State GDP YoY
- ▲ 3.21%
- F500 in state
- 116
Industry mix (Fortune 500 HQ in CA)
| Industry | F500 HQs | Revenue |
|---|---|---|
| Technology | 27 | $1,492B |
|
||
| Financial Services | 3 | $174B |
|
||
| Retail | 3 | $44B |
|
||
| Insurance | 3 | $26B |
|
||
| Media / Entertainment | 2 | $115B |
|
||
| Pharmaceuticals / Biotech | 2 | $62B |
|
||
Price history
+354.5% since first listed25 events — show timeline
- 2026-01-29 Listed $1,250,000 CRMLS
- 2026-01-15 Coming Soon $1,250,000 CRMLS
- 2025-12-31 Listing Removed — CRMLS
- 2025-09-20 Relisted — CRMLS
- 2025-09-19 Price Changed $1,250,000 CRMLS
- 2025-06-21 Price Changed $1,350,000 CRMLS
- 2025-02-28 Listed $1,450,000 CRMLS
- 2022-03-31 Sold (Public Records) $1,200,000 Public Records
- 2022-03-31 Sold (MLS) $1,200,000 CRMLS
- 2022-03-01 Pending — CRMLS
- 2021-11-29 Price Changed $1,270,000 CRMLS
- 2021-11-01 Listed $1,295,000 CRMLS
- 2020-11-25 Sold (Public Records) $1,055,000 Public Records
- 2017-07-25 Listing Removed — CRMLS
- 2017-07-17 Pending — CRMLS
- 2017-06-28 Sold (MLS) $805,000 SDMLS
- 2017-06-28 Sold (MLS) $805,000 CRMLS
- 2017-06-28 Sold (MLS) $805,000 CRMLS
- 2017-06-27 Sold (Public Records) $805,000 Public Records
- 2017-05-27 Pending — CRMLS
- 2017-05-27 Relisted — CRMLS
- 2017-05-19 Delisted — CRMLS
- 2017-05-17 Listed $707,888 CRMLS
- 2017-05-16 Listed $707,888 SDMLS
- 1990-08-21 Sold (Public Records) $275,000 Public Records
Property tax history
+6.9%/yrLatest (2025): $16,122 · +1.2% YoY. Source: county tax records.
Cash-flow waterfall
monthlySold comps — $/sqft
last 12 mo · ≤1 miLoading sold comps…