 Duplex
1309A Pierce Rd · Nashville-Davidson metropolitan government (balance), TN
Flood risk 1/10 · Minimal
- FEMA flood zone
- X (unshaded)
- Chance of flooding over 30 yrs
- 0.0%
- Est. flood insurance / yr
- $507 – $1,088
Fire risk 1/10 · Minimal
- Est. fire insurance / yr
- $949 – $1,763
Heat risk 6/10 · Moderate
- Hot days now (above 106°F)
- 7 days/yr
- Hot days in 30 yrs
- 21 days/yr
Wind risk 4/10 · Minor
- Chance of severe wind over 30 yrs
- 8.0%
Air-quality risk 2/10 · Minimal
- Unhealthy air days now
- 1 days/yr
- Unhealthy air days in 30 yrs
- 3 days/yr
Risk factors via First Street. Map © Google.
Why this score? — see what drove the C- grade
The composite is a weighted blend of 9 inputs, each scored 0–100. Each bar is that input's sub-score; the figure is the points it added to the 100-point composite (weight × sub-score).
- Cash flow +21.5/30.0
- ARV discount +11.8/15.0
- DSCR +6.9/10.0
- 1% rule +5.4/10.0
- Livability +2.5/5.0
- Condition / age +2.5/5.0
- Rent growth +2.3/5.0
- Schools +1.4/10.0
- Appreciation +0.0/10.0
$275,000
🖨 Deal sheet 📄 Offer letter ✓ Due diligence
Multi-family units
County records classify this as Multi-Family (2-4 Unit). Listing-text estimate: 2 units. confirmed
Listing remarks
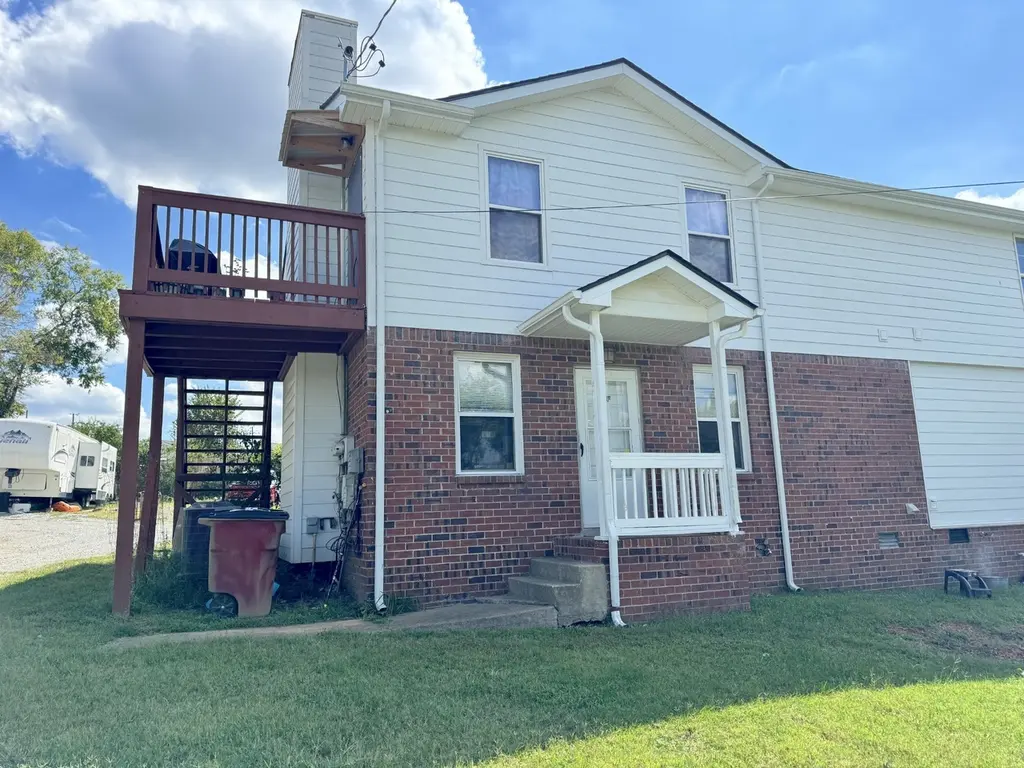
Renovated duplex in a great location in Madison with new hardy board siding, roof, decking, insulation and gutters (2024). Great looking. This duplex is part of a quad. The left side is for sale. 1309 A on the first floor. 1309B on the second floor. There is a really large front yard and parking in the rear. The interior is in good condition. The upstairs unit has brand new flooring, kitchen, appliances and renovated bathroom with a new double vanity. There is a nice view from the front of the units. The upstairs unit has deck with room for a barbecue and one can see really pretty trees in the distance. There are two newer water heaters, laundry hookups in each unit and a new stove and ref
Key facts
- Renovated duplex
- New decking
- New gutters
Tags
Property features AI
Finance
- Financial info: Gross income reported: $910; Net operating income reported: $910; Owner pays: none; Tenants pay electricity and water
Exterior
- Parking: 2 total parking spaces (2 open); No covered parking
- Security: Smoke detector(s)
- Utilities: Public water; Public sewer; Water available
- Home design: Duplex; Two levels; Attached property; Residential income property; Renovated
- Construction: Hardboard siding and brick exterior; Shingle roof
- Exterior features: Lot dimensions approximately 50 x 193
Interior
- Bedrooms: Two 2-bedroom units
- Flooring: Laminate
- Bathrooms: Each unit has 1 bathroom
- Heating & cooling: Central heating; Central air conditioning
- Interior features: Laminate flooring; Smoke detector(s)
- Laundry & utility: Individual laundry in units; Washer hookup; Electric dryer hookup
Neighborhood map
What this means for you Summary
Snapshot
- This is a 2 × 2-bed/1.0-bath units multifamily listed at $275k.
Deal economics
- At list price, monthly cash flow is $411 ($5k/yr) — positive. Per door: $206/mo.
- The deal already cash-flows at list — no discount required.
- Meets the 1% rule at list price ($3k rent vs $275k).
- Recommended offer: $267k (3.0% below list) — sets the bar for market timing.
- Cap rate 8.1% vs local median 2.9% in Nashville-Davidson metropolitan government (balance) — top-decile yield for the area; either an underpriced asset or a hidden risk that comps aren't pricing in. Stress-test before assuming the spread holds.
Location & tenants
- Location reads: area grade C — affects rentability + tenant quality, not the cash-flow math above.
- Davidson County (urban): math 12% / reading 19% proficiency, ranked #126 of 139 in TN (top 91%) — low school quality limits family demand, transient renter base, plan for 1-2y turnover; 66% free/reduced lunch — lower-income household profile, screen leases tightly.
- Zoned schools: Hunters Lane High (math 0% / reading 8%, grade F, #321 of 332 statewide, top 97%, 1,466 students, 0% FRL) — zoned schools average 0% FRL vs 66% district-wide (66 pts lower); this property's tenant base skews higher-income than the district average.
- Market conditions: Rents soft (-0.9%/yr); 330 active listings in the ZIP; 20 comparable units currently listed for rent nearby; rentals at typical pace (median 21d on market — plan ~3-4 weeks tenant-placement turnaround); 6,873 units permitted in Davidson County in 2024 (4,138 in 5+ unit buildings).
- At $2,855/mo this rent would consume 63% of the median local household income ($55k/yr) (locally 2759% of renters already pay >50% of income on rent) — very limited rent-growth headroom before tenants either downsize or default.
Forward outlook
- Local home prices are declining (-3.0%/yr); year-one equity from $2k of loan paydown is wiped out by about $8k of value loss. Plan a longer hold.
- Davidson County population projected at +42% by 2050 — long-run rental-demand tailwind backs the buy-and-hold thesis.
Negotiation context
- It's been on market 58 days — a 3% lower offer ($267k) is reasonable based on typical stale-listing flexibility.
- 5 sale attempts since 13y ago; this cycle's ask has dropped $19k (6%) from the opening price — seller is motivated, your offer sets the floor, not the list.
- Current owner paid $89k; list at $275k implies a 209% gain — meaningful room to come down on a strong offer.
Risks & watch-outs
- Climate carrying-cost: extreme-heat days projected 7→21/yr by 2055 (HVAC capex compounding) — expect insurance premiums to compound above CPI over the hold.
Questions for the listing agent
- It's been on market 58 days. Have you received any prior offers? Is the seller open to a 3% concession, seller financing, or rate buy-down credit?
- Can we see the unit-by-unit rent roll, current vacancy, and any below-market leases? What's the average tenancy length?
- What capital expenditures (roof, boiler, parking lot, exteriors) have been made in the last 5 years, and what's planned in the next 2?
- Is there a deadline driving the sale (1031 exchange, divorce, estate, relocation)? That informs how much negotiation room exists.
- What's the average days-on-market for RENTAL listings here right now (not sales)? A rising rental-DOM trend means longer vacancies and softer asking-rent achievability than the comps imply.
- What's the recent tenant-quality profile in this submarket — average credit score on applications, eviction rate, late-payment / NSF rate, and stable-employment percentage? A property-management company in the area should have these aggregated.
- How much new apartment / multifamily construction is in the pipeline within 1–3 miles? Heavy new supply (>2% of stock underway) typically softens rents 12–24 months out; light construction supports rent growth.
Investment metrics
- 1% rule
- 1.04% ✓
- Cap rate
- 8.09%
- Cash-on-cash
- 6.41%
- DSCR
- 1.29
- GRM
- 8.0
CMA / ARV
- ARV (on-the-fly)
- $303,912
- Comps found
- 2
Show comp detail 2 sales within ~0.75 mi
| Address | Dist | Beds/Ba | Sqft | Sold | Price | $/sf | Match |
|---|---|---|---|---|---|---|---|
| 127 Welworth St | 0.22mi | 4/2.0 | 1,608 (+6%) | 14mo | $324,000 | $201 | 68 |
| 501 Roosevelt Ave | 0.63mi | 4/— | 1,716 (+14%) | 9mo | $291,000 | $170 | 41 |
Match score weights: distance 35% · size 25% · config 20% · recency 20%. Top-matched comps best support the ARV.
Projected returns pro-forma
-3.0% appreciation · 0.0% rent growth · sell at horizon
- IRR
- -9.8%
- Equity multiple
- 0.65×
- Total profit
- $-26,728
- Equity at exit
- $41,003
- IRR
- -5.0%
- Equity multiple
- 0.72×
- Total profit
- $-21,848
- Equity at exit
- $23,777
Cash invested: $77,000 (down + closing). Projections, not guarantees.
Landlord ↔ Tenant lean methodology
- Overall (STATE)
- 87 Strongly Landlord-Friendly
- State Tennessee
- 87 Strongly Landlord-Friendly · R+13
- County
- — inherits STATE
- City
- — inherits STATE
ZIP-level market 37115
- Rents YoY
- -0.9%
- Active inventory
- 330
- Price-to-rent
- 16.1×
Monthly cashflow live
- Estimated rent
- $2,855 high interval (Pro) →
- Mortgage (P&I)
- −$1,442
- Tax from tax record
- −$287 /mo · $3,450/yr
- Insurance
- −$115
- HOA
- −$0
- Vacancy / Maint / Mgmt
- −$600
- Net cashflow
- $411
Break-even live
2-unit breakdown (identical units grouped — click to expand)
| Units | Beds | Baths | Est. rent |
|---|---|---|---|
| 2× units | 2 | 1 | $2,856 |
| #1 | 2 | 1 | $1,428 |
| #2 | 2 | 1 | $1,428 |
| Total (2 units) | $2,855 | ||
UW: 25.0% down · 7.5% · 30yr · 1.5% tax · 5.0% vac · 8.0% maint · 8.0% mgmt
Financing live
Cash to close
- Down payment
- $68,750
- Closing costs
- $8,250
- Reserves months
- —
- Total cash needed
- —
Loan-product check · same deal, 3 products live
Conventional
25% down · 7.5% · 30yr
- Down + closing
- —
- Monthly P&I
- —
- Monthly cashflow
- —
- DSCR
- —
- Eligible?
- —
Personal DTI + credit; lowest rate.
DSCR
20% down · 8.5% · 30yr
- Down + closing
- —
- Monthly P&I
- —
- Monthly cashflow
- —
- DSCR
- —
- Eligible?
- —
No personal income docs; deal must DSCR.
Hard money
10% down · 12.0% · 12mo
- Down + closing
- —
- Monthly P&I
- —
- Monthly cashflow
- —
- DSCR
- —
- Eligible?
- —
Short-term bridge; refi at stabilization.
Rent comps 20 comps
| Address | Beds | Baths | Sqft | Rent | $/sqft | DOM | Units | Dist |
|---|---|---|---|---|---|---|---|---|
| 1241 Pierce Rd Madison, TN | 5.0 | 2.0 | 1536 | $2,250 | $1.46 | 21d | 1 | 0.11mi |
| 115 Elmore Ave Madison, TN | 4.0 | 2.0 | 1548 | $2,195 | $1.42 | 23d | 1 | 0.13mi |
| 1401 Gallatin Pike N Madison, TN | 3.0 | 1.0–2.0 | 976 | $2,526 | $2.59 | 2d | 60 | 0.25mi |
| 110 One Mile Pkwy Madison, TN | 1.0–3.0 | 1.0–2.0 | 1018 | $1,927 | $1.89 | 3d | 35 | 0.34mi |
| 222 Old Amqui Rd Madison, TN | 4.0 | 3.5 | 2055 | $2,695 | $1.31 | 2d | 1 | 0.56mi |
| 222 Old Amqui Rd Madison, TN | 4.0 | 3.5 | 2055 | $2,700 | $1.31 | 23d | 1 | 0.56mi |
| 505 Roosevelt Ave Madison, TN | 4.0 | 1.5 | 1423 | $2,145 | $1.51 | 4d | 1 | 0.60mi |
| 298C Garner Ave Madison, TN | 4.0 | 2.0 | 1338 | $2,400 | $1.79 | 23d | 1 | 0.66mi |
| 100 Star Blvd Madison, TN | 2.0–3.0 | 2.0–2.5 | 1180 | $1,575 | $1.33 | 1d | 7 | 0.91mi |
| 1019 N Graycroft Ave Madison, TN | 3.0 | 1.0 | 1200 | $1,800 | $1.50 | 17d | 1 | 0.97mi |
| 436 Gates Rd Goodlettsville, TN | 4.0 | 2.0 | 1400 | $2,000 | $1.43 | 23d | 1 | 1.00mi |
| 708 N DuPont Ave Madison, TN | 3.0 | 2.5 | 1904 | $2,395 | $1.26 | 23d | 1 | 1.02mi |
| 345 Archwood Dr Madison, TN | 3.0 | 2.0 | 1162 | $2,000 | $1.72 | 23d | 1 | 1.09mi |
| 343 Archwood Dr Madison, TN | 3.0 | 2.0 | 1162 | $2,000 | $1.72 | 23d | 1 | 1.09mi |
| 857 Heritage Cir Madison, TN | 3.0 | 1.5 | 1056 | $1,900 | $1.80 | 23d | 1 | 1.12mi |
| 218B Myatt Dr Madison, TN | 3.0 | 3.5 | 1614 | $2,500 | $1.55 | 23d | 1 | 1.12mi |
| 1830 Spring Branch Dr Madison, TN | 2.0–3.0 | 2.0 | 1069 | $1,699 | $1.59 | 4d | 6 | 1.19mi |
| 255 Mayflower Ln N Madison, TN | 3.0 | 2.5 | 1472 | $1,795 | $1.22 | 1d | 1 | 1.21mi |
| 510 Heritage Dr Madison, TN | 1.0–3.0 | 1.0–2.5 | 1097 | $2,010 | $1.83 | 1d | 17 | 1.31mi |
| 30 Dry Creek Rd Goodlettsville, TN | 2.0–3.0 | 2.0 | 1206 | $1,605 | $1.33 | 1d | 11 | 1.44mi |
Listing history 32 events
-
2026-06-18days on market $275,000 Active 58 DOM
-
2026-06-17price $275,000 Active 57 DOM
-
2026-06-17days on market $285,000 Active 57 DOM
-
2026-06-16days on market $285,000 Active 56 DOM
-
2026-06-15days on market $285,000 Active 55 DOM
-
2026-06-13days on market $285,000 Active 53 DOM
-
2026-06-13days on market $285,000 Active 52 DOM
-
2026-06-09days on market $285,000 Active 49 DOM
-
2026-06-08days on market $285,000 Active 48 DOM
-
2026-06-07days on market $285,000 Active 47 DOM
-
2026-06-05days on market $285,000 Active 44 DOM
-
2026-06-03days on market $285,000 Active 43 DOM
-
2026-06-02days on market $285,000 Active 42 DOM
-
2026-06-01days on market $285,000 Active 41 DOM
-
2026-05-31days on market $285,000 Active 40 DOM
-
2026-04-21$294,000 Active
-
2026-04-16historical
-
2026-04-15price $294,000
-
2026-03-11$299,000 Active
-
2025-12-09historical
-
2025-11-12$309,000 Active
-
2025-11-12historical
-
2025-10-13historical
-
2025-10-01$309,000 Active
-
2014-03-18soldstatus $89,000
-
2014-03-12historical
-
2014-03-12soldstatus $170,800 Closed
-
2014-03-12soldstatus $170,800
-
2013-12-29$194,500
-
2007-04-24soldstatus $355,000
-
1997-06-17soldstatus $265,000
-
1983-10-24soldstatus $40,000
ⓘ Source: listings_history table (triggers on properties + properties_extension) + one-shot
backfill from property_details.listing_events for pre-trigger history.
Tax reassessment forecast TN · Resets to sale price
- Current annual tax
- $3,450 · $287/mo
- Projected year-2 tax
- $3,450 · $287/mo
- Expected delta
- $0/yr ($0/mo · 0.0%)
ⓘ Screening estimate from a state-policy table — verify with the county assessor before closing.
Climate risk First Street
- Flood 1/10 Low FEMA zone X (unshaded) · 0% chance over 30 yrs
- Wildfire 1/10 Low
- Heat 6/10 Major 7 d/yr ≥106°F today · 21 d/yr by 30 yrs out
- Wind 4/10 Moderate 8% chance of damaging wind over 30 yrs
- Air quality 2/10 Low 1 unhealthy d/yr today · 3 by 30 yrs out
Nearby sold comps map
Loading sold comps map…
Walkable amenities ~0.75 mi
Loading nearby amenities…
Taxation est. · year 1
- Rental income
- $34,260
- − Mortgage interest
- −$15,404
- − Property taxes
- −$3,450
- − Insurance
- −$1,375
- − Repairs & maintenance
- −$2,741
- − Management
- −$2,741
- − Depreciation
- −$8,000
- Taxable income
- $549
- Est. tax owed @ 24.0%
- −$132
- After-tax cash flow
- $4,803/yr
For passive investors: Depreciation is non-cash, so a rental often shows a tax loss while cash-flowing — sheltering income. Rental losses are passive: they offset passive income freely, and up to $25,000/yr can offset ordinary (W-2) income if you actively participate and your MAGI is under $100k (phasing out to $0 by $150k); unused losses carry forward. On sale, claimed depreciation is recaptured at up to 25%, and gains may owe capital-gains tax (a 1031 exchange can defer both). Figures are a year-1 estimate at your 24.0% rate — not tax advice; consult a CPA.
Schools (NCES district)
- District
- Davidson County
- NCES district ID
- 4703180
- Math proficiency
- 12% ▼ -17.00%
- Reading proficiency
- 19% ▼ -7.00%
- Median HH income
- $48,667
- Composite
- 14.03/100
- National rank
- #9472
- State rank
- #126 of 139 in TN
Livability — Nashville-Davidson metropolitan government (balance)
No livability data for this city. (Only ~50 U.S. cities are tracked.)
Census & demographics
- Census place
- Nashville-Davidson metropolitan government (balance), TN
- County
- Davidson County · 680,067 people
- City population
- 677,595
- Metro
- Nashville-Davidson--Murfreesboro--Franklin, TN
- Population (ZIP)
- 40,615
- Household income
- $54,566
- Rent vs Own
- Severe rent burden
- 2759.0
Population outlook (Davidson County) Hauer SSP2
- Today (2025)
- 808,568 people
- By 2030
- 874,489 · +8.2%
- By 2040
- 1,009,046 · +24.8%
- By 2050
- 1,147,294 · +41.9%
- By 2075
- 1,475,439 · +82.5%
- By 2100
- 1,714,101 · +112.0%
Race, ethnicity, and origin ACS 2023
- Neighborhood character
- Diverse neighborhood (Simpson 0.70)
- Race & ethnicity
- White 37% Black 32% Hispanic / Latino 26% Two or more races 12% Asian 2%
- Hispanic origin (detail)
- Mexican 13% Cuban 2%
- Common ancestry
- Serbian 1% Italian 1% Iranian 1%
- Foreign-born
- 18% · Canada
- Languages at home
- 74% English-only · Spanish 22% Tagalog/Filipino 1% Other Indo-European 1%
Political lean MEDSL · Davidson
- 2024 margin
- Strong D (+27.4) · D 62.7% · R 35.3% · Other 2.0%
- 2008→2024 swing
- +6.5pp toward D · 2008: 21.0pp · 2024: 27.4pp
- All cycles
- 2024: D+27.4 2020: D+32.1 2016: D+26.0 2012: D+18.7 2008: D+21.0
Not yet ingested
- Civics
- —
Market trends
- HPI YoY
- ▼ -259.74%
- Current HPI
- 341.9614
- Rent YoY
- ▼ -0.94%
- Metro
- Nashville-Davidson--Murfreesboro--Franklin, TN
- State GDP YoY
- ▲ 2.78%
- F500 in state
- 22
Industry mix (Fortune 500 HQ in TN)
| Industry | F500 HQs | Revenue |
|---|---|---|
| Healthcare | 3 | $91B |
|
||
| Retail | 3 | $72B |
|
||
| Transportation / Logistics | 1 | $88B |
|
||
| Paper / Packaging | 1 | $19B |
|
||
| Insurance | 1 | $13B |
|
||
| Energy | 1 | $12B |
|
||
Price history
+635.0% since first listed17 events — show timeline
- 2026-04-21 Listed $294,000 REALTRACS as Distributed by MLS Grid
- 2026-04-16 Listing Removed — REALTRACS as Distributed by MLS Grid
- 2026-04-15 Price Changed $294,000 REALTRACS as Distributed by MLS Grid
- 2026-03-11 Listed $299,000 REALTRACS as Distributed by MLS Grid
- 2025-12-09 Listing Removed — REALTRACS as Distributed by MLS Grid
- 2025-11-12 Listed $309,000 REALTRACS as Distributed by MLS Grid
- 2025-11-12 Coming Soon — REALTRACS as Distributed by MLS Grid
- 2025-10-13 Listing Removed — REALTRACS as Distributed by MLS Grid
- 2025-10-01 Listed $309,000 REALTRACS as Distributed by MLS Grid
- 2014-03-18 Sold (Public Records) $89,000 Public Records
- 2014-03-12 Listing Removed — REALTRACS as Distributed by MLS Grid
- 2014-03-12 Sold (MLS) $170,800 REALTRACS as Distributed by MLS Grid
- 2014-03-12 Sold (MLS) $170,800 REALTRACS as Distributed by MLS Grid
- 2013-12-29 Listed $194,500 REALTRACS as Distributed by MLS Grid
- 2007-04-24 Sold (Public Records) $355,000 Public Records
- 1997-06-17 Sold (Public Records) $265,000 Public Records
- 1983-10-24 Sold (Public Records) $40,000 Public Records
Property tax history
+10.7%/yrLatest (2025): $3,450 · +17.7% YoY. Source: county tax records.
Cash-flow waterfall
monthlySold comps — $/sqft
last 12 mo · ≤1 miLoading sold comps…