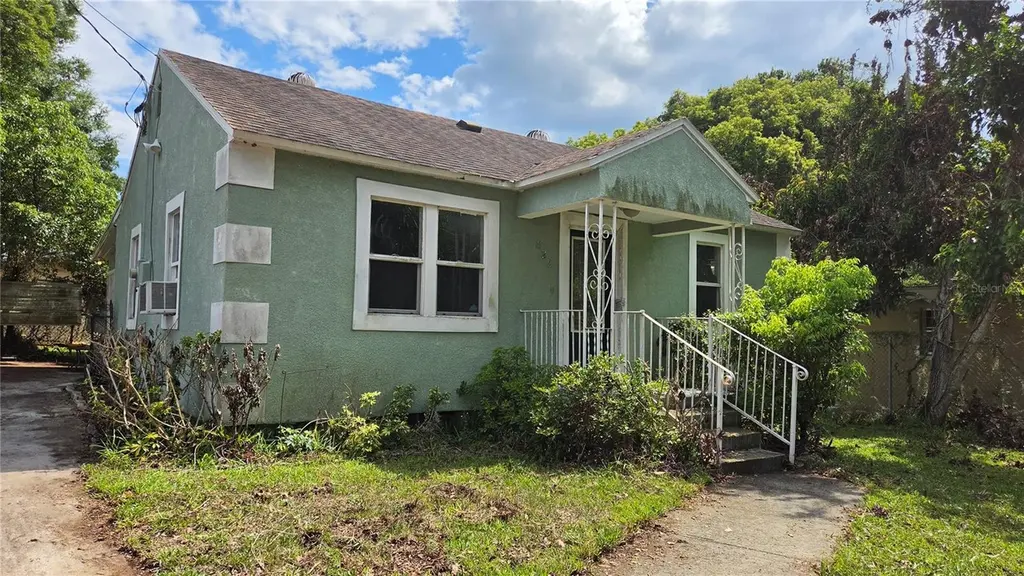
522 W 13th St · Lakeland, FL
Flood risk 1/10 · Minimal
- FEMA flood zone
- X (unshaded)
- Chance of flooding over 30 yrs
- 0.0%
- Est. flood insurance / yr
- $507 – $1,088
Fire risk 2/10 · Minimal
- Est. fire insurance / yr
- $947 – $1,759
Heat risk 8/10 · Major
- Hot days now (above 108°F)
- 7 days/yr
- Hot days in 30 yrs
- 22 days/yr
Wind risk 9/10 · Severe
- Chance of severe wind over 30 yrs
- 99.0%
Air-quality risk 2/10 · Minimal
- Unhealthy air days now
- 1 days/yr
- Unhealthy air days in 30 yrs
- 1 days/yr
Risk factors via First Street. Map © Google.
Why this score? — see what drove the D grade
The composite is a weighted blend of 9 inputs, each scored 0–100. Each bar is that input's sub-score; the figure is the points it added to the 100-point composite (weight × sub-score).
- Cash flow +15.7/30.0
- ARV discount +7.5/15.0
- DSCR +4.8/10.0
- Livability +3.9/5.0
- Schools +3.5/10.0
- 1% rule +3.0/10.0
- Rent growth +2.7/5.0
- Condition / age +2.5/5.0
- Appreciation +0.0/10.0
$185,000
🖨 Deal sheet (PDF) 📄 Offer letter ✓ Due diligence
Listing remarks MLS
PRICE REDUCTION!!!!! WELCOME HOME! MOTIVATED SELLER! NEW WOOD FLOORS, NEW ROOF, REMODELED.
Key facts
- Large empty lot
- Large side yard
- 7,802 sq ft lot
Tags
Property features AI
Finance
- Other: Property zoned RA-4; Homestead status indicated; Unfurnished; Living area reported as 600 sq ft (building area 968 sq ft); Lot size approximately 0.18 acres
- HOA & community: No HOA association indicated; Cats and dogs allowed
Exterior
- Parking: Driveway
- Utilities: Public water; Public sewer; Electricity connected; Water connected; Sewer connected; Cable available
- Home design: Single family residence; One story; Completed condition; Faces north
- Construction: Stucco construction; Shingle roof; Crawlspace foundation; Built as existing (year not provided)
- Exterior features: Front porch; Awnings; Chain link fencing; Shed(s); Mature landscaping; Asphalt road access; Lot dimensions approximately 120 x 65
Interior
- Kitchen: Range; Microwave; Refrigerator; Dishwasher
- Bedrooms: 2 bedrooms
- Flooring: Wood flooring
- Bathrooms: 1 full bathroom
- Heating & cooling: Other heating; Wall/window air conditioning unit(s)
- Interior features: Ceiling fans
- Laundry & utility: Washer; Dryer; Dedicated laundry room
Neighborhood map
What this means for you Summary
Snapshot
- This is a 2-bed/1.0-bath single-family listed at $185k.
Deal economics
- At list price, monthly cash flow is $80 ($965/yr) — positive.
- The deal already cash-flows at list — no discount required.
- To meet the 1% rule (rent ≥ 1% of price), the offer needs to be $148k (19.9% below list).
- Recommended offer: $148k (19.9% below list) — sets the bar for 1% rule.
Location & tenants
- Location reads 77/100 on livability (#206 in FL, #3,179 nationally) — a middle-class / working-renter tenant base. Strengths: cost of living A+, housing A+, health & safety A+; Watch: employment D+, amenities F, commute F.
- Polk (suburban): math 39% / reading 43% proficiency, ranked #62 of 73 in FL (top 85%) — families likely to look elsewhere, expect single-tenant / working-renter base with shorter leases.
- Zoned schools: Dr. Ne Roberts Elementary School (math 45% / reading 34%, grade F, #1,513 of 2,144 statewide, top 73%, 691 students, 54% FRL); Lake Gibson Middle School (math 40% / reading 39%, grade F, #373 of 571 statewide, top 66%, 1,218 students, 56% FRL); Tenoroc High School (math 12% / reading 25%, grade F, #568 of 667 statewide, top 85%, 1,127 students, 63% FRL) — zoned schools at 58% FRL track the district average.
- Market conditions: Rents flat; 164 active listings in the ZIP; 30 comparable units currently listed for rent nearby; rentals at typical pace (median 21d on market — plan ~3-4 weeks tenant-placement turnaround); 10,384 units permitted in Polk County in 2024 (1,716 in 5+ unit buildings).
Forward outlook
- Local home prices are declining (-3.0%/yr); year-one equity from $1k of loan paydown is wiped out by about $6k of value loss. Plan a longer hold.
- Polk County population projected at +33% by 2050 — long-run rental-demand tailwind backs the buy-and-hold thesis.
Negotiation context
- Only 9 days on market — expect competitive offers; lowballing is unlikely to land.
- 5 sale attempts since 12y ago with the ask held roughly flat each time — persistent listings suggest the price (not the market) is what's stuck; bring a comps-based counter.
- Current owner paid $84k; list at $185k implies a 120% gain — meaningful room to come down on a strong offer.
Risks & watch-outs
- Watch-outs: built in 1955 — expect roof / HVAC / electrical / plumbing capex.
- Climate carrying-cost: severe wind risk, 99% chance of damaging wind over 30y; extreme-heat days projected 7→22/yr by 2055 (HVAC capex compounding) — expect insurance premiums to compound above CPI over the hold.
Questions for the listing agent
- Built in 1955 — when were the roof, HVAC, electrical panel, plumbing, and water heater last replaced?
- Is there a deadline driving the sale (1031 exchange, divorce, estate, relocation)? That informs how much negotiation room exists.
- The area grade is low — what's the realistic commute time and amenity access for the typical tenant pool here? Any planned neighborhood developments (good or bad) we should know about?
- What's the average days-on-market for RENTAL listings here right now (not sales)? A rising rental-DOM trend means longer vacancies and softer asking-rent achievability than the comps imply.
- What's the recent tenant-quality profile in this submarket — average credit score on applications, eviction rate, late-payment / NSF rate, and stable-employment percentage? A property-management company in the area should have these aggregated.
- How much new for-sale + rental construction is in the pipeline within 1–3 miles? Heavy new supply typically softens prices + rents 12–24 months out; constrained supply supports both.
Investment metrics
- 1% rule
- 0.80% ✗
- Cap rate
- 6.81%
- Cash-on-cash
- 1.86%
- DSCR
- 1.08
- GRM
- 10.4
CMA / ARV
No comps found within radius.
Projected returns pro-forma
-3.0% appreciation · 0.77% rent growth · sell at horizon
- IRR
- -15.6%
- Equity multiple
- 0.46×
- Total profit
- $-28,203
- Equity at exit
- $27,584
- IRR
- -10.9%
- Equity multiple
- 0.40×
- Total profit
- $-31,104
- Equity at exit
- $15,995
Cash invested: $51,800 (down + closing). Projections, not guarantees.
Landlord ↔ Tenant lean methodology
- Overall (STATE)
- 87 Strongly Landlord-Friendly
- State Florida
- 87 Strongly Landlord-Friendly · R+3
- County
- — inherits STATE
- City
- — inherits STATE
ZIP-level market 33805
- Home prices YoY
- -29.8%
- Rents YoY
- 0.8%
- Active inventory
- 164
- Price-to-rent
- 10.4×
Monthly cashflow live
- Estimated rent
- $1,481 high interval (Pro) →
- Mortgage (P&I)
- −$970
- Tax from tax record
- −$42 /mo · $509/yr
- Insurance
- −$77
- HOA
- −$0
- Vacancy / Maint / Mgmt
- −$311
- Net cashflow
- $80
Break-even live
Sensitivity live
| Price | -10% $185 | -5% $133 | +0% $80 | +5% $28 | +10% $-24 |
|---|---|---|---|---|---|
| Rent | -10% $-37 | -5% $22 | +0% $80 | +5% $139 | +10% $197 |
| Rate | -1.0pp $174 | -0.5pp $127 | base $80 | +0.5pp $32 | +1.0pp $-16 |
UW: 25.0% down · 7.5% · 30yr · 1.5% tax · 5.0% vac · 8.0% maint · 8.0% mgmt
Financing live
Cash to close
- Down payment
- $46,250
- Closing costs
- $5,550
- Reserves months
- —
- Total cash needed
- —
Loan-product check · same deal, 3 products live
Conventional
25% down · 7.5% · 30yr
- Down + closing
- —
- Monthly P&I
- —
- Monthly cashflow
- —
- DSCR
- —
- Eligible?
- —
Personal DTI + credit; lowest rate.
DSCR
20% down · 8.5% · 30yr
- Down + closing
- —
- Monthly P&I
- —
- Monthly cashflow
- —
- DSCR
- —
- Eligible?
- —
No personal income docs; deal must DSCR.
Hard money
10% down · 12.0% · 12mo
- Down + closing
- —
- Monthly P&I
- —
- Monthly cashflow
- —
- DSCR
- —
- Eligible?
- —
Short-term bridge; refi at stabilization.
Rent comps 30 comps
| Address | Beds | Baths | Sqft | Rent | $/sqft | DOM | Units | Dist |
|---|---|---|---|---|---|---|---|---|
| 1704 Martin L King Jr Ave Lakeland, FL | 2.0 | 2.0 | 1050 | $5,000 | $4.76 | 25d | 1 | 0.21mi |
| 820 W 13th St Lakeland, FL | 2.0 | 1.0 | 950 | $1,300 | $1.37 | 25d | 1 | 0.26mi |
| 408 Bassedena Cir N Lakeland, FL | 3.0 | 2.0 | 1075 | $1,825 | $1.70 | 25d | 1 | 0.51mi |
| 123 Oconee St Unit 1368863P Lakeland, FL | 2.0 | 1.0 | 990 | $2,441 | $2.47 | 13d | 1 | 0.53mi |
| 1031 N Florence Ave Unit NA Lakeland, FL | 3.0 | 2.0 | 1100 | $1,495 | $1.36 | 16d | 1 | 0.62mi |
| 617 Lakehurst St Lakeland, FL | 3.0 | 2.0 | 1100 | $1,900 | $1.73 | 21d | 1 | 0.66mi |
| 720 Lakehurst St Lakeland, FL | 3.0 | 2.0 | 1092 | $1,750 | $1.60 | 25d | 1 | 0.74mi |
| 321 Emma St Lakeland, FL | 2.0 | 1.0 | 730 | $1,395 | $1.91 | 25d | 1 | 0.81mi |
| 711 N Virginia Ave Lakeland, FL | 2.0 | 1.0 | 780 | $1,100 | $1.41 | 25d | 1 | 0.82mi |
| 1211 Robert King High Dr Lakeland, FL | 3.0 | 1.5 | 1050 | $1,625 | $1.55 | 25d | 1 | 0.84mi |
| 454 King Edward Ave Lakeland, FL | 2.0 | 2.0 | 1048 | $1,399 | $1.33 | 5d | 1 | 0.89mi |
| 1480 Kathleen Rd Lakeland, FL | 2.0 | 1.0 | 868 | $1,345 | $1.55 | 5d | 1 | 0.94mi |
| 310 Plum St Unit 7 Lakeland, FL | 2.0 | 1.0 | 850 | $1,200 | $1.41 | 25d | 1 | 0.95mi |
| 131 Pear St Lakeland, FL | 2.0 | 1.0 | 741 | $950 | $1.28 | 25d | 1 | 0.95mi |
| 1031 Neville Ave Lakeland, FL | 2.0 | 2.0 | 728 | $1,375 | $1.89 | 21d | 1 | 1.10mi |
| 1128 Roselle Ave Unit 1130 Lakeland, FL | 2.0 | 1.0 | 780 | $1,200 | $1.54 | 5d | 1 | 1.11mi |
| 929 Gilmore Ave Lakeland, FL | 2.0 | 1.0–1.5 | 620 | $1,280 | $2.06 | 4d | 20 | 1.12mi |
| 3215 Baird Ave Lakeland, FL | 1.0–2.0 | 1.0 | 794 | $1,250 | $1.57 | 16d | 4 | 1.16mi |
| 1105 Jewel Ave Lakeland, FL | 2.0 | 1.0 | 987 | $1,200 | $1.22 | 25d | 1 | 1.18mi |
| 1027 N Brunnell Pkwy Lakeland, FL | 2.0 | 1.0 | 826 | $1,050 | $1.27 | 5d | 1 | 1.26mi |
| 3150 Pyramid Pkwy Lakeland, FL | 1.0 | 1.0 | 432 | $1,210 | $2.80 | 5d | 3 | 1.26mi |
| 620 N Lake Ave Unit 2 Lakeland, FL | 2.0 | 1.0 | 760 | $1,100 | $1.45 | 5d | 1 | 1.27mi |
| 620 N Lake Ave Unit 3 Lakeland, FL | 2.0 | 1.0 | 760 | $1,175 | $1.55 | 16d | 1 | 1.27mi |
| 609 N Stella Ave Apt A Lakeland, FL | 2.0 | 1.0 | 735 | $1,100 | $1.50 | 25d | 1 | 1.27mi |
| 270 E Bay St Lakeland, FL | 2.0 | 1.0–2.0 | 892 | $1,725 | $1.93 | 5d | 6 | 1.30mi |
| 921 E Parker St Lakeland, FL | 1.0 | 1.0 | 715 | $1,150 | $1.61 | 16d | 1 | 1.35mi |
| 1137 Edith Ave Lakeland, FL | 3.0 | 1.0 | 1100 | $1,800 | $1.64 | 5d | 1 | 1.36mi |
| 1035 N Davis Ave Lakeland, FL | 2.0 | 2.0 | 870 | $1,150 | $1.32 | 21d | 1 | 1.38mi |
| 600 E Bay St Lakeland, FL | 3.0 | 1.0–2.0 | 914 | $2,166 | $2.37 | 5d | 29 | 1.39mi |
| 125 N Kentucky Ave #307 Lakeland, FL | 1.0 | 1.5 | 911 | $3,550 | $3.90 | 25d | 1 | 1.45mi |
Listing history 7 events
-
2026-06-22days on market $185,000 Active 9 DOM
-
2026-06-18days on market $185,000 Active 6 DOM
-
2026-06-17days on market $185,000 Active 5 DOM
-
2026-06-16days on market $185,000 Active 4 DOM
-
2026-06-15days on market $185,000 Active 3 DOM
-
2026-06-13remarks 447-char remark
-
2026-06-13$185,000 Active 1 DOM
ⓘ Source: listings_history table (triggers on properties + properties_extension) + one-shot
backfill from property_details.listing_events for pre-trigger history.
Tax reassessment forecast FL · Resets to sale price
- Current annual tax
- $509 · $42/mo
- Projected year-2 tax
- $1,536 · $128/mo
- Expected delta
- +$1,026/yr (+$86/mo · 201.5%)
ⓘ Screening estimate from a state-policy table — verify with the county assessor before closing.
Climate risk First Street
- Flood 1/10 Low FEMA zone X (unshaded) · 0% chance over 30 yrs
- Wildfire 2/10 Low
- Heat 8/10 Severe 7 d/yr ≥108°F today · 22 d/yr by 30 yrs out
- Wind 9/10 Extreme 99% chance of damaging wind over 30 yrs
- Air quality 2/10 Low 1 unhealthy d/yr today · 1 by 30 yrs out
Nearby sold comps map
Loading sold comps map…
Walkable amenities ~0.75 mi
Loading nearby amenities…
Taxation est. · year 1
- Rental income
- $17,773
- − Mortgage interest
- −$10,363
- − Property taxes
- −$509
- − Insurance
- −$925
- − Repairs & maintenance
- −$1,422
- − Management
- −$1,422
- − Depreciation
- −$5,382
- Taxable loss
- −$2,250
- Est. tax savings @ 24.0%
- +$540
- After-tax cash flow
- $1,504/yr
For passive investors: Depreciation is non-cash, so a rental often shows a tax loss while cash-flowing — sheltering income. Rental losses are passive: they offset passive income freely, and up to $25,000/yr can offset ordinary (W-2) income if you actively participate and your MAGI is under $100k (phasing out to $0 by $150k); unused losses carry forward. On sale, claimed depreciation is recaptured at up to 25%, and gains may owe capital-gains tax (a 1031 exchange can defer both). Figures are a year-1 estimate at your 24.0% rate — not tax advice; consult a CPA.
Schools (NCES district)
- District
- Polk
- NCES district ID
- 1201590
- Math proficiency
- 39% ▼ -11.00%
- Reading proficiency
- 43% ▼ -4.00%
- Median HH income
- $43,979
- Composite
- 34.74/100
- National rank
- #5132
- State rank
- #62 of 73 in FL
Livability — Lakeland
- Score
- 77/100
- State rank
- #206
- US rank
- #3179
Category grades
Schools grade is shown separately in the Schools card above.
Census & demographics
- Census place
- Lakeland, FL
- County
- Polk County · 740,051 people
- City population
- 277,690
- Metro
- Lakeland-Winter Haven, FL
- Population (ZIP)
- 28,751
- Household income
- $62,661
- Rent vs Own
- Severe rent burden
- 1179.0
Population outlook (Polk County) Hauer SSP2
- Today (2025)
- 752,975 people
- By 2030
- 804,621 · +6.9%
- By 2040
- 906,117 · +20.3%
- By 2050
- 1,000,476 · +32.9%
- By 2075
- 1,197,520 · +59.0%
- By 2100
- 1,271,518 · +68.9%
Race, ethnicity, and origin ACS 2023
- Neighborhood character
- Diverse neighborhood (Simpson 0.68)
- Race & ethnicity
- White 38% Black 37% Hispanic / Latino 20% Two or more races 8% Asian 1%
- Hispanic origin (detail)
- Mexican 5% Puerto Rican 9% Cuban 2%
- Common ancestry
- Hispanic 2% Lithuanian 1% Romanian 1%
- Foreign-born
- 12% · Canada, Jamaica
- Languages at home
- 79% English-only · Spanish 16% French/Haitian/Cajun 2% Other Asian/Pacific 1%
Political lean MEDSL · Polk
- 2024 margin
- Strong R (+20.7) · D 39.2% · R 59.9%
- 2008→2024 swing
- -14.6pp toward R · 2008: -6.1pp · 2024: -20.7pp
- All cycles
- 2024: R+20.7 2020: R+14.4 2016: R+14.1 2012: R+6.8 2008: R+6.1
Not yet ingested
- Civics
- —
Market trends
- HPI YoY
- ▼ -158.44%
- Current HPI
- 372.7317
- Rent YoY
- ▲ 0.77%
- Metro
- Lakeland-Winter Haven, FL
- State GDP YoY
- ▲ 3.28%
- F500 in state
- 36
Industry mix (Fortune 500 HQ in FL)
| Industry | F500 HQs | Revenue |
|---|---|---|
| Industrial Technology | 2 | $29B |
|
||
| Insurance | 2 | $17B |
|
||
| Retail | 1 | $60B |
|
||
| Technology Distribution | 1 | $58B |
|
||
| Homebuilding | 1 | $35B |
|
||
| Technology Manufacturing | 1 | $35B |
|
||
Price history
+825.0% since first listed21 events — show timeline
- 2026-06-12 Listed $185,000 Stellar MLS as Distributed by MLS Grid
- 2018-10-03 Sold (Public Records) $84,100 Public Records
- 2018-09-28 Sold (MLS) $84,000 Stellar MLS as Distributed by MLS Grid
- 2018-06-30 Pending — Stellar MLS as Distributed by MLS Grid
- 2018-05-19 Relisted — Stellar MLS as Distributed by MLS Grid
- 2018-05-18 Pending — Stellar MLS as Distributed by MLS Grid
- 2018-05-14 Price Changed $85,000 Stellar MLS as Distributed by MLS Grid
- 2018-05-14 Relisted — Stellar MLS as Distributed by MLS Grid
- 2018-04-14 Pending — Stellar MLS as Distributed by MLS Grid
- 2018-03-31 Pending — Stellar MLS as Distributed by MLS Grid
- 2018-03-07 Price Changed $82,000 Stellar MLS as Distributed by MLS Grid
- 2018-03-02 Price Changed $85,000 Stellar MLS as Distributed by MLS Grid
- 2018-02-13 Price Changed $89,000 Stellar MLS as Distributed by MLS Grid
- 2018-01-23 Price Changed $93,000 Stellar MLS as Distributed by MLS Grid
- 2018-01-10 Listed $95,000 Stellar MLS as Distributed by MLS Grid
- 2015-05-16 Listing Removed — Stellar MLS as Distributed by MLS Grid
- 2015-04-15 Price Changed $59,900 Stellar MLS as Distributed by MLS Grid
- 2015-01-15 Price Changed $63,000 Stellar MLS as Distributed by MLS Grid
- 2014-12-09 Price Changed $64,000 Stellar MLS as Distributed by MLS Grid
- 2014-11-23 Listed $65,000 Stellar MLS as Distributed by MLS Grid
- 1998-07-22 Sold (Public Records) $20,000 Public Records
Property tax history
+4.2%/yrLatest (2025): $509 · +1.7% YoY. Source: county tax records.
Cash-flow waterfall
monthlySold comps — $/sqft
last 12 mo · ≤1 miLoading sold comps…