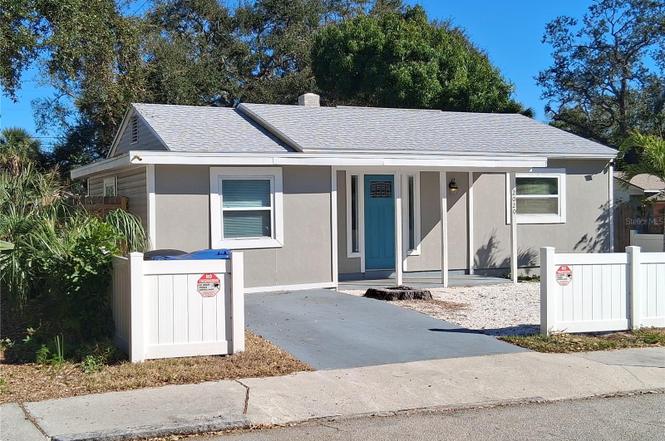
2020 13th St S · St. Petersburg, FL
Flood risk 1/10 · Minimal
- FEMA flood zone
- X (unshaded)
- Chance of flooding over 30 yrs
- 0.0%
- Est. flood insurance / yr
- $507 – $1,088
Fire risk 1/10 · Minimal
- Est. fire insurance / yr
- $947 – $1,759
Heat risk 10/10 · Severe
- Hot days now (above 106°F)
- 7 days/yr
- Hot days in 30 yrs
- 25 days/yr
Wind risk 10/10 · Severe
- Chance of severe wind over 30 yrs
- 99.0%
Air-quality risk 3/10 · Minor
- Unhealthy air days now
- 3 days/yr
- Unhealthy air days in 30 yrs
- 3 days/yr
Risk factors via First Street. Map © Google.
Why this score? — see what drove the D+ grade
The composite is a weighted blend of 9 inputs, each scored 0–100. Each bar is that input's sub-score; the figure is the points it added to the 100-point composite (weight × sub-score).
- Cash flow +14.2/30.0
- ARV discount +13.4/15.0
- DSCR +4.3/10.0
- Schools +4.3/10.0
- 1% rule +3.7/10.0
- Rent growth +2.5/5.0
- Livability +2.5/5.0
- Condition / age +2.5/5.0
- Appreciation +0.0/10.0
$229,000
🖨 Deal sheet (PDF) 📄 Offer letter ✓ Due diligence
Listing remarks MLS
NOMORE SHOWING CAN BE SCHEDULED, MULTIPLE OFFERS. HIGHEST AND BEST IS DUE BY 8/30/2020 12PM This home sits on a large lot and has been fully renovated. Brand New A/C unit, grey flooring throughout the bedrooms, updated bathroom and windows. Tenant pays $1100/monthly and has been paying on time since they been in the property. Lease ends March' 29' 2021
Key facts
- Fully renovated
- New a/c unit
- Brand new roof
Tags
Neighborhood map
What this means for you Summary
Snapshot
- This is a 3-bed/1.0-bath single-family listed at $229k.
Deal economics
- At list price, monthly cash flow is $37 ($444/yr) — positive.
- The deal already cash-flows at list — no discount required.
- To meet the 1% rule (rent ≥ 1% of price), the offer needs to be $200k (12.5% below list).
- Recommended offer: $200k (12.5% below list) — sets the bar for 1% rule.
- Cap rate 6.5% vs local median 2.6% in St. Petersburg — top-decile yield for the area; either an underpriced asset or a hidden risk that comps aren't pricing in. Stress-test before assuming the spread holds.
Location & tenants
- Location reads: area grade D — affects rentability + tenant quality, not the cash-flow math above.
- Pinellas (suburban): math 51% / reading 51% proficiency, ranked #31 of 73 in FL (top 42%) — acceptable for families but not a draw, mixed tenant base, ~2y average lease.
- Market conditions: Rents soft (-0.1%/yr); 308 active listings in the ZIP; 40 comparable units currently listed for rent nearby; rentals at typical pace (median 16d on market — plan ~3-4 weeks tenant-placement turnaround); 2,676 units permitted in Pinellas County in 2024 (1,422 in 5+ unit buildings).
- This rent runs 33% of the median local income ($73k/yr) — at the standard rent-burdened threshold; future hikes will face affordability resistance.
Forward outlook
- Local home prices are declining (-3.0%/yr); year-one equity from $2k of loan paydown is wiped out by about $7k of value loss. Plan a longer hold.
- Pinellas County population projected at +14% by 2050 — modest demand growth; plan on rents tracking national, not racing it.
Negotiation context
- It's been on market 48 days — a 3% lower offer ($222k) is reasonable based on typical stale-listing flexibility.
- 3 sale attempts since 6y ago; this cycle's ask has dropped $20k (8%) from the opening price — seller is motivated, your offer sets the floor, not the list.
- Current owner paid $100k; list at $229k implies a 129% gain — meaningful room to come down on a strong offer.
Risks & watch-outs
- Watch-outs: built in 1950 — expect roof / HVAC / electrical / plumbing capex.
- Climate carrying-cost: severe wind risk, 99% chance of damaging wind over 30y; extreme-heat days projected 7→25/yr by 2055 (HVAC capex compounding) — expect insurance premiums to compound above CPI over the hold.
Questions for the listing agent
- It's been on market 48 days. Have you received any prior offers? Is the seller open to a 13% concession, seller financing, or rate buy-down credit?
- Built in 1950 — when were the roof, HVAC, electrical panel, plumbing, and water heater last replaced?
- Is there a deadline driving the sale (1031 exchange, divorce, estate, relocation)? That informs how much negotiation room exists.
- The area grade is low — what's the realistic commute time and amenity access for the typical tenant pool here? Any planned neighborhood developments (good or bad) we should know about?
- What's the average days-on-market for RENTAL listings here right now (not sales)? A rising rental-DOM trend means longer vacancies and softer asking-rent achievability than the comps imply.
- What's the recent tenant-quality profile in this submarket — average credit score on applications, eviction rate, late-payment / NSF rate, and stable-employment percentage? A property-management company in the area should have these aggregated.
- How much new for-sale + rental construction is in the pipeline within 1–3 miles? Heavy new supply typically softens prices + rents 12–24 months out; constrained supply supports both.
Investment metrics
- 1% rule
- 0.87% ✗
- Cap rate
- 6.49%
- Cash-on-cash
- 0.69%
- DSCR
- 1.03
- GRM
- 9.5
CMA / ARV
- ARV (on-the-fly)
- $263,473
- Comps found
- 12
Show comp detail 12 sales within ~0.75 mi
| Address | Dist | Beds/Ba | Sqft | Sold | Price | $/sf | Match |
|---|---|---|---|---|---|---|---|
| 946 23rd Ave S | 0.31mi | 3/1.0 | 990 (+6%) | 3mo | $280,000 | $283 | 72 |
| 2345 Highland St S | 0.44mi | 2/1.0 (-1) | 957 (+3%) | 2mo | $245,000 | $256 | 68 |
| 869 21st Ave S | 0.37mi | 2/1.0 (-1) | 894 (-4%) | 8mo | $206,500 | $231 | 64 |
| 753 16th Ave S | 0.63mi | 2/1.0 (-1) | 909 (-2%) | 3mo | $345,000 | $380 | 59 |
| 2226 Union St S | 0.62mi | 2/1.0 (-1) | 959 (+3%) | 4mo | $98,000 | $102 | 58 |
| 1608 Preston St S | 0.43mi | 2/1.0 (-1) | 833 (-10%) | 3mo | $242,000 | $291 | 55 |
| 1708 Preston St S | 0.36mi | 3/1.0 | 795 (-15%) | 9mo | $140,000 | $176 | 51 |
| 828 20th Ave S | 0.41mi | 2/1.0 (-1) | 834 (-10%) | 12mo | $280,000 | $336 | 48 |
| 645 16th Ave S | 0.75mi | 2/1.0 (-1) | 912 (-2%) | 12mo | $167,000 | $183 | 46 |
| 916 11th Ave S | 0.71mi | 3/1.5 | 1,008 (+8%) | 6mo | $359,000 | $356 | 46 |
| 670 16th Ave S | 0.71mi | 2/2.0 (-1) | 896 (-4%) | 7mo | $205,000 | $229 | 46 |
| 2333 22nd St S | 0.72mi | 2/2.5 (-1) | 947 (+2%) | 12mo | $320,000 | $338 | 42 |
Match score weights: distance 35% · size 25% · config 20% · recency 20%. Top-matched comps best support the ARV.
Projected returns pro-forma
-3.0% appreciation · 0.0% rent growth · sell at horizon
- IRR
- -18.5%
- Equity multiple
- 0.37×
- Total profit
- $-40,615
- Equity at exit
- $34,145
- IRR
- -18.2%
- Equity multiple
- 0.14×
- Total profit
- $-54,987
- Equity at exit
- $19,800
Cash invested: $64,120 (down + closing). Projections, not guarantees.
Landlord ↔ Tenant lean methodology
- Overall (STATE)
- 87 Strongly Landlord-Friendly
- State Florida
- 87 Strongly Landlord-Friendly · R+3
- County
- — inherits STATE
- City
- — inherits STATE
ZIP-level market 33705
- Rents YoY
- -0.1%
- Active inventory
- 308
- Price-to-rent
- 9.5×
Monthly cashflow live
- Estimated rent
- $2,003 high interval (Pro) →
- Mortgage (P&I)
- −$1,201
- Tax from tax record
- −$249 /mo · $2,987/yr
- Insurance
- −$95
- HOA
- −$0
- Vacancy / Maint / Mgmt
- −$421
- Net cashflow
- $37
Break-even live
Sensitivity live
| Price | -10% $167 | -5% $102 | +0% $37 | +5% $-28 | +10% $-93 |
|---|---|---|---|---|---|
| Rent | -10% $-121 | -5% $-42 | +0% $37 | +5% $116 | +10% $195 |
| Rate | -1.0pp $152 | -0.5pp $95 | base $37 | +0.5pp $-22 | +1.0pp $-83 |
UW: 25.0% down · 7.5% · 30yr · 1.5% tax · 5.0% vac · 8.0% maint · 8.0% mgmt
Financing live
Cash to close
- Down payment
- $57,250
- Closing costs
- $6,870
- Reserves months
- —
- Total cash needed
- —
Loan-product check · same deal, 3 products live
Conventional
25% down · 7.5% · 30yr
- Down + closing
- —
- Monthly P&I
- —
- Monthly cashflow
- —
- DSCR
- —
- Eligible?
- —
Personal DTI + credit; lowest rate.
DSCR
20% down · 8.5% · 30yr
- Down + closing
- —
- Monthly P&I
- —
- Monthly cashflow
- —
- DSCR
- —
- Eligible?
- —
No personal income docs; deal must DSCR.
Hard money
10% down · 12.0% · 12mo
- Down + closing
- —
- Monthly P&I
- —
- Monthly cashflow
- —
- DSCR
- —
- Eligible?
- —
Short-term bridge; refi at stabilization.
Rent comps 40 comps
| Address | Beds | Baths | Sqft | Rent | $/sqft | DOM | Units | Dist |
|---|---|---|---|---|---|---|---|---|
| 1320 18th Ave S Saint Petersburg, FL | 2.0 | 1.0 | 750 | $1,550 | $2.07 | 18d | 1 | 0.13mi |
| 1715 14th St S St. Petersburg, FL | 2.0 | 1.0 | 1000 | $1,850 | $1.85 | 25d | 1 | 0.19mi |
| 1701 14th St S Unit A St. Petersburg, FL | 2.0 | 1.0 | 1100 | $1,950 | $1.77 | 25d | 1 | 0.20mi |
| 1931 10th St S St. Petersburg, FL | 2.0 | 1.0 | 625 | $1,675 | $2.68 | 15d | 1 | 0.23mi |
| 986 22nd Ave S #3 St. Petersburg, FL | 2.0 | 2.0 | 850 | $1,350 | $1.59 | 14d | 1 | 0.23mi |
| 2222 10th St S Unit B St. Petersburg, FL | 2.0 | 1.0 | 600 | $1,800 | $3.00 | 25d | 1 | 0.23mi |
| 966 22nd Ave S Unit 109 St. Petersburg, FL | 2.0 | 2.0 | 900 | $1,795 | $1.99 | 8d | 1 | 0.27mi |
| 944 18th Ave S Unit A St. Petersburg, FL | 3.0 | 1.0 | 1013 | $2,100 | $2.07 | 18d | 1 | 0.30mi |
| 1919 Doctor Martin Luther King Junior St S Unit 1/2 St. Petersburg, FL | 3.0 | 1.0 | 892 | $2,200 | $2.47 | 3d | 1 | 0.32mi |
| 1919 Doctor Martin Luther King Junior St S Unit 1/2 St. Petersburg, FL | 3.0 | 1.0 | 892 | $2,580 | $2.89 | 21d | 1 | 0.32mi |
| 1529 12th St S Unit A St. Petersburg, FL | 2.0 | 1.5 | 700 | $1,550 | $2.21 | 25d | 1 | 0.33mi |
| 1650 Prescott St S Saint Petersburg, FL | 3.0 | 1.0 | 960 | $2,100 | $2.19 | 5d | 1 | 0.35mi |
| 1760 Queen St S Saint Petersburg, FL | 3.0 | 1.0 | 1004 | $2,000 | $1.99 | 5d | 1 | 0.38mi |
| 1828 20th Ave S Saint Petersburg, FL | 3.0 | 1.0 | 1015 | $1,650 | $1.63 | 25d | 1 | 0.40mi |
| 2219 Highland St S Unit 1 St. Petersburg, FL | 2.0 | 1.0 | 850 | $1,650 | $1.94 | 25d | 1 | 0.41mi |
| 1428 12th St S Saint Petersburg, FL | 2.0 | 1.0 | 575 | $1,400 | $2.43 | 22d | 1 | 0.42mi |
| 1427 15th St S Saint Petersburg, FL | 3.0 | 1.0 | 1030 | $2,095 | $2.03 | 5d | 1 | 0.45mi |
| 767 19th Ave S Saint Petersburg, FL | 2.0 | 1.0 | 800 | $1,875 | $2.34 | 5d | 1 | 0.51mi |
| 2000 Queensboro Ave S Unit A St. Petersburg, FL | 2.0 | 1.0 | 616 | $1,450 | $2.35 | 25d | 1 | 0.51mi |
| 1771 15th Ave S Saint Petersburg, FL | 2.0 | 1.0 | 800 | $1,195 | $1.49 | 5d | 1 | 0.54mi |
| 1771 15th Ave S Unit 1/2 St. Petersburg, FL | 2.0 | 1.0 | 624 | $1,195 | $1.92 | 8d | 1 | 0.54mi |
| 725 21st Ave S Unit A St. Petersburg, FL | 2.0 | 1.0 | 750 | $1,750 | $2.33 | 18d | 1 | 0.54mi |
| 2230 Grove St S Saint Petersburg, FL | 2.0 | 1.0 | 1108 | $1,750 | $1.58 | 5d | 1 | 0.56mi |
| 2621 18th St S Saint Petersburg, FL | 3.0 | 1.0 | 1114 | $2,200 | $1.97 | 25d | 1 | 0.56mi |
| 711 18th Ave S Unit 2 St. Petersburg, FL | 2.0 | 1.0 | 896 | $1,295 | $1.45 | 4d | 1 | 0.58mi |
| 1311 Prescott St S Saint Petersburg, FL | 4.0 | 2.0 | 1048 | $2,300 | $2.19 | 5d | 1 | 0.58mi |
| 888 14th Ave S St Petersburg, FL | 2.0 | 1.0 | 1084 | $1,825 | $1.68 | 5d | 1 | 0.60mi |
| 2835 Dr Martin Luther King Jr St S Saint Petersburg, FL | 2.0 | 1.0 | 780 | $1,450 | $1.86 | 25d | 1 | 0.62mi |
| 1920 14th Ave S Saint Petersburg, FL | 3.0 | 2.0 | 1073 | $1,865 | $1.74 | 25d | 1 | 0.62mi |
| 2935 Dr Martin Luther King Jr St S Saint Petersburg, FL | 4.0 | 1.0 | 1042 | $1,895 | $1.82 | 5d | 1 | 0.66mi |
| 2028 14th Ave S Unit A St. Petersburg, FL | 2.0 | 2.0 | 1000 | $1,920 | $1.92 | 25d | 1 | 0.66mi |
| 2020 14th Ave S Unit A St. Petersburg, FL | 2.0 | 2.0 | 1000 | $1,920 | $1.92 | 8d | 1 | 0.66mi |
| 2010 22nd St S Saint Petersburg, FL | 3.0 | 1.0 | 1036 | $1,695 | $1.64 | 5d | 1 | 0.66mi |
| 675 17th Ave S Unit 1 St. Petersburg, FL | 2.0 | 1.0 | 1000 | $1,950 | $1.95 | 25d | 1 | 0.67mi |
| 979 11th Ave S St. Petersburg, FL | 2.0 | 2.0 | 721 | $2,350 | $3.26 | 13d | 1 | 0.69mi |
| 725 14th Ave S Apt D St. Petersburg, FL | 3.0 | 1.0 | 818 | $1,395 | $1.71 | 4d | 1 | 0.74mi |
| 672 28th Ave S Saint Petersburg, FL | 3.0 | 1.0 | 1032 | $1,820 | $1.76 | 25d | 1 | 0.77mi |
| 1036 19th St S Saint Petersburg, FL | 2.0 | 1.0 | 575 | $1,500 | $2.61 | 25d | 1 | 0.78mi |
| 2245 17th Ave S Saint Petersburg, FL | 4.0 | 2.0 | 1058 | $2,400 | $2.27 | 5d | 1 | 0.80mi |
| 2231 15th Ave S Saint Petersburg, FL | 2.0 | 1.0 | 768 | $1,900 | $2.47 | 5d | 1 | 0.82mi |
Listing history 13 events
-
2026-04-02status Pending
-
2026-03-04price $229,000
-
2026-02-19status Active
-
2026-02-13status Pending
-
2026-02-06$249,000 Active
-
2020-09-21soldstatus $100,000
-
2020-09-18soldstatus $100,000 Sold 357-char remark
Show marketing remark (357 chars)
NOMORE SHOWING CAN BE SCHEDULED, MULTIPLE OFFERS. HIGHEST AND BEST IS DUE BY 8/30/2020 12PM This home sits on a large lot and has been fully renovated. Brand New A/C unit, grey flooring throughout the bedrooms, updated bathroom and windows. Tenant pays $1100/monthly and has been paying on time since they been in the property. Lease ends March' 29' 2021
-
2020-08-30status Pending 357-char remark
Show marketing remark (357 chars)
NOMORE SHOWING CAN BE SCHEDULED, MULTIPLE OFFERS. HIGHEST AND BEST IS DUE BY 8/30/2020 12PM This home sits on a large lot and has been fully renovated. Brand New A/C unit, grey flooring throughout the bedrooms, updated bathroom and windows. Tenant pays $1100/monthly and has been paying on time since they been in the property. Lease ends March' 29' 2021
-
2020-08-28$94,999 Active 357-char remark
Show marketing remark (357 chars)
NOMORE SHOWING CAN BE SCHEDULED, MULTIPLE OFFERS. HIGHEST AND BEST IS DUE BY 8/30/2020 12PM This home sits on a large lot and has been fully renovated. Brand New A/C unit, grey flooring throughout the bedrooms, updated bathroom and windows. Tenant pays $1100/monthly and has been paying on time since they been in the property. Lease ends March' 29' 2021
-
2004-04-02soldstatus $53,300
-
1998-12-21soldstatus $10,000
-
1997-01-02soldstatus $69,000
-
1991-03-14soldstatus $8,000
ⓘ Source: listings_history table (triggers on properties + properties_extension) + one-shot
backfill from property_details.listing_events for pre-trigger history.
Tax reassessment forecast FL · Resets to sale price
- Current annual tax
- $2,987 · $249/mo
- Projected year-2 tax
- $2,987 · $249/mo
- Expected delta
- $0/yr ($0/mo · 0.0%)
ⓘ Screening estimate from a state-policy table — verify with the county assessor before closing.
Climate risk First Street
- Flood 1/10 Low FEMA zone X (unshaded) · 0% chance over 30 yrs
- Wildfire 1/10 Low
- Heat 10/10 Extreme 7 d/yr ≥106°F today · 25 d/yr by 30 yrs out
- Wind 10/10 Extreme 99% chance of damaging wind over 30 yrs
- Air quality 3/10 Moderate 3 unhealthy d/yr today · 3 by 30 yrs out
Nearby sold comps map
Loading sold comps map…
Walkable amenities ~0.75 mi
Loading nearby amenities…
Taxation est. · year 1
- Rental income
- $24,033
- − Mortgage interest
- −$12,828
- − Property taxes
- −$2,987
- − Insurance
- −$1,145
- − Repairs & maintenance
- −$1,923
- − Management
- −$1,923
- − Depreciation
- −$6,662
- Taxable loss
- −$3,433
- Est. tax savings @ 24.0%
- +$824
- After-tax cash flow
- $1,268/yr
For passive investors: Depreciation is non-cash, so a rental often shows a tax loss while cash-flowing — sheltering income. Rental losses are passive: they offset passive income freely, and up to $25,000/yr can offset ordinary (W-2) income if you actively participate and your MAGI is under $100k (phasing out to $0 by $150k); unused losses carry forward. On sale, claimed depreciation is recaptured at up to 25%, and gains may owe capital-gains tax (a 1031 exchange can defer both). Figures are a year-1 estimate at your 24.0% rate — not tax advice; consult a CPA.
Schools (NCES district)
- District
- Pinellas
- NCES district ID
- 1201560
- Math proficiency
- 51% ▼ -5.00%
- Reading proficiency
- 51% ▼ -3.00%
- Median HH income
- $46,270
- Composite
- 43.27/100
- National rank
- #3046
- State rank
- #31 of 73 in FL
Livability — St. Petersburg
No livability data for this city. (Only ~50 U.S. cities are tracked.)
Census & demographics
- Census place
- St. Petersburg, FL
- County
- Pinellas County · 939,478 people
- City population
- 249,151
- Metro
- Tampa-St. Petersburg-Clearwater, FL
- Population (ZIP)
- 27,939
- Household income
- $73,027
- Rent vs Own
- Severe rent burden
- 1386.0
Population outlook (Pinellas County) Hauer SSP2
- Today (2025)
- 1,027,532 people
- By 2030
- 1,063,586 · +3.5%
- By 2040
- 1,125,020 · +9.5%
- By 2050
- 1,168,637 · +13.7%
- By 2075
- 1,265,188 · +23.1%
- By 2100
- 1,260,357 · +22.7%
Race, ethnicity, and origin ACS 2023
- Neighborhood character
- Diverse neighborhood (Simpson 0.64)
- Race & ethnicity
- Black 44% White 41% Two or more races 10% Hispanic / Latino 5%
- Hispanic origin (detail)
- Puerto Rican 1%
- Common ancestry
- Lithuanian 2% Italian 1% Slovak 1%
- Foreign-born
- 9% · Canada, Dominican Republic
- Languages at home
- 92% English-only · Spanish 4% Other Indo-European 1% Russian/Polish/Slavic 1%
Political lean MEDSL · Pinellas
- 2024 margin
- Lean R (+5.2) · D 46.9% · R 52.1%
- 2008→2024 swing
- -13.5pp toward R · 2008: 8.3pp · 2024: -5.2pp
- All cycles
- 2024: R+5.2 2020: D+0.2 2016: R+1.1 2012: D+5.6 2008: D+8.3
Not yet ingested
- Civics
- —
Market trends
- HPI YoY
- ▼ -540.28%
- Current HPI
- 388.3086
- Rent YoY
- ▼ -0.13%
- Metro
- Tampa-St. Petersburg-Clearwater, FL
- State GDP YoY
- ▲ 3.28%
- F500 in state
- 36
Industry mix (Fortune 500 HQ in FL)
| Industry | F500 HQs | Revenue |
|---|---|---|
| Industrial Technology | 2 | $29B |
|
||
| Insurance | 2 | $17B |
|
||
| Retail | 1 | $60B |
|
||
| Technology Distribution | 1 | $58B |
|
||
| Homebuilding | 1 | $35B |
|
||
| Technology Manufacturing | 1 | $35B |
|
||
Price history
+2762.5% since first listed13 events — show timeline
- 2026-04-02 Pending — Stellar MLS as Distributed by MLS Grid
- 2026-03-04 Price Changed $229,000 Stellar MLS as Distributed by MLS Grid
- 2026-02-19 Relisted — Stellar MLS as Distributed by MLS Grid
- 2026-02-13 Pending — Stellar MLS as Distributed by MLS Grid
- 2026-02-06 Listed $249,000 Stellar MLS as Distributed by MLS Grid
- 2020-09-21 Sold (Public Records) $100,000 Public Records
- 2020-09-18 Sold (MLS) $100,000 Stellar MLS as Distributed by MLS Grid
- 2020-08-30 Pending — Stellar MLS as Distributed by MLS Grid
- 2020-08-28 Listed $94,999 Stellar MLS as Distributed by MLS Grid
- 2004-04-02 Sold (Public Records) $53,300 Public Records
- 1998-12-21 Sold (Public Records) $10,000 Public Records
- 1997-01-02 Sold (Public Records) $69,000 Public Records
- 1991-03-14 Sold (Public Records) $8,000 Public Records
Property tax history
+23.2%/yrLatest (2025): $2,987 · +15.7% YoY. Source: county tax records.
Cash-flow waterfall
monthlySold comps — $/sqft
last 12 mo · ≤1 miLoading sold comps…