 Duplex
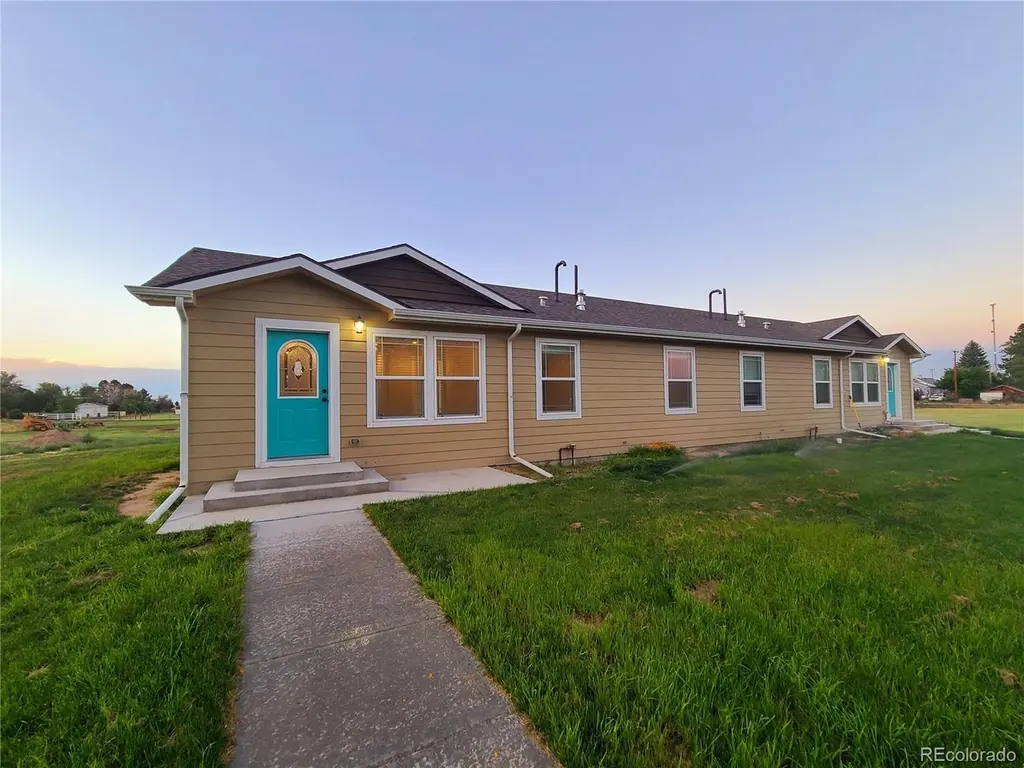
8 E 8th St · Flagler, CO
Flood risk No data
- FEMA flood zone
- —
- Chance of flooding over 30 yrs
- —
- Est. flood insurance / yr
- —
Fire risk No data
- Est. fire insurance / yr
- —
Heat risk No data
- Hot days now (above threshold)
- —
- Hot days in 30 yrs
- —
Wind risk No data
- Chance of severe wind over 30 yrs
- —
Air-quality risk No data
- Unhealthy air days now
- —
- Unhealthy air days in 30 yrs
- —
Risk factors via First Street. Map © Google.
Why this score? — see what drove the D- grade
The composite is a weighted blend of 9 inputs, each scored 0–100. Each bar is that input's sub-score; the figure is the points it added to the 100-point composite (weight × sub-score).
- Appreciation +9.9/10.0
- Cash flow +7.6/30.0
- ARV discount +7.5/15.0
- Livability +2.8/5.0
- Schools +2.6/10.0
- Rent growth +2.5/5.0
- Condition / age +2.5/5.0
- DSCR +1.7/10.0
- 1% rule +1.4/10.0
$320,000
🖨 Deal sheet (PDF) 📄 Offer letter ✓ Due diligence
Multi-family units
County records classify this as Multi-Family (2-4 Unit). Listing-text estimate: 2 units. confirmed
Listing remarks MLS
Newer duplex built in 2020 with low maintenance and high rental demand. Each side of the duplex consists of 3 beds and 2 baths. Each unit has their own independent AC, furnace, washer and dryer, and water heater. Tile floor throughout except in the primary bedroom where its carpeted. Located on a corner lot with an irrigation system. Few vacancies.
Key facts
- 4 parking spots
- Built 2020
- Listed 27 days
Property features AI
Finance
- Other: Living area 2,204 (public records)
- Financial info: Gross income: $30,600; Operating expenses: $18,336; Owner pays grounds care, trash collection, and water; Tenants pay electricity, gas, and internet; Current lease through 2027-05-18 with monthly lease amount of $1,250
Exterior
- Parking: 4 off-street parking spaces (total 4)
- Utilities: Public water; Public sewer; Electricity connected (220 volts); Natural gas connected
- Home design: Duplex residential income property; One level; Agent-owned
- Construction: Vinyl siding
- Exterior features: Rain gutters; Composition roof
Interior
- Bedrooms: 6 bedrooms
- Bathrooms: 4 bathrooms
- Heating & cooling: Forced air heating; Central air conditioning
- Interior features: Updated/remodeled condition; Crawl space basement
Neighborhood map
What this means for you Summary
Snapshot
- This is a 2 × 3-bed/2.0-bath units multifamily listed at $320k.
Deal economics
- At list price, monthly cash flow is $-383 ($-5k/yr) — negative. Per door: $-192/mo.
- To cash-flow at today's rent, offer at most $252k (21.1% below list).
- To meet the 1% rule (rent ≥ 1% of price), the offer needs to be $204k (36.4% below list).
- Recommended offer: $204k (36.4% below list) — sets the bar for 1% rule.
Location & tenants
- Location reads 56/100 on livability (#323 in CO) — a working-class tenant base; expect higher turnover. Strengths: cost of living A+; Watch: schools F, crime F, amenities F.
- Arriba-Flagler Consolidated School District No. 20 (rural): math 20% / reading 35% proficiency, ranked #125 of 176 in CO (top 71%) — low school quality limits family demand, transient renter base, plan for 1-2y turnover.
- Market conditions: 9 active listings in the ZIP; 3 units permitted in Kit Carson County in 2024 (0 in 5+ unit buildings).
Forward outlook
- In year one you build about $33k of equity ($2k loan paydown + $31k appreciation (9.7% local appreciation)).
- Kit Carson County population projected to shrink 6% by 2050 — rents likely to lag national; underwrite the cash flow, not the appreciation.
- By year 2, paydown + projected appreciation supports a ~$54k cash-out refi (75% LTV) — recoverable capital for the next deal without selling this one.
Negotiation context
- It's been on market 27 days — a 2% lower offer ($315k) is reasonable based on typical stale-listing flexibility.
- 2 sale attempts since 6y ago; this cycle's ask is 19% above the opening price — seller raised mid-cycle; expect resistance to lowballs.
- Current owner paid $270k; 19% above their basis — modest negotiation headroom, anchor on the comps not their cost.
Questions for the listing agent
- What do current leases actually rent for vs. the listed asking? Can we see a recent rent roll and the last 12 months of T-12 income?
- Can we see the unit-by-unit rent roll, current vacancy, and any below-market leases? What's the average tenancy length?
- What capital expenditures (roof, boiler, parking lot, exteriors) have been made in the last 5 years, and what's planned in the next 2?
- Is there a deadline driving the sale (1031 exchange, divorce, estate, relocation)? That informs how much negotiation room exists.
- Schools are F-rated, which usually means shorter tenancies and higher turnover. Who's the typical renter profile here, and what's been the actual vacancy rate?
- Crime grade is F in this area — have there been break-ins, vandalism, or insurance claims at this property in the last 3 years? What carrier currently insures it and at what premium?
- The area grade is low — what's the realistic commute time and amenity access for the typical tenant pool here? Any planned neighborhood developments (good or bad) we should know about?
- What's the average days-on-market for RENTAL listings here right now (not sales)? A rising rental-DOM trend means longer vacancies and softer asking-rent achievability than the comps imply.
- What's the recent tenant-quality profile in this submarket — average credit score on applications, eviction rate, late-payment / NSF rate, and stable-employment percentage? A property-management company in the area should have these aggregated.
- How much new apartment / multifamily construction is in the pipeline within 1–3 miles? Heavy new supply (>2% of stock underway) typically softens rents 12–24 months out; light construction supports rent growth.
Investment metrics
- 1% rule
- 0.64% ✗
- Cap rate
- 4.86%
- Cash-on-cash
- -5.13%
- DSCR
- 0.77
- GRM
- 13.1
CMA / ARV
No comps found within radius.
Projected returns pro-forma
9.74% appreciation · 3.0% rent growth · sell at horizon
- IRR
- 20.1%
- Equity multiple
- 2.61×
- Total profit
- $144,085
- Equity at exit
- $282,229
- IRR
- 18.4%
- Equity multiple
- 5.93×
- Total profit
- $441,823
- Equity at exit
- $602,308
Cash invested: $89,600 (down + closing). Projections, not guarantees.
Landlord ↔ Tenant lean methodology
- Overall (STATE)
- 38 Tenant-Leaning
- State Colorado
- 38 Tenant-Leaning · D+4
- County
- — inherits STATE
- City
- — inherits STATE
ZIP-level market 80815
- Home prices YoY
- 4.2%
- Active inventory
- 9
- Price-to-rent
- 26.2×
Monthly cashflow live
- Estimated rent
- $2,035 medium interval (Pro) →
- Mortgage (P&I)
- −$1,678
- Tax from tax record
- −$179 /mo · $2,152/yr
- Insurance
- −$133
- HOA
- −$0
- Vacancy / Maint / Mgmt
- −$427
- Net cashflow
- $-383
Break-even live
Sensitivity live
| Price | -10% $-202 | -5% $-293 | +0% $-383 | +5% $-474 | +10% $-564 |
|---|---|---|---|---|---|
| Rent | -10% $-544 | -5% $-464 | +0% $-383 | +5% $-303 | +10% $-222 |
| Rate | -1.0pp $-222 | -0.5pp $-302 | base $-383 | +0.5pp $-466 | +1.0pp $-550 |
2-unit breakdown (identical units grouped — click to expand)
| Units | Beds | Baths | Est. rent |
|---|---|---|---|
| 2× units | 3 | 2 | $2,034 |
| #1 | 3 | 2 | $1,017 |
| #2 | 3 | 2 | $1,017 |
| Total (2 units) | $2,035 | ||
UW: 25.0% down · 7.5% · 30yr · 1.5% tax · 5.0% vac · 8.0% maint · 8.0% mgmt
Financing live
Cash to close
- Down payment
- $80,000
- Closing costs
- $9,600
- Reserves months
- —
- Total cash needed
- —
Loan-product check · same deal, 3 products live
Conventional
25% down · 7.5% · 30yr
- Down + closing
- —
- Monthly P&I
- —
- Monthly cashflow
- —
- DSCR
- —
- Eligible?
- —
Personal DTI + credit; lowest rate.
DSCR
20% down · 8.5% · 30yr
- Down + closing
- —
- Monthly P&I
- —
- Monthly cashflow
- —
- DSCR
- —
- Eligible?
- —
No personal income docs; deal must DSCR.
Hard money
10% down · 12.0% · 12mo
- Down + closing
- —
- Monthly P&I
- —
- Monthly cashflow
- —
- DSCR
- —
- Eligible?
- —
Short-term bridge; refi at stabilization.
Listing history 23 events
-
2026-06-21days on market $320,000 Active 27 DOM
-
2026-06-19days on market $320,000 Active 25 DOM
-
2026-06-18days on market $320,000 Active 24 DOM
-
2026-06-17days on market $320,000 Active 23 DOM
-
2026-06-16days on market $320,000 Active 22 DOM
-
2026-06-15days on market $320,000 Active 21 DOM
-
2026-06-14days on market $320,000 Active 19 DOM
-
2026-06-12days on market $320,000 Active 18 DOM
-
2026-06-09days on market $320,000 Active 15 DOM
-
2026-06-08days on market $320,000 Active 14 DOM
-
2026-06-07days on market $320,000 Active 13 DOM
-
2026-06-05days on market $320,000 Active 11 DOM
-
2026-06-04days on market $320,000 Active 9 DOM
-
2026-06-02days on market $320,000 Active 8 DOM
-
2026-06-01days on market $320,000 Active 7 DOM
-
2026-05-31days on market $320,000 Active 6 DOM
-
2026-05-31days on market $320,000 Active 5 DOM
-
2026-05-18historical $320,000 350-char remark
Show marketing remark (350 chars)
Newer duplex built in 2020 with low maintenance and high rental demand. Each side of the duplex consists of 3 beds and 2 baths. Each unit has their own independent AC, furnace, washer and dryer, and water heater. Tile floor throughout except in the primary bedroom where its carpeted. Located on a corner lot with an irrigation system. Few vacancies.
-
2022-01-31soldstatus $269,900 229-char remark
Show marketing remark (229 chars)
Building is approx 1 year old. Each 3 bed 2 bath unit rents for 1400 month and has few vacancies. All appliances including waher and dryer included. located on a corner lot. Lot has sidewalks, trees, grass and sprinkler system
-
2021-12-03$269,900 229-char remark
Show marketing remark (229 chars)
Building is approx 1 year old. Each 3 bed 2 bath unit rents for 1400 month and has few vacancies. All appliances including waher and dryer included. located on a corner lot. Lot has sidewalks, trees, grass and sprinkler system
-
2021-01-25historical
-
2020-08-09$269,900
ⓘ Source: listings_history table (triggers on properties + properties_extension) + one-shot
backfill from property_details.listing_events for pre-trigger history.
Tax reassessment forecast CO · Resets to sale price
- Current annual tax
- $2,152 · $179/mo
- Projected year-2 tax
- $2,152 · $179/mo
- Expected delta
- $0/yr ($0/mo · 0.0%)
ⓘ Screening estimate from a state-policy table — verify with the county assessor before closing.
Nearby sold comps map
Loading sold comps map…
Walkable amenities ~0.75 mi
Loading nearby amenities…
Taxation est. · year 1
- Rental income
- $24,420
- − Mortgage interest
- −$17,925
- − Property taxes
- −$2,152
- − Insurance
- −$1,600
- − Repairs & maintenance
- −$1,954
- − Management
- −$1,954
- − Depreciation
- −$9,309
- Taxable loss
- −$10,473
- Est. tax savings @ 24.0%
- +$2,514
- After-tax cash flow
- $-2,084/yr
For passive investors: Depreciation is non-cash, so a rental often shows a tax loss while cash-flowing — sheltering income. Rental losses are passive: they offset passive income freely, and up to $25,000/yr can offset ordinary (W-2) income if you actively participate and your MAGI is under $100k (phasing out to $0 by $150k); unused losses carry forward. On sale, claimed depreciation is recaptured at up to 25%, and gains may owe capital-gains tax (a 1031 exchange can defer both). Figures are a year-1 estimate at your 24.0% rate — not tax advice; consult a CPA.
Schools (NCES district)
- District
- Arriba-Flagler Consolidated School District No. 20
- NCES district ID
- 0802260
- Math proficiency
- 20% ▼ -5.00%
- Reading proficiency
- 35% ▲ 5.00%
- Median HH income
- $41,527
- Composite
- 26.23/100
- National rank
- #12701
- State rank
- #125 of 176 in CO
Livability — Flagler
- Score
- 56/100
- State rank
- #323
- US rank
- #22421
Category grades
Schools grade is shown separately in the Schools card above.
Census & demographics
- Census place
- Flagler, CO
- Population (ZIP)
- 895
Population outlook (Kit Carson County) Hauer SSP2
- Today (2025)
- 8,035 people
- By 2030
- 7,910 · -1.6%
- By 2040
- 7,764 · -3.4%
- By 2050
- 7,559 · -5.9%
- By 2075
- 7,359 · -8.4%
- By 2100
- 9,230 · +14.9%
Race, ethnicity, and origin ACS 2023
- Neighborhood character
- Predominantly White (95%)
- Race & ethnicity
- White 95% Two or more races 3% Hispanic / Latino 3%
- Common ancestry
- Slovak 3% Portuguese 2% Lithuanian 2%
- Foreign-born
- 4%
- Languages at home
- 98% English-only · Spanish 2%
Political lean MEDSL · Kit Carson
- 2024 margin
- Solid R (+68.3) · D 15.0% · R 83.4% · Other 1.6%
- 2008→2024 swing
- -23.5pp toward R · 2008: -44.8pp · 2024: -68.3pp
- All cycles
- 2024: R+68.3 2020: R+64.1 2016: R+65.5 2012: R+53.2 2008: R+44.8
Not yet ingested
- Civics
- —
Market trends
- HPI YoY
- ▲ 9.74%
- Current HPI
- 240.2957
- Rent YoY
- —
- Metro
- —
- State GDP YoY
- ▲ 1.95%
- F500 in state
- 14
Industry mix (Fortune 500 HQ in CO)
| Industry | F500 HQs | Revenue |
|---|---|---|
| Technology Distribution | 1 | $31B |
|
||
| Food / Agriculture | 1 | $18B |
|
||
| Packaging | 1 | $14B |
|
||
| Healthcare | 1 | $13B |
|
||
| Energy | 1 | $10B |
|
||
| Technology | 1 | $4B |
|
||
Price history
+18.6% since first listed6 events — show timeline
- 2026-05-18 Coming Soon $320,000 IRES
- 2026-05-18 Coming Soon $320,000 REColorado as Distributed by MLS Grid
- 2022-01-31 Sold (MLS) $269,900 IRES
- 2021-12-03 Listed $269,900 IRES
- 2021-01-25 Listing Removed — IRES
- 2020-08-09 Listed $269,900 IRES
Property tax history
+1.2%/yrLatest (2025): $2,152 · +36.5% YoY. Source: county tax records.
Cash-flow waterfall
monthlySold comps — $/sqft
last 12 mo · ≤1 miLoading sold comps…