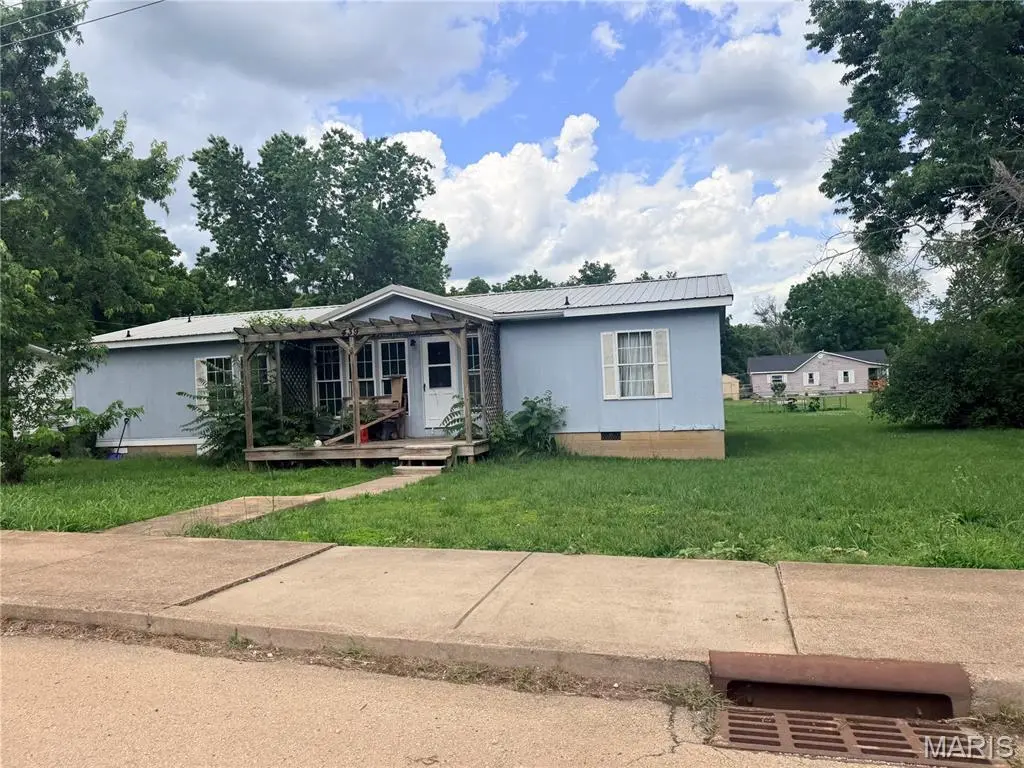
439 E Elvins Blvd · Park Hills, MO
Flood risk 8/10 · Major
- FEMA flood zone
- AE
- Chance of flooding over 30 yrs
- 0.99%
- Est. flood insurance / yr
- $1,737 – $8,500
Fire risk 4/10 · Minor
- Est. fire insurance / yr
- $1,054 – $1,958
Heat risk 4/10 · Minor
- Hot days now (above 104°F)
- 7 days/yr
- Hot days in 30 yrs
- 21 days/yr
Wind risk 2/10 · Minimal
- Chance of severe wind over 30 yrs
- 1.0%
Air-quality risk 1/10 · Minimal
- Unhealthy air days now
- 0 days/yr
- Unhealthy air days in 30 yrs
- 0 days/yr
Risk factors via First Street. Map © Google.
Why this score? — see what drove the B grade
The composite is a weighted blend of 9 inputs, each scored 0–100. Each bar is that input's sub-score; the figure is the points it added to the 100-point composite (weight × sub-score).
- Cash flow +30.0/30.0
- 1% rule +10.0/10.0
- DSCR +10.0/10.0
- ARV discount +7.5/15.0
- Schools +3.4/10.0
- Livability +2.9/5.0
- Rent growth +2.5/5.0
- Condition / age +2.5/5.0
- Appreciation +1.3/10.0
$49,900
🖨 Deal sheet (PDF) 📄 Offer letter ✓ Due diligence
Listing remarks MLS
Don't miss out on this awesome 3 bedroom, 2 bath home on a large double lot. Priced to sell FAST! Large kitchen with lots of counter space and all appliances stay. Master suite has a large soaking tub and lots of counter space. Call to set up showing.
Key facts
- Outdoor recreation
- Near city park
- Spacious double lot
Tags
Property features AI
Finance
- Financial info: Private ownership; Lease not considered
Exterior
- Utilities: Public water; Public sewer; Electricity connected (single phase)
- Home design: Manufactured home; One level
- Construction: Frame and other construction materials; Metal roof
- Exterior features: Asphalt road access; Lot approximately 0.344 acre (100 x 150)
Interior
- Kitchen: Kitchen on the main level
- Bedrooms: Three bedrooms on the main level
- Bathrooms: Two full bathrooms on the main level
- Heating & cooling: Forced air heating; Central air conditioning
- Interior features: Crawl space basement; Seven total rooms
Neighborhood map
What this means for you Summary
Snapshot
- This is a 3-bed/2.0-bath manufactured listed at $50k.
Deal economics
- At list price, monthly cash flow is $141 ($2k/yr) — positive.
- The deal already cash-flows at list — no discount required.
- Meets the 1% rule at list price ($1k rent vs $50k).
- Recommended offer: $49k (1.5% below list) — sets the bar for market timing.
- Cap rate 19.9% vs local median 5.7% in Park Hills — top-decile yield for the area; either an underpriced asset or a hidden risk that comps aren't pricing in. Stress-test before assuming the spread holds.
Location & tenants
- Location reads 58/100 on livability (#585 in MO) — a working-class tenant base; expect higher turnover. Strengths: cost of living A+, housing A+, crime B; Watch: amenities F, commute F, employment F.
- Central R-III (town): math 36% / reading 45% proficiency, ranked #150 of 324 in MO (top 46%) — families likely to look elsewhere, expect single-tenant / working-renter base with shorter leases.
- Zoned schools: West Elem. (math 28% / reading 43%, grade F, #667 of 1,115 statewide, top 60%, 438 students, 54% FRL); Central High (math 52% / reading 62%, grade C, #51 of 521 statewide, top 11%, 629 students, 52% FRL) — zoned schools at 53% FRL track the district average.
- Market conditions: 73 active listings in the ZIP; 134 units permitted in St. Francois County in 2024 (32 in 5+ unit buildings).
Forward outlook
- Local home prices are declining (-3.0%/yr); year-one equity from $345 of loan paydown is wiped out by about $1k of value loss. Plan a longer hold.
- At projected returns (-3.0% appreciation + 3.0% rent growth), your $14k cash investment doubles in ~9 years — after that, you're playing with house money.
Negotiation context
- It's been on market 20 days — a 2% lower offer ($49k) is reasonable based on typical stale-listing flexibility.
- 2 sale attempts since 9y ago with the ask held roughly flat each time — persistent listings suggest the price (not the market) is what's stuck; bring a comps-based counter.
Risks & watch-outs
- Watch-outs: flood insurance adds $427/mo.
- Climate carrying-cost: in FEMA flood zone AE (mandatory federal flood insurance) — expect insurance premiums to compound above CPI over the hold.
Questions for the listing agent
- What's the actual annual flood-insurance premium (NFIP or private), and is the property in a SFHA with mandatory coverage?
- Is there a deadline driving the sale (1031 exchange, divorce, estate, relocation)? That informs how much negotiation room exists.
- Schools are D-rated, which usually means shorter tenancies and higher turnover. Who's the typical renter profile here, and what's been the actual vacancy rate?
- What's the average days-on-market for RENTAL listings here right now (not sales)? A rising rental-DOM trend means longer vacancies and softer asking-rent achievability than the comps imply.
- What's the recent tenant-quality profile in this submarket — average credit score on applications, eviction rate, late-payment / NSF rate, and stable-employment percentage? A property-management company in the area should have these aggregated.
- How much new for-sale + rental construction is in the pipeline within 1–3 miles? Heavy new supply typically softens prices + rents 12–24 months out; constrained supply supports both.
Investment metrics
- 1% rule
- 2.26% ✓
- Cap rate
- 19.93%
- Cash-on-cash
- 48.70%
- DSCR
- 3.17
- GRM
- 3.7
CMA / ARV
No comps found within radius.
Projected returns pro-forma
-3.0% appreciation · 3.0% rent growth · sell at horizon
- IRR
- 2.1%
- Equity multiple
- 1.08×
- Total profit
- $1,131
- Equity at exit
- $7,440
- IRR
- 12.1%
- Equity multiple
- 1.97×
- Total profit
- $13,596
- Equity at exit
- $4,314
Cash invested: $13,972 (down + closing). Projections, not guarantees.
Landlord ↔ Tenant lean methodology
- Overall (STATE)
- 81 Strongly Landlord-Friendly
- State Missouri
- 81 Strongly Landlord-Friendly · R+10
- County
- — inherits STATE
- City
- — inherits STATE
ZIP-level market 63601
- Home prices YoY
- -2.6%
- Active inventory
- 73
- Price-to-rent
- 3.7×
Monthly cashflow live
- Estimated rent
- $1,130 medium interval (Pro) →
- Mortgage (P&I)
- −$262
- Tax from tax record
- −$43 /mo · $520/yr
- Insurance
- −$21
- Flood insurance flood zone
- −$427 /mo · $5,118/yr
- HOA
- −$0
- Vacancy / Maint / Mgmt
- −$237
- Net cashflow
- $141
Break-even live
Sensitivity live
| Price | -10% $169 | -5% $155 | +0% $141 | +5% $126 | +10% $112 |
|---|---|---|---|---|---|
| Rent | -10% $51 | -5% $96 | +0% $141 | +5% $185 | +10% $230 |
| Rate | -1.0pp $166 | -0.5pp $153 | base $141 | +0.5pp $128 | +1.0pp $114 |
UW: 25.0% down · 7.5% · 30yr · 1.5% tax · 5.0% vac · 8.0% maint · 8.0% mgmt
Financing live
Cash to close
- Down payment
- $12,475
- Closing costs
- $1,497
- Reserves months
- —
- Total cash needed
- —
Loan-product check · same deal, 3 products live
Conventional
25% down · 7.5% · 30yr
- Down + closing
- —
- Monthly P&I
- —
- Monthly cashflow
- —
- DSCR
- —
- Eligible?
- —
Personal DTI + credit; lowest rate.
DSCR
20% down · 8.5% · 30yr
- Down + closing
- —
- Monthly P&I
- —
- Monthly cashflow
- —
- DSCR
- —
- Eligible?
- —
No personal income docs; deal must DSCR.
Hard money
10% down · 12.0% · 12mo
- Down + closing
- —
- Monthly P&I
- —
- Monthly cashflow
- —
- DSCR
- —
- Eligible?
- —
Short-term bridge; refi at stabilization.
Listing history 19 events
-
2026-06-18days on market $49,900 Active 20 DOM
-
2026-06-17days on market $49,900 Active 19 DOM
-
2026-06-16days on market $49,900 Active 18 DOM
-
2026-06-15days on market $49,900 Active 17 DOM
-
2026-06-13days on market $49,900 Active 15 DOM
-
2026-06-12days on market $49,900 Active 14 DOM
-
2026-06-09days on market $49,900 Active 11 DOM
-
2026-06-08days on market $49,900 Active 10 DOM
-
2026-06-07days on market $49,900 Active 9 DOM
-
2026-06-05days on market $49,900 Active 7 DOM
-
2026-06-04days on market $49,900 Active 5 DOM
-
2026-06-02days on market $49,900 Active 4 DOM
-
2026-06-01days on market $49,900 Active 3 DOM
-
2026-05-31days on market $49,900 Active 2 DOM
-
2026-05-29$49,900 Active
-
2017-06-02soldstatus Closed 255-char remark
Show marketing remark (255 chars)
Don't miss out on this awesome 3 bedroom, 2 bath home on a large double lot. Priced to sell FAST! Large kitchen with lots of counter space and all appliances stay. Master suite has a large soaking tub and lots of counter space. Call to set up showing.
-
2017-05-12status Pending 255-char remark
Show marketing remark (255 chars)
Don't miss out on this awesome 3 bedroom, 2 bath home on a large double lot. Priced to sell FAST! Large kitchen with lots of counter space and all appliances stay. Master suite has a large soaking tub and lots of counter space. Call to set up showing.
-
2017-04-28$30,000 Active 255-char remark
Show marketing remark (255 chars)
Don't miss out on this awesome 3 bedroom, 2 bath home on a large double lot. Priced to sell FAST! Large kitchen with lots of counter space and all appliances stay. Master suite has a large soaking tub and lots of counter space. Call to set up showing.
-
2016-12-12price $39,900
ⓘ Source: listings_history table (triggers on properties + properties_extension) + one-shot
backfill from property_details.listing_events for pre-trigger history.
Tax reassessment forecast MO · Resets to sale price
- Current annual tax
- $520 · $43/mo
- Projected year-2 tax
- $520 · $43/mo
- Expected delta
- $0/yr ($0/mo · 0.0%)
ⓘ Screening estimate from a state-policy table — verify with the county assessor before closing.
Climate risk First Street
- Flood 8/10 Severe FEMA zone AE · 99% chance over 30 yrs
- Wildfire 4/10 Moderate
- Heat 4/10 Moderate 7 d/yr ≥104°F today · 21 d/yr by 30 yrs out
- Wind 2/10 Low 100% chance of damaging wind over 30 yrs
- Air quality 1/10 Low 0 unhealthy d/yr today · 0 by 30 yrs out
Nearby sold comps map
Loading sold comps map…
Walkable amenities ~0.75 mi
Loading nearby amenities…
Taxation est. · year 1
- Rental income
- $13,562
- − Mortgage interest
- −$2,795
- − Property taxes
- −$520
- − Insurance
- −$5,368
- − Repairs & maintenance
- −$1,085
- − Management
- −$1,085
- − Depreciation
- −$1,452
- Taxable income
- $1,258
- Est. tax owed @ 24.0%
- −$302
- After-tax cash flow
- $1,384/yr
For passive investors: Depreciation is non-cash, so a rental often shows a tax loss while cash-flowing — sheltering income. Rental losses are passive: they offset passive income freely, and up to $25,000/yr can offset ordinary (W-2) income if you actively participate and your MAGI is under $100k (phasing out to $0 by $150k); unused losses carry forward. On sale, claimed depreciation is recaptured at up to 25%, and gains may owe capital-gains tax (a 1031 exchange can defer both). Figures are a year-1 estimate at your 24.0% rate — not tax advice; consult a CPA.
Schools (NCES district)
- District
- Central R-III
- NCES district ID
- 2929170
- Math proficiency
- 36% ▼ -6.00%
- Reading proficiency
- 45% ▼ -4.00%
- Median HH income
- $36,745
- Composite
- 33.61/100
- National rank
- #5410
- State rank
- #150 of 324 in MO
Livability — Park Hills
- Score
- 58/100
- State rank
- #585
- US rank
- #20779
Category grades
Schools grade is shown separately in the Schools card above.
Census & demographics
- Census place
- Park Hills, MO
- Population (ZIP)
- 16,434
Population outlook (St. Francois County) Hauer SSP2
- Today (2025)
- 68,683 people
- By 2030
- 69,574 · +1.3%
- By 2040
- 70,665 · +2.9%
- By 2050
- 70,708 · +2.9%
- By 2075
- 67,917 · -1.1%
- By 2100
- 56,563 · -17.6%
Race, ethnicity, and origin ACS 2023
- Neighborhood character
- Predominantly White (92%)
- Race & ethnicity
- White 92% Two or more races 6% Hispanic / Latino 3%
- Common ancestry
- Lithuanian 2% Italian 2% Romanian 2%
- Foreign-born
- 0%
Political lean MEDSL · St. Francois
- 2024 margin
- Solid R (+51.4) · D 23.8% · R 75.2%
- 2008→2024 swing
- -46.8pp toward R · 2008: -4.6pp · 2024: -51.4pp
- All cycles
- 2024: R+51.4 2020: R+48.1 2016: R+45.4 2012: R+19.5 2008: R+4.6
Not yet ingested
- Civics
- —
Market trends
- HPI YoY
- ▼ -7.30%
- Current HPI
- 278.5365
- Rent YoY
- —
- Metro
- —
- State GDP YoY
- ▲ 1.84%
- F500 in state
- 20
Industry mix (Fortune 500 HQ in MO)
| Industry | F500 HQs | Revenue |
|---|---|---|
| Healthcare | 1 | $163B |
|
||
| Insurance | 1 | $21B |
|
||
| Industrial Technology | 1 | $17B |
|
||
| Retail | 1 | $16B |
|
||
| Industrial Distribution | 1 | $10B |
|
||
| Utilities | 1 | $9B |
|
||
Price history
+25.1% since first listed5 events — show timeline
- 2026-05-29 Listed $49,900 MARIS as Distributed by MLS Grid
- 2017-06-02 Sold (MLS) — MARIS as Distributed by MLS Grid
- 2017-05-12 Pending — MARIS as Distributed by MLS Grid
- 2017-04-28 Listed $30,000 MARIS as Distributed by MLS Grid
- 2016-12-12 Price Changed $39,900 MARIS as Distributed by MLS Grid
Property tax history
+3.1%/yrLatest (2025): $520 · +6.7% YoY. Source: county tax records.
Cash-flow waterfall
monthlySold comps — $/sqft
last 12 mo · ≤1 miLoading sold comps…