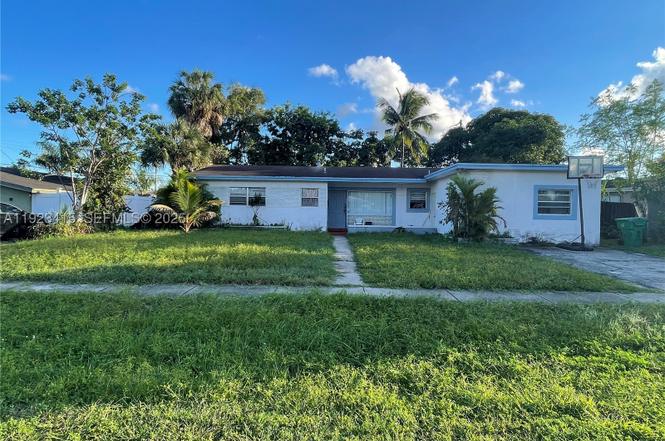
3880 NW 6th St · Lauderhill, FL
Flood risk 1/10 · Minimal
- FEMA flood zone
- X (shaded)
- Chance of flooding over 30 yrs
- 0.0%
- Est. flood insurance / yr
- $507 – $1,088
Fire risk 1/10 · Minimal
- Est. fire insurance / yr
- $947 – $1,759
Heat risk 9/10 · Severe
- Hot days now (above 105°F)
- 5 days/yr
- Hot days in 30 yrs
- 18 days/yr
Wind risk 10/10 · Severe
- Chance of severe wind over 30 yrs
- 99.0%
Air-quality risk 2/10 · Minimal
- Unhealthy air days now
- 2 days/yr
- Unhealthy air days in 30 yrs
- 2 days/yr
Risk factors via First Street. Map © Google.
Why this score? — see what drove the D+ grade
The composite is a weighted blend of 9 inputs, each scored 0–100. Each bar is that input's sub-score; the figure is the points it added to the 100-point composite (weight × sub-score).
- ARV discount +15.0/15.0
- Cash flow +13.5/30.0
- DSCR +4.1/10.0
- Schools +4.1/10.0
- Livability +4.0/5.0
- Rent growth +3.2/5.0
- 1% rule +2.8/10.0
- Condition / age +2.5/5.0
- Appreciation +0.0/10.0
$400,000
🖨 Deal sheet (PDF) 📄 Offer letter ✓ Due diligence
Listing remarks
DISCOVER A SOLID AS-IS OPPORTUNITY WITH SIGNIFICANT POTENTIAL FOR THE RIGHT BUYER. THIS HOME FEATURES A GARAGE CONVERSION CREATING AN ADDITIONAL BEDROOM, A FLORIDA ROOM, AND AN EXTRA FLEXIBLE SPACE THAT EXPANDS THE FUNCTION AND FLOW OF THE HOME. THE PROPERTY ALSO OFFERS A VARIETY OF FRUIT TREES, ADDING VALUE AND OUTDOOR ENJOYMENT. IDEAL FOR BUYERS WHO SEE THE VALUE IN MAKING SMART UPDATES AND CREATING LONG-TERM BENEFITS. THE LAYOUT PROVIDES FLEXIBILITY FOR RECONFIGURATION, ENHANCEMENT, OR FUTURE IMPROVEMENTS. WITH CARE AND IMAGINATION, THIS HOME CAN BECOME A HIGHLY FUNCTIONAL LIVING SPACE OR A STRONG FUTURE HOLD. A GREAT OPPORTUNITY FOR THOSE WHO KNOW HOW TO CAPITALIZE ON POTENTIAL.
Key facts
- Flexible space
- Garage conversion
- Florida room
Tags
Property features AI
Finance
- HOA & community: Street lights; Sidewalks
Exterior
- Parking: Driveway
- Utilities: Public water; Public sewer
- Home design: Single-story; Block construction; Shingle roof; Effective year built
- Construction: Block construction; Shingle roof; Effective year built
- Exterior features: Patio; Lot smaller than a quarter acre; North-facing
Interior
- Kitchen: Refrigerator included
- Bedrooms: Converted garage (used as a room); Florida room (additional living space)
- Flooring: Tile flooring
- Bathrooms: 2 full bathrooms
- Heating & cooling: Central heating (electric); Central air conditioning (electric)
- Interior features: First-floor entry; Bedroom located on the main level
Neighborhood map
What this means for you Summary
Snapshot
- This is a 3-bed/2.0-bath single-family listed at $400k.
Deal economics
- At list price, monthly cash flow is $15 ($185/yr) — positive.
- The deal already cash-flows at list — no discount required.
- To meet the 1% rule (rent ≥ 1% of price), the offer needs to be $310k (22.5% below list).
- Recommended offer: $310k (22.5% below list) — sets the bar for 1% rule.
- Cap rate 6.3% vs local median 4.3% in Lauderhill — top-decile yield for the area; either an underpriced asset or a hidden risk that comps aren't pricing in. Stress-test before assuming the spread holds.
Location & tenants
- Location reads 79/100 on livability (#139 in FL, #2,059 nationally) — a middle-class / working-renter tenant base. Strengths: commute A+, cost of living A+, housing A+; Watch: schools D, employment D, amenities F.
- Broward (suburban): math 42% / reading 53% proficiency, ranked #46 of 73 in FL (top 63%) — families likely to look elsewhere, expect single-tenant / working-renter base with shorter leases.
- Market conditions: Rents rising (+2.8%/yr); 585 active listings in the ZIP; 40 comparable units currently listed for rent nearby; rentals at typical pace (median 25d on market — plan ~3-4 weeks tenant-placement turnaround); 2,111 units permitted in Broward County in 2024 (1,265 in 5+ unit buildings).
- At $3,102/mo this rent would consume 69% of the median local household income ($54k/yr) (locally 5068% of renters already pay >50% of income on rent) — very limited rent-growth headroom before tenants either downsize or default.
Forward outlook
- Local home prices are declining (-3.0%/yr); year-one equity from $3k of loan paydown is wiped out by about $12k of value loss. Plan a longer hold.
- Broward County population projected at +34% by 2050 — long-run rental-demand tailwind backs the buy-and-hold thesis.
Negotiation context
- It's been on market 199 days — a 12% lower offer ($352k) is reasonable based on typical stale-listing flexibility.
- 2 sale attempts since 2y ago with the ask held roughly flat each time — persistent listings suggest the price (not the market) is what's stuck; bring a comps-based counter.
- Current owner paid $124k; list at $400k implies a 221% gain — meaningful room to come down on a strong offer.
Risks & watch-outs
- Watch-outs: built in 1959 — expect roof / HVAC / electrical / plumbing capex.
- Climate carrying-cost: severe wind risk, 99% chance of damaging wind over 30y; extreme-heat days projected 5→18/yr by 2055 (HVAC capex compounding) — expect insurance premiums to compound above CPI over the hold.
Questions for the listing agent
- It's been on market 199 days. Have you received any prior offers? Is the seller open to a 22% concession, seller financing, or rate buy-down credit?
- Built in 1959 — when were the roof, HVAC, electrical panel, plumbing, and water heater last replaced?
- Why hasn't it sold? Are there any deal-killer items the seller is aware of (foundation, flood, title, zoning, code violations)?
- Is there a deadline driving the sale (1031 exchange, divorce, estate, relocation)? That informs how much negotiation room exists.
- Schools are D-rated, which usually means shorter tenancies and higher turnover. Who's the typical renter profile here, and what's been the actual vacancy rate?
- The area grade is low — what's the realistic commute time and amenity access for the typical tenant pool here? Any planned neighborhood developments (good or bad) we should know about?
- What's the average days-on-market for RENTAL listings here right now (not sales)? A rising rental-DOM trend means longer vacancies and softer asking-rent achievability than the comps imply.
- What's the recent tenant-quality profile in this submarket — average credit score on applications, eviction rate, late-payment / NSF rate, and stable-employment percentage? A property-management company in the area should have these aggregated.
- How much new for-sale + rental construction is in the pipeline within 1–3 miles? Heavy new supply typically softens prices + rents 12–24 months out; constrained supply supports both.
Investment metrics
- 1% rule
- 0.78% ✗
- Cap rate
- 6.34%
- Cash-on-cash
- 0.17%
- DSCR
- 1.01
- GRM
- 10.7
CMA / ARV
- ARV (on-the-fly)
- $524,536
- Comps found
- 4
Show comp detail 4 sales within ~0.75 mi
| Address | Dist | Beds/Ba | Sqft | Sold | Price | $/sf | Match |
|---|---|---|---|---|---|---|---|
| 551 NW 35th Ave | 0.34mi | 3/2.0 | 1,404 (-7%) | 15mo | $365,000 | $260 | 59 |
| 3651 NW 8th Ct | 0.42mi | 3/2.0 | 1,369 (-10%) | 20mo | $460,000 | $336 | 48 |
| 16 NW 42nd Ter | 0.53mi | 3/2.0 | 1,356 (-11%) | 17mo | $550,000 | $406 | 44 |
| 3490 NW 3rd St | 0.47mi | 3/2.0 | 1,302 (-14%) | 24mo | $450,000 | $346 | 34 |
Match score weights: distance 35% · size 25% · config 20% · recency 20%. Top-matched comps best support the ARV.
Projected returns pro-forma
-3.0% appreciation · 2.78% rent growth · sell at horizon
- IRR
- -16.3%
- Equity multiple
- 0.42×
- Total profit
- $-64,675
- Equity at exit
- $59,641
- IRR
- -8.4%
- Equity multiple
- 0.48×
- Total profit
- $-58,483
- Equity at exit
- $34,585
Cash invested: $112,000 (down + closing). Projections, not guarantees.
Landlord ↔ Tenant lean methodology
- Overall (STATE)
- 87 Strongly Landlord-Friendly
- State Florida
- 87 Strongly Landlord-Friendly · R+3
- County
- — inherits STATE
- City
- — inherits STATE
ZIP-level market 33311
- Rents YoY
- 2.8%
- Active inventory
- 585
- Price-to-rent
- 10.7×
Monthly cashflow live
- Estimated rent
- $3,102 high interval (Pro) →
- Mortgage (P&I)
- −$2,098
- Tax from tax record
- −$170 /mo · $2,045/yr
- Insurance
- −$167
- HOA
- −$0
- Vacancy / Maint / Mgmt
- −$651
- Net cashflow
- $15
Break-even live
Sensitivity live
| Price | -10% $242 | -5% $129 | +0% $15 | +5% $-98 | +10% $-211 |
|---|---|---|---|---|---|
| Rent | -10% $-230 | -5% $-107 | +0% $15 | +5% $138 | +10% $260 |
| Rate | -1.0pp $217 | -0.5pp $117 | base $15 | +0.5pp $-88 | +1.0pp $-194 |
UW: 25.0% down · 7.5% · 30yr · 1.5% tax · 5.0% vac · 8.0% maint · 8.0% mgmt
Financing live
Cash to close
- Down payment
- $100,000
- Closing costs
- $12,000
- Reserves months
- —
- Total cash needed
- —
Loan-product check · same deal, 3 products live
Conventional
25% down · 7.5% · 30yr
- Down + closing
- —
- Monthly P&I
- —
- Monthly cashflow
- —
- DSCR
- —
- Eligible?
- —
Personal DTI + credit; lowest rate.
DSCR
20% down · 8.5% · 30yr
- Down + closing
- —
- Monthly P&I
- —
- Monthly cashflow
- —
- DSCR
- —
- Eligible?
- —
No personal income docs; deal must DSCR.
Hard money
10% down · 12.0% · 12mo
- Down + closing
- —
- Monthly P&I
- —
- Monthly cashflow
- —
- DSCR
- —
- Eligible?
- —
Short-term bridge; refi at stabilization.
Rent comps 40 comps
| Address | Beds | Baths | Sqft | Rent | $/sqft | DOM | Units | Dist |
|---|---|---|---|---|---|---|---|---|
| 3811 NW 6th Pl Lauderhill, FL | 3.0 | 2.0 | 1528 | $3,900 | $2.55 | 5d | 1 | 0.13mi |
| 600 NW 38th Ave Lauderhill, FL | 4.0 | 2.0 | 1428 | $2,700 | $1.89 | 24d | 1 | 0.16mi |
| 331 NW 39th Ave #1 Plantation, FL | 4.0 | 1.0 | 1096 | $3,000 | $2.74 | 24d | 1 | 0.29mi |
| 335 N State Road 7 Plantation, FL | 1.0–3.0 | 1.0–2.0 | 1051 | $3,000 | $2.85 | 2d | 26 | 0.31mi |
| 3860 NW 8th Pl Lauderhill, FL | 3.0 | 1.0 | 1241 | $2,700 | $2.18 | 22d | 1 | 0.37mi |
| 3651 NW 8th Ct Lauderhill, FL | 3.0 | 2.0 | 1369 | $3,250 | $2.37 | 5d | 1 | 0.40mi |
| 3651 NW 8th Ct Lauderhill, FL | 3.0 | 2.0 | 1369 | $3,500 | $2.56 | 18d | 1 | 0.40mi |
| 677 NW 42nd Ave #677 Plantation, FL | 3.0 | 2.5 | 1672 | $2,400 | $1.44 | 8d | 1 | 0.43mi |
| 677 NW 42nd Ave #677 Plantation, FL | 3.0 | 2.5 | 1672 | $2,500 | $1.50 | 24d | 1 | 0.43mi |
| 681 NW 42nd Ave Plantation, FL | 3.0 | 2.5 | 1558 | $2,950 | $1.89 | 24d | 1 | 0.43mi |
| 309 NW 43rd Ave Plantation, FL | 3.0 | 2.0 | 1234 | $3,500 | $2.84 | 24d | 1 | 0.43mi |
| 3740 NW 9th St Lauderhill, FL | 3.0 | 2.0 | 1208 | $2,900 | $2.40 | 8d | 1 | 0.45mi |
| 3451 NW 6th St Lauderhill, FL | 4.0 | 2.0 | 1700 | $3,000 | $1.76 | 24d | 1 | 0.50mi |
| 3440 NW 4th St Lauderhill, FL | 3.0 | 2.0 | 1525 | $2,900 | $1.90 | 24d | 1 | 0.56mi |
| 891 NW 34th Way Lauderhill, FL | 3.0 | 2.0 | 1283 | $2,950 | $2.30 | 24d | 1 | 0.60mi |
| 545 NW 46th Ave Plantation, FL | 3.0 | 2.0 | 1442 | $4,000 | $2.77 | 24d | 1 | 0.60mi |
| 4384 NW 9th St Unit 4384 Plantation, FL | 3.0 | 2.5 | 1616 | $3,550 | $2.20 | 24d | 1 | 0.62mi |
| 4411 W Broward Blvd Plantation, FL | 2.0 | 2.0 | 1349 | $2,800 | $2.08 | 24d | 1 | 0.62mi |
| 4393 NW 9th St Unit 4393 Plantation, FL | 3.0 | 2.5 | 1616 | $3,500 | $2.17 | 24d | 1 | 0.63mi |
| 3551 SW 1st St Fort Lauderdale, FL | 4.0 | 2.0 | 1720 | $3,150 | $1.83 | 24d | 1 | 0.67mi |
| 180 Penn Way Fort Lauderdale, FL | 4.0 | 2.0 | 1378 | $3,550 | $2.58 | 8d | 1 | 0.69mi |
| 4032 NW 11th St Unit 4032 Lauderhill, FL | 3.0 | 2.5 | 1496 | $2,800 | $1.87 | 24d | 1 | 0.72mi |
| 913 NW 45th Ter Unit 913 Plantation, FL | 3.0 | 2.5 | 1616 | $3,525 | $2.18 | 24d | 1 | 0.72mi |
| 720 NW 33rd Ter Lauderhill, FL | 3.0 | 1.0 | 1340 | $2,560 | $1.91 | 22d | 1 | 0.73mi |
| 4044 NW 11th St Unit 4044 Lauderhill, FL | 3.0 | 2.5 | 1496 | $2,600 | $1.74 | 17d | 1 | 0.73mi |
| 4002 NW 11th Dr Plantation, FL | 3.0 | 2.5 | 1496 | $2,900 | $1.94 | 24d | 1 | 0.78mi |
| 410 Pennsylvania Ave Fort Lauderdale, FL | 3.0 | 2.0 | 1928 | $3,600 | $1.87 | 24d | 1 | 0.83mi |
| 483 W Melrose Cir Fort Lauderdale, FL | 3.0 | 2.0 | 1560 | $3,500 | $2.24 | 24d | 1 | 0.92mi |
| 540 NW 31st Ave Fort Lauderdale, FL | 4.0 | 2.0 | 1097 | $2,900 | $2.64 | 8d | 1 | 0.93mi |
| 3484 NW 13th St Fort Lauderdale, FL | 2.0 | 2.5 | 1120 | $2,100 | $1.88 | 24d | 1 | 1.06mi |
| 3507 NW 13th St Unit 3507 Lauderhill, FL | 2.0 | 2.5 | 1120 | $2,450 | $2.19 | 5d | 1 | 1.07mi |
| 649 W Evanston Cir Fort Lauderdale, FL | 4.0 | 2.0 | 1576 | $3,315 | $2.10 | 24d | 1 | 1.08mi |
| 3429 NW 13th St Fort Lauderdale, FL | 3.0 | 2.5 | 1120 | $2,595 | $2.32 | 24d | 1 | 1.11mi |
| 4330 SW 7th St Plantation, FL | 3.0 | 2.0 | 2148 | $5,000 | $2.33 | 24d | 1 | 1.11mi |
| 2900 NW 5th Ct Fort Lauderdale, FL | 4.0 | 2.0 | 1112 | $3,250 | $2.92 | 19d | 1 | 1.12mi |
| 1370 NW 34th Way #1370 Lauderhill, FL | 3.0 | 2.0 | 1360 | $2,650 | $1.95 | 21d | 1 | 1.13mi |
| 510 E Acre Dr Plantation, FL | 3.0 | 2.0 | 1450 | $4,600 | $3.17 | 14d | 1 | 1.16mi |
| 510 E Acre Dr Plantation, FL | 3.0 | 2.0 | 1450 | $3,950 | $2.72 | 11d | 1 | 1.16mi |
| 3416 NW 14th Ct Fort Lauderdale, FL | 2.0 | 2.5 | 1248 | $2,090 | $1.67 | 24d | 1 | 1.17mi |
| 4350 NW 14th St Lauderhill, FL | 3.0 | 3.0 | 1590 | $3,500 | $2.20 | 24d | 1 | 1.18mi |
Listing history 17 events
-
2026-06-18days on market $400,000 Active 199 DOM
-
2026-06-17days on market $400,000 Active 198 DOM
-
2026-06-16days on market $400,000 Active 197 DOM
-
2026-06-15days on market $400,000 Active 196 DOM
-
2026-06-13days on market $400,000 Active 194 DOM
-
2026-06-09days on market $400,000 Active 190 DOM
-
2026-06-07days on market $400,000 Active 188 DOM
-
2026-06-04days on market $400,000 Active 185 DOM
-
2026-06-03days on market $400,000 Active 184 DOM
-
2026-06-02days on market $400,000 Active 183 DOM
-
2026-06-01days on market $400,000 Active 182 DOM
-
2026-05-31days on market $400,000 Active 181 DOM
-
2025-11-25$400,000 Active
-
2024-09-12historical
-
2024-06-05$360,000 Active
-
2003-11-05soldstatus $124,500
-
1981-04-01soldstatus $45,900
ⓘ Source: listings_history table (triggers on properties + properties_extension) + one-shot
backfill from property_details.listing_events for pre-trigger history.
Tax reassessment forecast FL · Resets to sale price
- Current annual tax
- $2,045 · $170/mo
- Projected year-2 tax
- $3,320 · $277/mo
- Expected delta
- +$1,275/yr (+$106/mo · 62.3%)
ⓘ Screening estimate from a state-policy table — verify with the county assessor before closing.
Climate risk First Street
- Flood 1/10 Low FEMA zone X (shaded) · 0% chance over 30 yrs
- Wildfire 1/10 Low
- Heat 9/10 Extreme 5 d/yr ≥105°F today · 18 d/yr by 30 yrs out
- Wind 10/10 Extreme 99% chance of damaging wind over 30 yrs
- Air quality 2/10 Low 2 unhealthy d/yr today · 2 by 30 yrs out
Nearby sold comps map
Loading sold comps map…
Walkable amenities ~0.75 mi
Loading nearby amenities…
Taxation est. · year 1
- Rental income
- $37,218
- − Mortgage interest
- −$22,406
- − Property taxes
- −$2,045
- − Insurance
- −$2,000
- − Repairs & maintenance
- −$2,977
- − Management
- −$2,977
- − Depreciation
- −$11,636
- Taxable loss
- −$6,825
- Est. tax savings @ 24.0%
- +$1,638
- After-tax cash flow
- $1,823/yr
For passive investors: Depreciation is non-cash, so a rental often shows a tax loss while cash-flowing — sheltering income. Rental losses are passive: they offset passive income freely, and up to $25,000/yr can offset ordinary (W-2) income if you actively participate and your MAGI is under $100k (phasing out to $0 by $150k); unused losses carry forward. On sale, claimed depreciation is recaptured at up to 25%, and gains may owe capital-gains tax (a 1031 exchange can defer both). Figures are a year-1 estimate at your 24.0% rate — not tax advice; consult a CPA.
Schools (NCES district)
- District
- Broward
- NCES district ID
- 1200180
- Math proficiency
- 42% ▼ -18.00%
- Reading proficiency
- 53% ▼ -5.00%
- Median HH income
- $52,139
- Composite
- 40.88/100
- National rank
- #3621
- State rank
- #46 of 73 in FL
Livability — Lauderhill
- Score
- 79/100
- State rank
- #139
- US rank
- #2059
Category grades
Schools grade is shown separately in the Schools card above.
Census & demographics
- Census place
- Lauderhill, FL
- County
- Broward County · 1,963,430 people
- City population
- 62,807
- Metro
- Miami-Fort Lauderdale-Pompano Beach, FL
- Population (ZIP)
- 74,898
- Household income
- $53,973
- Rent vs Own
- Severe rent burden
- 5068.0
Population outlook (Broward County) Hauer SSP2
- Today (2025)
- 2,207,033 people
- By 2030
- 2,360,704 · +7.0%
- By 2040
- 2,661,208 · +20.6%
- By 2050
- 2,946,698 · +33.5%
- By 2075
- 3,602,273 · +63.2%
- By 2100
- 3,970,984 · +79.9%
Race, ethnicity, and origin ACS 2023
- Neighborhood character
- Predominantly Black (77%)
- Race & ethnicity
- Black 77% Two or more races 9% White 9% Hispanic / Latino 9%
- Hispanic origin (detail)
- Mexican 1% Puerto Rican 2% Cuban 1%
- Common ancestry
- Hispanic 15% Lithuanian 1% Romanian 0%
- Foreign-born
- 24% · Canada, Jamaica
- Languages at home
- 78% English-only · French/Haitian/Cajun 14% Spanish 6% Other Indo-European 1%
Political lean MEDSL · Broward
- 2024 margin
- D (+17.0) · D 58.0% · R 41.0%
- 2008→2024 swing
- -17.8pp toward R · 2008: 34.7pp · 2024: 17.0pp
- All cycles
- 2024: D+17.0 2020: D+29.8 2016: D+35.0 2012: D+34.9 2008: D+34.7
Not yet ingested
- Civics
- —
Market trends
- HPI YoY
- ▼ -300.68%
- Current HPI
- 535.2504
- Rent YoY
- ▲ 2.78%
- Metro
- Miami-Fort Lauderdale-Pompano Beach, FL
- State GDP YoY
- ▲ 3.28%
- F500 in state
- 36
Industry mix (Fortune 500 HQ in FL)
| Industry | F500 HQs | Revenue |
|---|---|---|
| Industrial Technology | 2 | $29B |
|
||
| Insurance | 2 | $17B |
|
||
| Retail | 1 | $60B |
|
||
| Technology Distribution | 1 | $58B |
|
||
| Homebuilding | 1 | $35B |
|
||
| Technology Manufacturing | 1 | $35B |
|
||
Price history
+771.5% since first listed5 events — show timeline
- 2025-11-25 Listed $400,000 MARMLS
- 2024-09-12 Listing Removed — MARMLS
- 2024-06-05 Listed $360,000 MARMLS
- 2003-11-05 Sold (Public Records) $124,500 Public Records
- 1981-04-01 Sold (Public Records) $45,900 Public Records
Property tax history
+3.4%/yrLatest (2025): $2,045 · +0.7% YoY. Source: county tax records.
Cash-flow waterfall
monthlySold comps — $/sqft
last 12 mo · ≤1 miLoading sold comps…