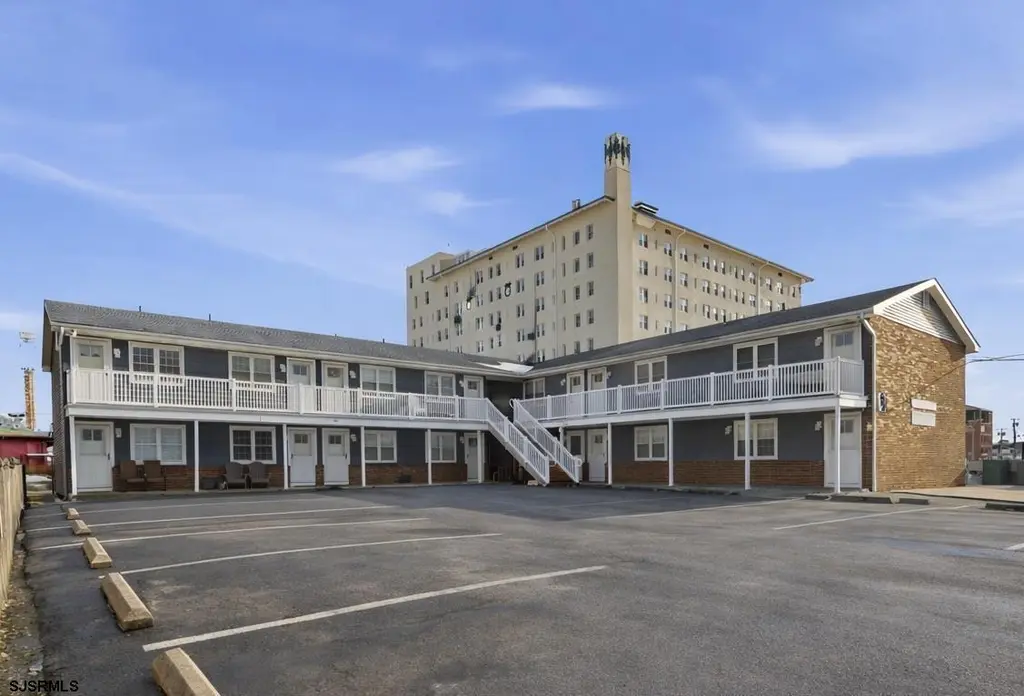
1027 Ocean Ave #5 · Ocean City, NJ
Flood risk No data
- FEMA flood zone
- —
- Chance of flooding over 30 yrs
- —
- Est. flood insurance / yr
- —
Fire risk No data
- Est. fire insurance / yr
- —
Heat risk No data
- Hot days now (above threshold)
- —
- Hot days in 30 yrs
- —
Wind risk No data
- Chance of severe wind over 30 yrs
- —
Air-quality risk No data
- Unhealthy air days now
- —
- Unhealthy air days in 30 yrs
- —
Risk factors via First Street. Map © Google.
Why this score? — see what drove the B- grade
The composite is a weighted blend of 9 inputs, each scored 0–100. Each bar is that input's sub-score; the figure is the points it added to the 100-point composite (weight × sub-score).
- Cash flow +30.0/30.0
- DSCR +10.0/10.0
- 1% rule +8.7/10.0
- ARV discount +7.5/15.0
- Livability +4.0/5.0
- Schools +3.7/10.0
- Rent growth +2.5/5.0
- Condition / age +2.5/5.0
- Appreciation +0.0/10.0
$499,000
🖨 Deal sheet (PDF) 📄 Offer letter ✓ Due diligence
Listing remarks MLS
Get ready for summertime in this 2-bedroom 1-bathroom condo, which has been beautifully maintained and is move-in ready. It offers comfort, efficiency, and an unbeatable location close to the beach, boardwalk, and all that Ocean City has to offer. Recent improvements include upgraded electric, energy-efficient mini-split systems installed in 2021 for heating and cooling, and a newly renovated bathroom featuring radiant heated floors for added comfort year-round. Enjoy the outside shower, coin-operated laundry room, and beach chair storage that come with the unit. Perfect as a shore getaway, investment property, or easy coastal retreat, this well-cared-for unit combines modern updates with convenient access to Ocean City’s best attractions.
Key facts
- Upgraded electric
- Outside shower
- Beach chair storage
Tags
Neighborhood map
What this means for you Summary
Snapshot
- This is a 2-bed/1.0-bath condo listed at $499k.
Deal economics
- At list price, monthly cash flow is $2k ($25k/yr) — positive.
- The deal already cash-flows at list — no discount required.
- Meets the 1% rule at list price ($7k rent vs $499k).
- Recommended offer: $454k (9.0% below list) — sets the bar for market timing.
- Cap rate 11.4% vs local median 3.3% in Ocean City — top-decile yield for the area; either an underpriced asset or a hidden risk that comps aren't pricing in. Stress-test before assuming the spread holds.
Location & tenants
- Location reads 80/100 on livability (#72 in NJ, #1,762 nationally) — a professional / high-income tenant draw. Strengths: amenities A+, employment A+, health & safety A+; Watch: housing D+, cost of living F.
- Ocean City School District (urban): math 31% / reading 53% proficiency, ranked #212 of 472 in NJ (top 45%) — families likely to look elsewhere, expect single-tenant / working-renter base with shorter leases.
- Zoned schools: Ocean City Primary School (math 54% / reading 42%, grade D, #299 of 1,303 statewide, top 23%, 280 students, 31% FRL); Ocean City Intermediate School (math 26% / reading 49%, grade F, #217 of 431 statewide, top 51%, 370 students, 27% FRL); Ocean City High School (math 33% / reading 63%, grade D, #117 of 399 statewide, top 30%, 1,215 students, 13% FRL) — zoned schools at 24% FRL track the district average.
- Market conditions: 427 active listings in the ZIP; 2 comparable units currently listed for rent nearby; 877 units permitted in Cape May County in 2024 (35 in 5+ unit buildings).
Forward outlook
- Local home prices are declining (-3.0%/yr); year-one equity from $3k of loan paydown is wiped out by about $15k of value loss. Plan a longer hold.
- Cape May County population projected at -24% by 2050 — secular population decline; favor cash flow + early exit over multi-decade hold.
- At projected returns (-3.0% appreciation + 3.0% rent growth), your $140k cash investment doubles in ~7 years — after that, you're playing with house money.
Negotiation context
- It's been on market 103 days — a 9% lower offer ($454k) is reasonable based on typical stale-listing flexibility.
- 2 sale attempts since 11y ago with the ask held roughly flat each time — persistent listings suggest the price (not the market) is what's stuck; bring a comps-based counter.
- Current owner paid $170k; list at $499k implies a 194% gain — meaningful room to come down on a strong offer.
Questions for the listing agent
- It's been on market 103 days. Have you received any prior offers? Is the seller open to a 9% concession, seller financing, or rate buy-down credit?
- Built in 1968 — when were the roof, HVAC, electrical panel, plumbing, and water heater last replaced?
- What does the HOA fee cover, when was the last increase, and are there any pending special assessments or reserve-fund shortfalls?
- Any open or pending special assessments — roof, HVAC, plumbing, elevator, façade? What's the per-unit balance and payoff schedule, and is the seller paying it off at close or rolling it to the buyer?
- Why hasn't it sold? Are there any deal-killer items the seller is aware of (foundation, flood, title, zoning, code violations)?
- Is there a deadline driving the sale (1031 exchange, divorce, estate, relocation)? That informs how much negotiation room exists.
- Schools are A-rated — typically a magnet for longer-tenancy family renters. What's the average tenant stay here, and is there a school-zone premium baked into asking?
- What's the average days-on-market for RENTAL listings here right now (not sales)? A rising rental-DOM trend means longer vacancies and softer asking-rent achievability than the comps imply.
- What's the recent tenant-quality profile in this submarket — average credit score on applications, eviction rate, late-payment / NSF rate, and stable-employment percentage? A property-management company in the area should have these aggregated.
- How much new apartment / multifamily construction is in the pipeline within 1–3 miles? Heavy new supply (>2% of stock underway) typically softens rents 12–24 months out; light construction supports rent growth.
Investment metrics
- 1% rule
- 1.37% ✓
- Cap rate
- 11.35%
- Cash-on-cash
- 18.08%
- DSCR
- 1.80
- GRM
- 6.1
CMA / ARV
No comps found within radius.
Projected returns pro-forma
-3.0% appreciation · 3.0% rent growth · sell at horizon
- IRR
- 9.7%
- Equity multiple
- 1.38×
- Total profit
- $53,198
- Equity at exit
- $74,403
- IRR
- 18.8%
- Equity multiple
- 2.57×
- Total profit
- $218,947
- Equity at exit
- $43,144
Cash invested: $139,720 (down + closing). Projections, not guarantees.
Landlord ↔ Tenant lean methodology
- Overall (STATE)
- 21 Tenant-Leaning
- State New Jersey
- 21 Tenant-Leaning · D+6
- County
- — inherits STATE
- City
- — inherits STATE
ZIP-level market 08226
- Active inventory
- 427
- Price-to-rent
- 6.1×
Monthly cashflow live
- Estimated rent
- $6,819 medium interval (Pro) →
- Mortgage (P&I)
- −$2,617
- Tax from tax record
- −$220 /mo · $2,645/yr
- Insurance
- −$208
- HOA
- −$237
- Vacancy / Maint / Mgmt
- −$1,432
- Net cashflow
- $2,105
Break-even live
Sensitivity live
| Price | -10% $2,387 | -5% $2,246 | +0% $2,105 | +5% $1,964 | +10% $1,822 |
|---|---|---|---|---|---|
| Rent | -10% $1,566 | -5% $1,835 | +0% $2,105 | +5% $2,374 | +10% $2,644 |
| Rate | -1.0pp $2,356 | -0.5pp $2,232 | base $2,105 | +0.5pp $1,976 | +1.0pp $1,844 |
UW: 25.0% down · 7.5% · 30yr · 1.5% tax · 5.0% vac · 8.0% maint · 8.0% mgmt
Financing live
Cash to close
- Down payment
- $124,750
- Closing costs
- $14,970
- Reserves months
- —
- Total cash needed
- —
Loan-product check · same deal, 3 products live
Conventional
25% down · 7.5% · 30yr
- Down + closing
- —
- Monthly P&I
- —
- Monthly cashflow
- —
- DSCR
- —
- Eligible?
- —
Personal DTI + credit; lowest rate.
DSCR
20% down · 8.5% · 30yr
- Down + closing
- —
- Monthly P&I
- —
- Monthly cashflow
- —
- DSCR
- —
- Eligible?
- —
No personal income docs; deal must DSCR.
Hard money
10% down · 12.0% · 12mo
- Down + closing
- —
- Monthly P&I
- —
- Monthly cashflow
- —
- DSCR
- —
- Eligible?
- —
Short-term bridge; refi at stabilization.
Rent comps 2 comps
| Address | Beds | Baths | Sqft | Rent | $/sqft | DOM | Units | Dist |
|---|---|---|---|---|---|---|---|---|
| 714 West Ave Unit 1308989P Ocean City, NJ | 2.0 | 1.0 | 742 | $6,384 | $8.60 | 45d | 1 | 0.45mi |
| 200 Bay Ave Unit 200 Ocean City, NJ | 1.0 | 1.0 | 425 | $7,800 | $18.35 | 22d | 1 | 1.08mi |
HOA detail condo
- Monthly dues
- $237 · $2,844/yr
- Likely covers
- electric
- Assessments
- None detected in remarks — confirm with the listing agent.
Listing history 8 events
-
2026-02-13$499,000 Active 755-char remark
Show marketing remark (755 chars)
Get ready for summertime in this 2-bedroom 1-bathroom condo, which has been beautifully maintained and is move-in ready. It offers comfort, efficiency, and an unbeatable location close to the beach, boardwalk, and all that Ocean City has to offer. Recent improvements include upgraded electric, energy-efficient mini-split systems installed in 2021 for heating and cooling, and a newly renovated bathroom featuring radiant heated floors for added comfort year-round. Enjoy the outside shower, coin-operated laundry room, and beach chair storage that come with the unit. Perfect as a shore getaway, investment property, or easy coastal retreat, this well-cared-for unit combines modern updates with convenient access to Ocean City’s best attractions.
-
2015-06-23soldstatus $170,000
-
2015-06-02soldstatus $170,000 Sold 290-char remark
Show marketing remark (290 chars)
Dolphin Court, 2 bedroom, 1 bath condo, 1st floor unit. Steps to the beach and boardwalk, amusements, restaurants, and action! Great for owner use or as a rental property. Pets permitted for owners. A rare find in OC condo living! Easy to show. Bring an offer today in time for the season.
-
2015-05-19historical Under Contract 290-char remark
Show marketing remark (290 chars)
Dolphin Court, 2 bedroom, 1 bath condo, 1st floor unit. Steps to the beach and boardwalk, amusements, restaurants, and action! Great for owner use or as a rental property. Pets permitted for owners. A rare find in OC condo living! Easy to show. Bring an offer today in time for the season.
-
2015-03-27$229,900 Active 290-char remark
Show marketing remark (290 chars)
Dolphin Court, 2 bedroom, 1 bath condo, 1st floor unit. Steps to the beach and boardwalk, amusements, restaurants, and action! Great for owner use or as a rental property. Pets permitted for owners. A rare find in OC condo living! Easy to show. Bring an offer today in time for the season.
-
1996-05-16soldstatus $75,000
-
1996-05-11soldstatus $75,000
-
1987-06-24soldstatus $75,000
ⓘ Source: listings_history table (triggers on properties + properties_extension) + one-shot
backfill from property_details.listing_events for pre-trigger history.
Tax reassessment forecast NJ · Partial reset (capped growth)
- Current annual tax
- $2,645 · $220/mo
- Projected year-2 tax
- $7,535 · $628/mo
- Expected delta
- +$4,890/yr (+$408/mo · 184.9%)
ⓘ Screening estimate from a state-policy table — verify with the county assessor before closing.
Nearby sold comps map
Loading sold comps map…
Walkable amenities ~0.75 mi
Loading nearby amenities…
Taxation est. · year 1
- Rental income
- $81,827
- − Mortgage interest
- −$27,952
- − Property taxes
- −$2,645
- − Insurance
- −$2,495
- − Repairs & maintenance
- −$6,546
- − Management
- −$6,546
- − HOA
- −$2,844
- − Depreciation
- −$14,516
- Taxable income
- $18,283
- Est. tax owed @ 24.0%
- −$4,388
- After-tax cash flow
- $20,870/yr
For passive investors: Depreciation is non-cash, so a rental often shows a tax loss while cash-flowing — sheltering income. Rental losses are passive: they offset passive income freely, and up to $25,000/yr can offset ordinary (W-2) income if you actively participate and your MAGI is under $100k (phasing out to $0 by $150k); unused losses carry forward. On sale, claimed depreciation is recaptured at up to 25%, and gains may owe capital-gains tax (a 1031 exchange can defer both). Figures are a year-1 estimate at your 24.0% rate — not tax advice; consult a CPA.
Schools (NCES district)
- District
- Ocean City School District
- NCES district ID
- 3411970
- Math proficiency
- 31% ▼ -12.00%
- Reading proficiency
- 53% ▼ -9.00%
- Median HH income
- $60,444
- Composite
- 37.07/100
- National rank
- #4506
- State rank
- #212 of 472 in NJ
Livability — Ocean City
- Score
- 80/100
- State rank
- #72
- US rank
- #1762
Category grades
Schools grade is shown separately in the Schools card above.
Census & demographics
- Census place
- Ocean City, NJ
- City population
- 11,260
- Population (ZIP)
- 11,260
Population outlook (Cape May County) Hauer SSP2
- Today (2025)
- 88,234 people
- By 2030
- 84,144 · -4.6%
- By 2040
- 75,146 · -14.8%
- By 2050
- 67,389 · -23.6%
- By 2075
- 55,732 · -36.8%
- By 2100
- 44,972 · -49.0%
Race, ethnicity, and origin ACS 2023
- Neighborhood character
- Predominantly White (86%)
- Race & ethnicity
- White 86% Hispanic / Latino 9% Black 2% Two or more races 2%
- Hispanic origin (detail)
- Mexican 7% Puerto Rican 1%
- Common ancestry
- Romanian 6% Slovak 2% Scotch-Irish 1%
- Foreign-born
- 7% · Canada
- Languages at home
- 89% English-only · Spanish 8% Russian/Polish/Slavic 2% Other Indo-European 2%
Political lean MEDSL · Cape May
- 2024 margin
- R (+19.2) · D 39.7% · R 58.9% · Other 1.4%
- 2008→2024 swing
- -10.6pp toward R · 2008: -8.7pp · 2024: -19.2pp
- All cycles
- 2024: R+19.2 2020: R+15.9 2016: R+19.9 2012: R+8.9 2008: R+8.7
Not yet ingested
- Civics
- —
Market trends
- HPI YoY
- ▼ -381.90%
- Current HPI
- 389.3687
- Rent YoY
- —
- Metro
- —
- State GDP YoY
- ▲ 2.05%
- F500 in state
- 34
Industry mix (Fortune 500 HQ in NJ)
| Industry | F500 HQs | Revenue |
|---|---|---|
| Consumer Goods | 3 | $31B |
|
||
| Pharmaceuticals | 2 | $153B |
|
||
| Technology | 2 | $21B |
|
||
| Insurance | 2 | $20B |
|
||
| Healthcare | 2 | $19B |
|
||
| Financial Services | 1 | $70B |
|
||
Price history
+565.3% since first listed8 events — show timeline
- 2026-02-13 Listed $499,000 SJSRMLS
- 2015-06-23 Sold (Public Records) $170,000 Public Records
- 2015-06-02 Sold (MLS) $170,000 SJSRMLS
- 2015-05-19 Contingent — SJSRMLS
- 2015-03-27 Listed $229,900 SJSRMLS
- 1996-05-16 Sold (Public Records) $75,000 Public Records
- 1996-05-11 Sold (Public Records) $75,000 Public Records
- 1987-06-24 Sold (Public Records) $75,000 Public Records
Property tax history
+2.7%/yrLatest (2025): $2,645 · +3.4% YoY. Source: county tax records.
Cash-flow waterfall
monthlySold comps — $/sqft
last 12 mo · ≤1 miLoading sold comps…