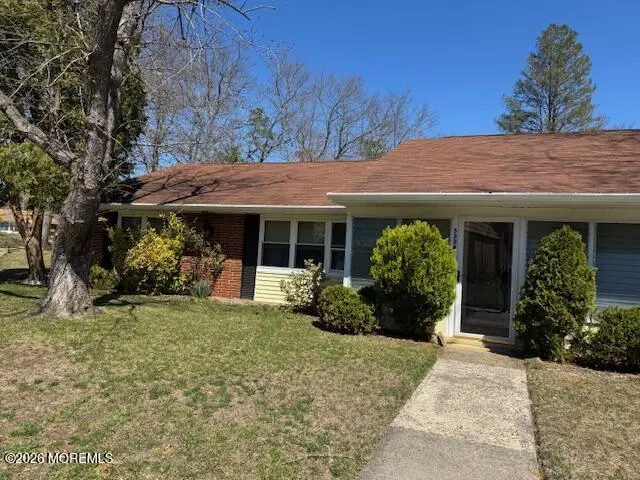
522A Thornbury Ct · Leisure Village, NJ
Flood risk 1/10 · Minimal
- FEMA flood zone
- X (unshaded)
- Chance of flooding over 30 yrs
- 0.0%
- Est. flood insurance / yr
- $507 – $1,088
Fire risk 1/10 · Minimal
- Est. fire insurance / yr
- $526 – $976
Heat risk 7/10 · Major
- Hot days now (above 103°F)
- 7 days/yr
- Hot days in 30 yrs
- 15 days/yr
Wind risk 6/10 · Moderate
- Chance of severe wind over 30 yrs
- 67.0%
Air-quality risk 3/10 · Minor
- Unhealthy air days now
- 3 days/yr
- Unhealthy air days in 30 yrs
- 4 days/yr
Risk factors via First Street. Map © Google.
Why this score? — see what drove the B- grade
The composite is a weighted blend of 9 inputs, each scored 0–100. Each bar is that input's sub-score; the figure is the points it added to the 100-point composite (weight × sub-score).
- Cash flow +25.8/30.0
- ARV discount +15.0/15.0
- 1% rule +10.0/10.0
- DSCR +8.6/10.0
- Livability +3.2/5.0
- Rent growth +2.5/5.0
- Condition / age +2.2/5.0
- Schools +1.9/10.0
- Appreciation +0.0/10.0
$150,000
🖨 Deal sheet 📄 Offer letter ✓ Due diligence
Listing remarks
BEST AND FINAL OFFERS BY WEDNESDAY 4/22 NOON Cute 2 bedroom 1 bath end unit waiting for some TLC. Eat in kitchen, extra large living room/dining room, 2 spacious bedrooms and inviting enclosed porch.
Key facts
- Eat in kitchen
- Enclosed porch
- Garage
Tags
Neighborhood map
What this means for you Summary
Snapshot
- This is a 2-bed/1.0-bath single-family listed at $150k. Condition is rated fair.
Deal economics
- At list price, monthly cash flow is $366 ($4k/yr) — positive.
- The deal already cash-flows at list — no discount required.
- Meets the 1% rule at list price ($2k rent vs $150k).
- Cap rate 9.2% vs local median 6.0% in Leisure Village — top-decile yield for the area; either an underpriced asset or a hidden risk that comps aren't pricing in. Stress-test before assuming the spread holds.
Location & tenants
- Location reads 64/100 on livability (#416 in NJ) — a middle-class / working-renter tenant base. Strengths: housing A+, crime B+, cost of living B; Watch: schools D, amenities F, commute F.
- Lakewood Township School District (suburban): math 17% / reading 28% proficiency, ranked #417 of 472 in NJ (top 88%) — low school quality limits family demand, transient renter base, plan for 1-2y turnover; 82% free/reduced lunch — lower-income household profile, screen leases tightly.
- Market conditions: 419 active listings in the ZIP; 9 comparable units currently listed for rent nearby; rentals at typical pace (median 18d on market — plan ~3-4 weeks tenant-placement turnaround); 4,434 units permitted in Ocean County in 2024 (868 in 5+ unit buildings).
- This rent runs 42% of the median local income ($65k/yr) — at the standard rent-burdened threshold; future hikes will face affordability resistance.
Forward outlook
- Local home prices are declining (-3.0%/yr); year-one equity from $1k of loan paydown is wiped out by about $4k of value loss. Plan a longer hold.
- Ocean County population projected to shrink 8% by 2050 — rents likely to lag national; underwrite the cash flow, not the appreciation.
Negotiation context
- Only 9 days on market — expect competitive offers; lowballing is unlikely to land.
Risks & watch-outs
- Climate carrying-cost: major wind risk, 67% chance of damaging wind over 30y; extreme-heat days projected 7→15/yr by 2055 (HVAC capex compounding) — expect insurance premiums to compound above CPI over the hold.
Questions for the listing agent
- Have any recent inspections been done? Can we get a copy of the seller's disclosures and any deferred-maintenance estimates?
- Built in 1969 — when were the roof, HVAC, electrical panel, plumbing, and water heater last replaced?
- What does the HOA fee cover, when was the last increase, and are there any pending special assessments or reserve-fund shortfalls?
- Is there a deadline driving the sale (1031 exchange, divorce, estate, relocation)? That informs how much negotiation room exists.
- Schools are D-rated, which usually means shorter tenancies and higher turnover. Who's the typical renter profile here, and what's been the actual vacancy rate?
- What's the average days-on-market for RENTAL listings here right now (not sales)? A rising rental-DOM trend means longer vacancies and softer asking-rent achievability than the comps imply.
- What's the recent tenant-quality profile in this submarket — average credit score on applications, eviction rate, late-payment / NSF rate, and stable-employment percentage? A property-management company in the area should have these aggregated.
- How much new for-sale + rental construction is in the pipeline within 1–3 miles? Heavy new supply typically softens prices + rents 12–24 months out; constrained supply supports both.
Investment metrics
- 1% rule
- 1.52% ✓
- Cap rate
- 9.22%
- Cash-on-cash
- 10.45%
- DSCR
- 1.46
- GRM
- 5.5
CMA / ARV
- ARV (on-the-fly)
- $238,548
- Comps found
- 12
Show comp detail 12 sales within ~0.75 mi
| Address | Dist | Beds/Ba | Sqft | Sold | Price | $/sf | Match |
|---|---|---|---|---|---|---|---|
| 522A Thornbury Ct | 0.00mi | 2/1.0 | 1,236 (0%) | 0mo | $145,000 | $117 | 100 |
| 449A Cheshire Ct | 0.29mi | 2/2.0 | 1,246 (+1%) | 2mo | $297,000 | $238 | 80 |
| 450D Cheshire Ct Unit D | 0.30mi | 2/2.0 | 1,246 (+1%) | 3mo | $185,000 | $148 | 78 |
| 500B Thornbury Ct Unit B | 0.08mi | 2/1.0 | 1,078 (-13%) | 1mo | $216,000 | $200 | 75 |
| 1317 Eisenhower St | 0.36mi | 3/1.5 (+1) | 1,140 (-8%) | 3mo | $605,000 | $531 | 60 |
| 439 Sophee Ln | 0.58mi | 2/1.5 | 1,164 (-6%) | 3mo | $190,000 | $163 | 58 |
| 426A Chatham Ct | 0.44mi | 2/1.0 | 1,078 (-13%) | 3mo | $147,000 | $136 | 55 |
| 1668 Wisteria Ct | 0.30mi | 2/2.0 | 1,412 (+14%) | 4mo | $321,750 | $228 | 55 |
| 512 Sophee Ln | 0.61mi | 2/2.0 | 1,165 (-6%) | 4mo | $225,000 | $193 | 55 |
| 295B W Malvern Ct | 0.65mi | 2/2.0 | 1,374 (+11%) | 4mo | $205,000 | $149 | 44 |
| 119B Buckingham Dr | 0.63mi | 2/2.0 | 1,098 (-11%) | 7mo | $210,000 | $191 | 42 |
| 116A Buckingham Dr | 0.67mi | 2/2.0 | 1,053 (-15%) | 3mo | $207,000 | $197 | 38 |
Match score weights: distance 35% · size 25% · config 20% · recency 20%. Top-matched comps best support the ARV.
Projected returns pro-forma
-3.0% appreciation · 3.0% rent growth · sell at horizon
- IRR
- -0.5%
- Equity multiple
- 0.98×
- Total profit
- $-739
- Equity at exit
- $22,365
- IRR
- 9.4%
- Equity multiple
- 1.73×
- Total profit
- $30,488
- Equity at exit
- $12,969
Cash invested: $42,000 (down + closing). Projections, not guarantees.
Landlord ↔ Tenant lean methodology
- Overall (STATE)
- 21 Tenant-Leaning
- State New Jersey
- 21 Tenant-Leaning · D+6
- County
- — inherits STATE
- City
- — inherits STATE
ZIP-level market 08701
- Active inventory
- 419
- Price-to-rent
- 5.5×
Monthly cashflow live
- Estimated rent
- $2,286 high interval (Pro) →
- Mortgage (P&I)
- −$787
- Tax est. 1.5%
- −$188 /mo · $2,250/yr
- Insurance
- −$62
- HOA
- −$404
- Vacancy / Maint / Mgmt
- −$480
- Net cashflow
- $366
Break-even live
UW: 25.0% down · 7.5% · 30yr · 1.5% tax · 5.0% vac · 8.0% maint · 8.0% mgmt
Financing live
Cash to close
- Down payment
- $37,500
- Closing costs
- $4,500
- Reserves months
- —
- Total cash needed
- —
Loan-product check · same deal, 3 products live
Conventional
25% down · 7.5% · 30yr
- Down + closing
- —
- Monthly P&I
- —
- Monthly cashflow
- —
- DSCR
- —
- Eligible?
- —
Personal DTI + credit; lowest rate.
DSCR
20% down · 8.5% · 30yr
- Down + closing
- —
- Monthly P&I
- —
- Monthly cashflow
- —
- DSCR
- —
- Eligible?
- —
No personal income docs; deal must DSCR.
Hard money
10% down · 12.0% · 12mo
- Down + closing
- —
- Monthly P&I
- —
- Monthly cashflow
- —
- DSCR
- —
- Eligible?
- —
Short-term bridge; refi at stabilization.
Rent comps 9 comps
| Address | Beds | Baths | Sqft | Rent | $/sqft | DOM | Units | Dist |
|---|---|---|---|---|---|---|---|---|
| 1305 Marshall St Lakewood, NJ | 3.0 | 1.0 | 1168 | $2,900 | $2.48 | 7d | 1 | 0.52mi |
| 610 Sophee Ln Lakewood, NJ | 2.0 | 1.5 | 1164 | $2,000 | $1.72 | 43d | 1 | 0.69mi |
| 335A Canterbury Ct Lakewood, NJ | 2.0 | 1.0 | 982 | $1,950 | $1.99 | 19d | 1 | 0.72mi |
| 341B Canterbury Ct Lakewood, NJ | 2.0 | 1.0 | 982 | $2,275 | $2.32 | 22d | 1 | 0.77mi |
| 47L Cambridge Ct Lakewood, NJ | 2.0 | 1.0 | 841 | $1,795 | $2.13 | 24d | 1 | 0.81mi |
| 106A Edinburgh Ln Lakewood, NJ | 2.0 | 1.0 | 858 | $2,200 | $2.56 | 17d | 1 | 0.87mi |
| 278C Kingston Ct Lakewood, NJ | 2.0 | 1.0 | 1000 | $2,250 | $2.25 | 2d | 1 | 0.87mi |
| 1100 Deer Path Lakewood, NJ | 2.0 | 1.0–1.5 | 1187 | $2,575 | $2.17 | 1d | 4 | 1.10mi |
| 1042C Aberdeen Dr Unit C Lakewood, NJ | 2.0 | 1.0 | 982 | $2,000 | $2.04 | 4d | 1 | 1.33mi |
HOA detail
- Monthly dues
- $404 · $4,848/yr
Listing history 2 events
-
2026-04-24status Pending
-
2026-04-14$150,000 Active
ⓘ Source: listings_history table (triggers on properties + properties_extension) + one-shot
backfill from property_details.listing_events for pre-trigger history.
Climate risk First Street
- Flood 1/10 Low FEMA zone X (unshaded) · 0% chance over 30 yrs
- Wildfire 1/10 Low
- Heat 7/10 Severe 7 d/yr ≥103°F today · 15 d/yr by 30 yrs out
- Wind 6/10 Major 67% chance of damaging wind over 30 yrs
- Air quality 3/10 Moderate 3 unhealthy d/yr today · 4 by 30 yrs out
Nearby sold comps map
Loading sold comps map…
Walkable amenities ~0.75 mi
Loading nearby amenities…
Taxation est. · year 1
- Rental income
- $27,436
- − Mortgage interest
- −$8,402
- − Property taxes
- −$2,250
- − Insurance
- −$750
- − Repairs & maintenance
- −$2,195
- − Management
- −$2,195
- − HOA
- −$4,848
- − Depreciation
- −$4,364
- Taxable income
- $2,432
- Est. tax owed @ 24.0%
- −$584
- After-tax cash flow
- $3,803/yr
For passive investors: Depreciation is non-cash, so a rental often shows a tax loss while cash-flowing — sheltering income. Rental losses are passive: they offset passive income freely, and up to $25,000/yr can offset ordinary (W-2) income if you actively participate and your MAGI is under $100k (phasing out to $0 by $150k); unused losses carry forward. On sale, claimed depreciation is recaptured at up to 25%, and gains may owe capital-gains tax (a 1031 exchange can defer both). Figures are a year-1 estimate at your 24.0% rate — not tax advice; consult a CPA.
Condition & rehab AI · 6 photos
This home requires moderate renovations to update the kitchen and bathroom, and improve the overall appearance and functionality. Updates will significantly increase its resale and rental value.
Repairs flagged
- Major kitchen cabinets — severely dated and worn
- Major kitchen appliances — outdated and worn
- Major bathroom fixtures — outdated and worn
- Minor exterior siding — some wear
Value-add opportunities
- Both update kitchen cabinets and appliances — modernizing kitchen will appeal to buyers and renters
- Both replace outdated bathroom fixtures — modernizing bathroom will appeal to buyers and renters
- Both paint interior walls — fresh paint will improve curb appeal and interior aesthetics
- Both replace checkered kitchen floor — modern flooring will improve kitchen aesthetics and functionality
- Both repair/replace worn carpet — new carpet will improve comfort and aesthetics in living areas
Renovation cost estimate screening
| Repair item | Severity | Est. cost |
|---|---|---|
| kitchen cabinets · severely dated and worn | Major | $15,000–50,000 |
| kitchen appliances · outdated and worn | Major | $15,000–50,000 |
| bathroom fixtures · outdated and worn | Major | $15,000–50,000 |
| exterior siding · some wear | Minor | $500–3,000 |
| Total estimated repair cost · 4 items | $45,500–153,000 |
Value-add ROI direction
- Both update kitchen cabinets and appliances — modernizing kitchen will appeal to buyers and renters ↑
- Both replace outdated bathroom fixtures — modernizing bathroom will appeal to buyers and renters ↑
- Both paint interior walls — fresh paint will improve curb appeal and interior aesthetics ↑
- Both replace checkered kitchen floor — modern flooring will improve kitchen aesthetics and functionality ↑
- Both repair/replace worn carpet — new carpet will improve comfort and aesthetics in living areas ↑
ⓘ Cost ranges are severity-bucket heuristics (US national rule-of-thumb). Get contractor quotes + a written scope before underwriting a rehab budget.
Schools (NCES district)
- District
- Lakewood Township School District
- NCES district ID
- 3408220
- Math proficiency
- 17% ▼ -4.00%
- Reading proficiency
- 28% ▼ -5.00%
- Median HH income
- $42,301
- Composite
- 19.21/100
- National rank
- #8813
- State rank
- #417 of 472 in NJ
Livability — Leisure Village
- Score
- 64/100
- State rank
- #416
- US rank
- #14624
Category grades
Schools grade is shown separately in the Schools card above.
Census & demographics
- Census place
- Leisure Village, NJ
- County
- Ocean County · 439,426 people
- Metro
- New York-Newark-Jersey City, NY-NJ-PA
- Population (ZIP)
- 139,149
- Household income
- $64,959
- Rent vs Own
- Severe rent burden
- 5757.0
Population outlook (Ocean County) Hauer SSP2
- Today (2025)
- 586,991 people
- By 2030
- 581,403 · -1.0%
- By 2040
- 564,913 · -3.8%
- By 2050
- 538,149 · -8.3%
- By 2075
- 468,845 · -20.1%
- By 2100
- 350,297 · -40.3%
Race, ethnicity, and origin ACS 2023
- Neighborhood character
- Predominantly White (84%)
- Race & ethnicity
- White 84% Hispanic / Latino 11% Two or more races 5% Black 2%
- Hispanic origin (detail)
- Mexican 5% Puerto Rican 2% Dominican 2%
- Common ancestry
- Romanian 6% Italian 5% Scotch-Irish 2%
- Foreign-born
- 8% · Canada, Jamaica
- Languages at home
- 77% English-only · Spanish 9% German/W. Germanic 7% Russian/Polish/Slavic 1%
Political lean MEDSL · Ocean
- 2024 margin
- Solid R (+36.0) · D 31.4% · R 67.4% · Other 1.2%
- 2008→2024 swing
- -17.6pp toward R · 2008: -18.4pp · 2024: -36.0pp
- All cycles
- 2024: R+36.0 2020: R+28.7 2016: R+34.0 2012: R+17.7 2008: R+18.4
Not yet ingested
- Civics
- —
Market trends
- HPI YoY
- ▼ -682.83%
- Current HPI
- 465.344
- Rent YoY
- —
- Metro
- New York-Newark-Jersey City, NY-NJ-PA
- State GDP YoY
- ▲ 2.05%
- F500 in state
- 34
Industry mix (Fortune 500 HQ in NJ)
| Industry | F500 HQs | Revenue |
|---|---|---|
| Consumer Goods | 3 | $31B |
|
||
| Pharmaceuticals | 2 | $153B |
|
||
| Technology | 2 | $21B |
|
||
| Insurance | 2 | $20B |
|
||
| Healthcare | 2 | $19B |
|
||
| Financial Services | 1 | $70B |
|
||
Price history
2 events — show timeline
- 2026-04-24 Pending — MOMLS
- 2026-04-14 Listed $150,000 MOMLS
Cash-flow waterfall
monthlySold comps — $/sqft
last 12 mo · ≤1 miLoading sold comps…