 🏗️ New Construction
Elgin Plan · Magnolia, TX
Flood risk 1/10 · Minimal
- FEMA flood zone
- X (unshaded)
- Chance of flooding over 30 yrs
- 0.0%
- Est. flood insurance / yr
- $507 – $1,088
Fire risk 5/10 · Moderate
- Est. fire insurance / yr
- $1,222 – $2,270
Heat risk 8/10 · Major
- Hot days now (above 111°F)
- 7 days/yr
- Hot days in 30 yrs
- 23 days/yr
Wind risk 8/10 · Major
- Chance of severe wind over 30 yrs
- 99.0%
Air-quality risk 2/10 · Minimal
- Unhealthy air days now
- 2 days/yr
- Unhealthy air days in 30 yrs
- 2 days/yr
Risk factors via First Street. Map © Google.
Why this score? — see what drove the D- grade
The composite is a weighted blend of 9 inputs, each scored 0–100. Each bar is that input's sub-score; the figure is the points it added to the 100-point composite (weight × sub-score).
- Appreciation +10.0/10.0
- ARV discount +7.5/15.0
- Cash flow +6.7/30.0
- Schools +3.9/10.0
- Livability +3.7/5.0
- Rent growth +2.6/5.0
- Condition / age +2.5/5.0
- 1% rule +1.7/10.0
- DSCR +0.9/10.0
$294,990
🖨 Deal sheet (PDF) 📄 Offer letter ✓ Due diligence
Listing remarks MLS
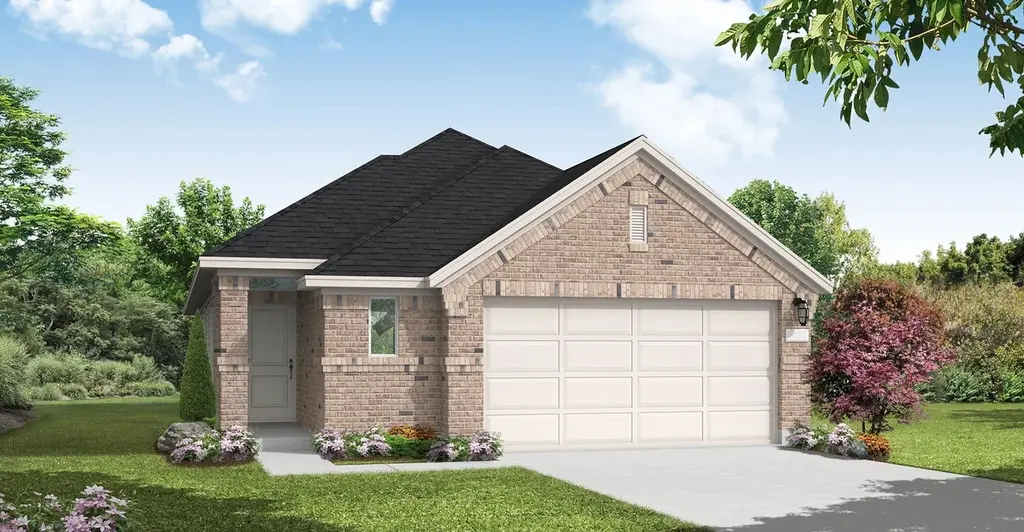
The Elgin floor plan is a beautifully designed one-story home that balances functionality and style. Offering four bedrooms and two bathrooms, this layout provides generous living space ideal for families or those who love to entertain. The open-concept design seamlessly connects the kitchen, dining, and living areas, creating a bright and inviting atmosphere. The primary suite serves as a peaceful retreat with a well-appointed ensuite bathroom. A two-car garage adds convenience and additional storage options. Whether you're looking for a home that offers comfort, flexibility, or modern living, the Elgin floor plan is designed to meet your needs.
Key facts
- 2 garage spots
- Listed 222 days
Neighborhood map
What this means for you Summary
Snapshot
- This is a 4-bed/2.0-bath single-family listed at $295k.
Deal economics
- At list price, monthly cash flow is $-483 ($-6k/yr) — negative.
- To cash-flow at today's rent, offer at most $229k (22.5% below list).
- To meet the 1% rule (rent ≥ 1% of price), the offer needs to be $200k (32.2% below list).
- Recommended offer: $200k (32.2% below list) — sets the bar for 1% rule.
- Cap rate 4.4% vs local median 3.4% in Magnolia — meaningfully above typical; check what's discounted (condition, days-on-market, listing class) to confirm the premium yield is real.
Location & tenants
- Location reads 73/100 on livability (#222 in TX) — a middle-class / working-renter tenant base. Strengths: crime A+, cost of living A+, housing A+; Watch: amenities F, commute F.
- Magnolia ISD (rural): math 42% / reading 45% proficiency, ranked #247 of 826 in TX (top 30%) — families likely to look elsewhere, expect single-tenant / working-renter base with shorter leases.
- Zoned schools: Willie E Williams El (math 46% / reading 41%, grade F, #1,269 of 4,322 statewide, top 30%, 869 students, 70% FRL); Magnolia J H (math 35% / reading 37%, grade F, #805 of 1,662 statewide, top 50%, 1,103 students, 57% FRL); Magnolia West H S (math 41% / reading 53%, grade D-, #591 of 1,632 statewide, top 38%, 2,208 students, 52% FRL) — zoned schools average 60% FRL vs 39% district-wide (21 pts higher); higher-poverty schools than district average — tighter screening recommended.
- Market conditions: Rents flat; 1622 active listings in the ZIP; 12 comparable units currently listed for rent nearby; rentals at typical pace (median 26d on market — plan ~3-4 weeks tenant-placement turnaround); high-income renter base; 13,259 units permitted in Montgomery County in 2024 (1,402 in 5+ unit buildings).
Forward outlook
- In year one you build about $32k of equity ($2k loan paydown + $30k appreciation (10.0% local appreciation)).
- Montgomery County population projected at +65% by 2050 — long-run rental-demand tailwind backs the buy-and-hold thesis.
- By year 2, paydown + projected appreciation supports a ~$51k cash-out refi (75% LTV) — recoverable capital for the next deal without selling this one.
Negotiation context
- It's been on market 222 days — a 12% lower offer ($260k) is reasonable based on typical stale-listing flexibility.
Risks & watch-outs
- Climate carrying-cost: severe wind risk, 99% chance of damaging wind over 30y; moderate wildfire risk; extreme-heat days projected 7→23/yr by 2055 (HVAC capex compounding) — expect insurance premiums to compound above CPI over the hold.
Questions for the listing agent
- What do current leases actually rent for vs. the listed asking? Can we see a recent rent roll and the last 12 months of T-12 income?
- It's been on market 222 days. Have you received any prior offers? Is the seller open to a 32% concession, seller financing, or rate buy-down credit?
- Why hasn't it sold? Are there any deal-killer items the seller is aware of (foundation, flood, title, zoning, code violations)?
- Is there a deadline driving the sale (1031 exchange, divorce, estate, relocation)? That informs how much negotiation room exists.
- Schools are D-rated, which usually means shorter tenancies and higher turnover. Who's the typical renter profile here, and what's been the actual vacancy rate?
- The area grade is low — what's the realistic commute time and amenity access for the typical tenant pool here? Any planned neighborhood developments (good or bad) we should know about?
- What's the average days-on-market for RENTAL listings here right now (not sales)? A rising rental-DOM trend means longer vacancies and softer asking-rent achievability than the comps imply.
- What's the recent tenant-quality profile in this submarket — average credit score on applications, eviction rate, late-payment / NSF rate, and stable-employment percentage? A property-management company in the area should have these aggregated.
- How much new for-sale + rental construction is in the pipeline within 1–3 miles? Heavy new supply typically softens prices + rents 12–24 months out; constrained supply supports both.
Investment metrics
- 1% rule
- 0.67% ✗
- Cap rate
- 4.35%
- Cash-on-cash
- -6.93%
- DSCR
- 0.69
- GRM
- 12.4
CMA / ARV
- ARV (median comp)
- $298,545
- List price
- $294,990
- Delta
- -1.19%
- Verdict
- FAIR
- Comps
- 20 within 1.0 mi
Show comp detail 11 sales within ~0.75 mi
| Address | Dist | Beds/Ba | Sqft | Sold | Price | $/sf | Match |
|---|---|---|---|---|---|---|---|
| 1313 Wicklow St | 0.26mi | 4/2.0 | 1,840 (-3%) | 23mo | $309,990 | $168 | 64 |
| 510 Sabino Sky Ct | 0.66mi | 3/2.0 (-1) | 1,889 (-0%) | 2mo | $274,995 | $146 | 62 |
| 106 Abilene Dr | 0.35mi | 4/2.5 | 2,088 (+10%) | 4mo | $439,999 | $211 | 62 |
| 519 Acker St | 0.16mi | 4/1.5 | 2,092 (+10%) | 14mo | $309,000 | $148 | 61 |
| 131 Amarrillo Dr | 0.32mi | 4/3.0 | 2,153 (+14%) | 3mo | $369,990 | $172 | 56 |
| 232 Harlingen Dr | 0.38mi | 3/2.0 (-1) | 1,635 (-14%) | 0mo | $259,990 | $159 | 54 |
| 213 Harlingen Dr | 0.39mi | 3/2.5 (-1) | 1,841 (-3%) | 19mo | $299,990 | $163 | 54 |
| 613 Emerald Blossom Ct | 0.73mi | 3/2.0 (-1) | 1,802 (-5%) | 12mo | $299,000 | $166 | 43 |
| 229 Harlingen Dr | 0.40mi | 4/3.0 | 2,153 (+14%) | 16mo | $339,990 | $158 | 41 |
| 17702 Rolling Hills Dr | 0.71mi | 3/1.5 (-1) | 1,856 (-2%) | 20mo | $250,000 | $135 | 40 |
| 626 Kelly Rd Rd | 0.72mi | 4/3.0 | 2,012 (+6%) | 20mo | $875,000 | $435 | 36 |
Match score weights: distance 35% · size 25% · config 20% · recency 20%. Top-matched comps best support the ARV.
Projected returns pro-forma
10.0% appreciation · 0.32% rent growth · sell at horizon
- IRR
- 18.7%
- Equity multiple
- 2.51×
- Total profit
- $126,616
- Equity at exit
- $268,953
- IRR
- 16.9%
- Equity multiple
- 5.64×
- Total profit
- $387,575
- Equity at exit
- $580,006
Cash invested: $83,592 (down + closing). Projections, not guarantees.
Landlord ↔ Tenant lean methodology
- Overall (STATE)
- 87 Strongly Landlord-Friendly
- State Texas
- 87 Strongly Landlord-Friendly · R+5
- County
- — inherits STATE
- City
- — inherits STATE
ZIP-level market 77354
- Home prices YoY
- 2.4%
- Rents YoY
- 0.3%
- Active inventory
- 1622
- Price-to-rent
- 12.3×
Monthly cashflow live
- Estimated rent
- $2,000 high interval (Pro) →
- Mortgage (P&I)
- −$1,566
- Tax est. 1.5%
- −$373 /mo · $4,478/yr
- Insurance
- −$124
- HOA
- −$0
- Vacancy / Maint / Mgmt
- −$420
- Net cashflow
- $-483
Break-even live
Sensitivity live
| Price | -10% $-277 | -5% $-380 | +0% $-483 | +5% $-586 | +10% $-689 |
|---|---|---|---|---|---|
| Rent | -10% $-641 | -5% $-562 | +0% $-483 | +5% $-404 | +10% $-325 |
| Rate | -1.0pp $-333 | -0.5pp $-407 | base $-483 | +0.5pp $-560 | +1.0pp $-639 |
UW: 25.0% down · 7.5% · 30yr · 1.5% tax · 5.0% vac · 8.0% maint · 8.0% mgmt
Financing live
Cash to close
- Down payment
- $74,636
- Closing costs
- $8,956
- Reserves months
- —
- Total cash needed
- —
Loan-product check · same deal, 3 products live
Conventional
25% down · 7.5% · 30yr
- Down + closing
- —
- Monthly P&I
- —
- Monthly cashflow
- —
- DSCR
- —
- Eligible?
- —
Personal DTI + credit; lowest rate.
DSCR
20% down · 8.5% · 30yr
- Down + closing
- —
- Monthly P&I
- —
- Monthly cashflow
- —
- DSCR
- —
- Eligible?
- —
No personal income docs; deal must DSCR.
Hard money
10% down · 12.0% · 12mo
- Down + closing
- —
- Monthly P&I
- —
- Monthly cashflow
- —
- DSCR
- —
- Eligible?
- —
Short-term bridge; refi at stabilization.
Rent comps 12 comps
| Address | Beds | Baths | Sqft | Rent | $/sqft | DOM | Units | Dist |
|---|---|---|---|---|---|---|---|---|
| 41523 Stampede Strem Dr Magnolia, TX | 3.0 | 2.0 | 1296 | $1,800 | $1.39 | 26d | 1 | 0.79mi |
| 627 Coyote Canyon Ct Magnolia, TX | 3.0 | 2.0 | 1407 | $2,024 | $1.44 | 0d | 1 | 0.79mi |
| 139 Piney Pathway Magnolia, TX | 4.0 | 2.0 | 2332 | $1,971 | $0.85 | 26d | 1 | 0.93mi |
| 134 Piney Pathway Magnolia, TX | 3.0 | 2.0 | 2329 | $1,966 | $0.84 | 0d | 1 | 0.95mi |
| 297 Country Crossing Cir Magnolia, TX | 3.0 | 2.0 | 1806 | $1,731 | $0.96 | 0d | 1 | 0.96mi |
| 202 Alder Laurels Cv Magnolia, TX | 4.0 | 2.5 | 2229 | $2,036 | $0.91 | 23d | 1 | 1.21mi |
| 423 Jewett Meadow Dr Magnolia, TX | 3.0 | 2.0 | 1311 | $1,781 | $1.36 | 23d | 1 | 1.22mi |
| 359 Cumberland Forest Dr Magnolia, TX | 4.0 | 2.0 | 1459 | $1,725 | $1.18 | 26d | 1 | 1.24mi |
| 764 Autumn Cherry Trl Magnolia, TX | 4.0 | 3.0 | 2196 | $1,665 | $0.76 | 45d | 1 | 1.30mi |
| 937 Gentle Moss Dr Magnolia, TX | 3.0 | 2.0 | 1252 | $1,635 | $1.31 | 6d | 1 | 1.32mi |
| 273 Douglas Hills Dr Magnolia, TX | 4.0 | 3.0 | 1922 | $1,895 | $0.99 | 45d | 1 | 1.34mi |
| 408 Cumberland Forest Dr Magnolia, TX | 3.0 | 2.0 | 1402 | $1,795 | $1.28 | 45d | 1 | 1.35mi |
Listing history 16 events
-
2026-06-21days on market $294,990 Active 222 DOM
-
2026-06-18days on market $294,990 Active 219 DOM
-
2026-06-17days on market $294,990 Active 218 DOM
-
2026-06-16days on market $294,990 Active 217 DOM
-
2026-06-15days on market $294,990 Active 216 DOM
-
2026-06-13days on market $294,990 Active 214 DOM
-
2026-06-09days on market $294,990 Active 210 DOM
-
2026-06-08days on market $294,990 Active 209 DOM
-
2026-06-07days on market $294,990 Active 208 DOM
-
2026-06-04days on market $294,990 Active 205 DOM
-
2026-06-03days on market $294,990 Active 204 DOM
-
2026-06-02days on market $294,990 Active 203 DOM
-
2026-06-01days on market $294,990 Active 202 DOM
-
2026-05-31days on market $294,990 Active 201 DOM
-
2026-03-07price $294,990 654-char remark
Show marketing remark (654 chars)
The Elgin floor plan is a beautifully designed one-story home that balances functionality and style. Offering four bedrooms and two bathrooms, this layout provides generous living space ideal for families or those who love to entertain. The open-concept design seamlessly connects the kitchen, dining, and living areas, creating a bright and inviting atmosphere. The primary suite serves as a peaceful retreat with a well-appointed ensuite bathroom. A two-car garage adds convenience and additional storage options. Whether you're looking for a home that offers comfort, flexibility, or modern living, the Elgin floor plan is designed to meet your needs.
-
2025-11-11$293,990 Active 654-char remark
Show marketing remark (654 chars)
The Elgin floor plan is a beautifully designed one-story home that balances functionality and style. Offering four bedrooms and two bathrooms, this layout provides generous living space ideal for families or those who love to entertain. The open-concept design seamlessly connects the kitchen, dining, and living areas, creating a bright and inviting atmosphere. The primary suite serves as a peaceful retreat with a well-appointed ensuite bathroom. A two-car garage adds convenience and additional storage options. Whether you're looking for a home that offers comfort, flexibility, or modern living, the Elgin floor plan is designed to meet your needs.
ⓘ Source: listings_history table (triggers on properties + properties_extension) + one-shot
backfill from property_details.listing_events for pre-trigger history.
Climate risk First Street
- Flood 1/10 Low FEMA zone X (unshaded) · 0% chance over 30 yrs
- Wildfire 5/10 Major
- Heat 8/10 Severe 7 d/yr ≥111°F today · 23 d/yr by 30 yrs out
- Wind 8/10 Severe 99% chance of damaging wind over 30 yrs
- Air quality 2/10 Low 2 unhealthy d/yr today · 2 by 30 yrs out
Nearby sold comps map
Loading sold comps map…
Walkable amenities ~0.75 mi
Loading nearby amenities…
Taxation est. · year 1
- Rental income
- $24,004
- − Mortgage interest
- −$16,723
- − Property taxes
- −$4,478
- − Insurance
- −$1,493
- − Repairs & maintenance
- −$1,920
- − Management
- −$1,920
- − Depreciation
- −$8,685
- Taxable loss
- −$11,215
- Est. tax savings @ 24.0%
- +$2,692
- After-tax cash flow
- $-3,103/yr
For passive investors: Depreciation is non-cash, so a rental often shows a tax loss while cash-flowing — sheltering income. Rental losses are passive: they offset passive income freely, and up to $25,000/yr can offset ordinary (W-2) income if you actively participate and your MAGI is under $100k (phasing out to $0 by $150k); unused losses carry forward. On sale, claimed depreciation is recaptured at up to 25%, and gains may owe capital-gains tax (a 1031 exchange can defer both). Figures are a year-1 estimate at your 24.0% rate — not tax advice; consult a CPA.
Schools (NCES district)
- District
- Magnolia ISD
- NCES district ID
- 4828740
- Math proficiency
- 42% ▼ -7.00%
- Reading proficiency
- 45% ▼ -4.00%
- Median HH income
- $71,692
- Composite
- 39.46/100
- National rank
- #3958
- State rank
- #247 of 826 in TX
Livability — Magnolia
- Score
- 73/100
- State rank
- #222
- US rank
- #5442
Category grades
Schools grade is shown separately in the Schools card above.
Census & demographics
- Census place
- Magnolia, TX
- County
- Montgomery County · 663,713 people
- City population
- 32,847
- Metro
- Houston-The Woodlands-Sugar Land, TX
- Population (ZIP)
- 44,900
- Household income
- $112,504
- Rent vs Own
- Severe rent burden
- 586.0
Population outlook (Montgomery County) Hauer SSP2
- Today (2025)
- 713,896 people
- By 2030
- 805,263 · +12.8%
- By 2040
- 992,708 · +39.1%
- By 2050
- 1,179,590 · +65.2%
- By 2075
- 1,628,084 · +128.1%
- By 2100
- 1,937,880 · +171.5%
Race, ethnicity, and origin ACS 2023
- Neighborhood character
- Predominantly White (66%)
- Race & ethnicity
- White 66% Hispanic / Latino 25% Two or more races 18% Black 3% Asian 1%
- Hispanic origin (detail)
- Mexican 14% Puerto Rican 1%
- Common ancestry
- Lithuanian 4% Slovak 2% Italian 2%
- Foreign-born
- 11% · Canada, Vietnam
- Languages at home
- 83% English-only · Spanish 15% Other Indo-European 1% German/W. Germanic 1%
Political lean MEDSL · Montgomery
- 2024 margin
- Solid R (+45.5) · D 26.8% · R 72.3%
- 2008→2024 swing
- +7.2pp toward D · 2008: -52.7pp · 2024: -45.5pp
- All cycles
- 2024: R+45.5 2020: R+43.8 2016: R+51.4 2012: R+60.7 2008: R+52.7
Not yet ingested
- Civics
- —
Market trends
- HPI YoY
- ▲ 12.09%
- Current HPI
- 512.87
- Rent YoY
- ▲ 0.32%
- Metro
- Houston-The Woodlands-Sugar Land, TX
- State GDP YoY
- ▲ 3.95%
- F500 in state
- 110
Industry mix (Fortune 500 HQ in TX)
| Industry | F500 HQs | Revenue |
|---|---|---|
| Energy | 16 | $1,198B |
|
||
| Technology | 5 | $198B |
|
||
| Engineering / Construction | 4 | $72B |
|
||
| Energy Services | 3 | $60B |
|
||
| Utilities | 3 | $41B |
|
||
| Healthcare | 2 | $330B |
|
||
Price history
+0.3% since first listed2 events — show timeline
- 2026-03-07 Price Changed $294,990 Zillow
- 2025-11-11 Listed $293,990 Zillow
Cash-flow waterfall
monthlySold comps — $/sqft
last 12 mo · ≤1 miLoading sold comps…