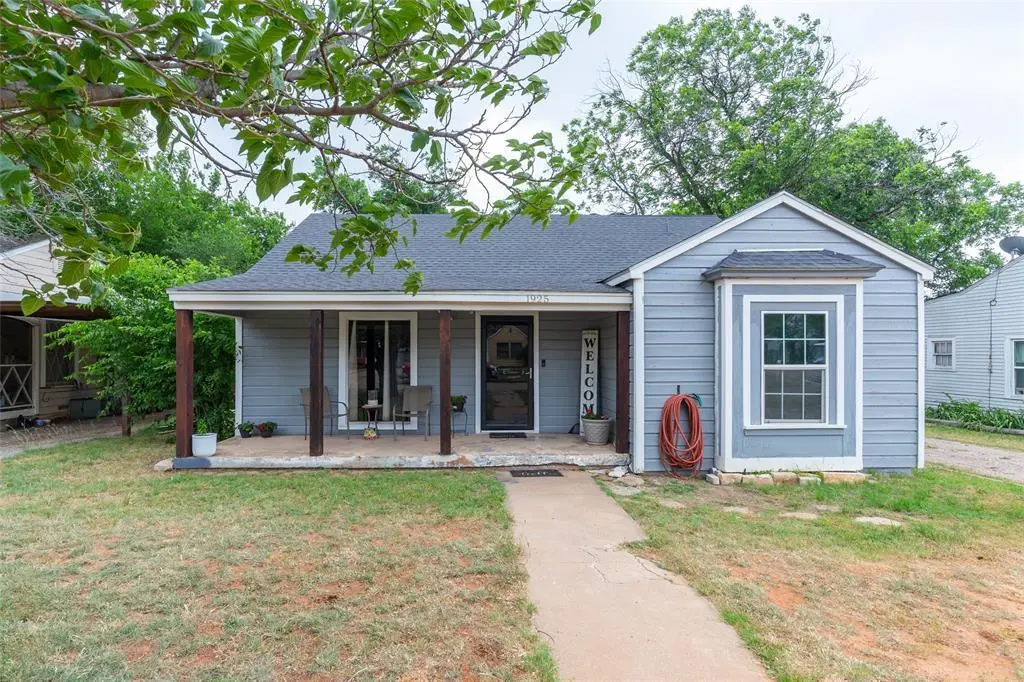
1925 Chestnut St · Abilene, TX
Flood risk 1/10 · Minimal
- FEMA flood zone
- X (unshaded)
- Chance of flooding over 30 yrs
- 0.0%
- Est. flood insurance / yr
- $507 – $1,088
Fire risk 3/10 · Minor
- Est. fire insurance / yr
- $1,222 – $2,270
Heat risk 7/10 · Major
- Hot days now (above 103°F)
- 7 days/yr
- Hot days in 30 yrs
- 24 days/yr
Wind risk 4/10 · Minor
- Chance of severe wind over 30 yrs
- 11.0%
Air-quality risk 1/10 · Minimal
- Unhealthy air days now
- 0 days/yr
- Unhealthy air days in 30 yrs
- 0 days/yr
Risk factors via First Street. Map © Google.
Why this score? — see what drove the B grade
The composite is a weighted blend of 9 inputs, each scored 0–100. Each bar is that input's sub-score; the figure is the points it added to the 100-point composite (weight × sub-score).
- Cash flow +29.7/30.0
- ARV discount +11.4/15.0
- DSCR +10.0/10.0
- 1% rule +9.0/10.0
- Rent growth +5.0/5.0
- Livability +3.8/5.0
- Schools +2.8/10.0
- Condition / age +2.5/5.0
- Appreciation +0.0/10.0
$189,900
🖨 Deal sheet (PDF) 📄 Offer letter ✓ Due diligence
Listing remarks MLS
Lots of updates!! Fresh paint, ceramic tile on kitchen counter tops, refinished hardwood floors, etc. 1552 sq. ft. per appraiser. Looks great!!
Key facts
- Hard wood floors
- Decorative fireplace
- Laundry room
Tags
Property features AI
Finance
- Financial info: Accepts Cash, Conventional, FHA, VA financing; No second mortgage reported
- HOA & community: No homeowners association
Exterior
- Parking: 2 covered parking spaces; 2-car garage with single doors; Garage faces front; Garage approx. 18 ft wide by 18 ft deep
- Utilities: City water; City sewer; Not in a municipal utility district
- Home design: Single family residence; One story; Not attached to another property; Subdivision: Belmont Add
- Construction: Built in 1942; Frame construction; Composition and other roofing; Pillar/post/pier foundation
- Exterior features: Front porch; Rear porch; Patio; Few trees; Landscaped yard
Interior
- Kitchen: Gas range; Microwave
- Bedrooms: Primary bedroom on level 1 (approx. 20 x 15)
- Flooring: Hardwood; Laminate
- Bathrooms: 1 full bathroom
- Heating & cooling: Central heating (natural gas); Central air; Ceiling fans; Electric cooling components
- Interior features: Tile countertops; Window coverings; One living area; One dining area; Two total interior rooms
- Laundry & utility: Full-size washer/dryer area; Washer hookup; Electric dryer hookup; Utility room
Neighborhood map
What this means for you Summary
Snapshot
- This is a 3-bed/1.0-bath single-family listed at $190k.
Deal economics
- At list price, monthly cash flow is $693 ($8k/yr) — positive.
- The deal already cash-flows at list — no discount required.
- Meets the 1% rule at list price ($3k rent vs $190k).
- Recommended offer: $187k (1.5% below list) — sets the bar for market timing.
- Cap rate 10.7% vs local median 6.8% in Abilene — top-decile yield for the area; either an underpriced asset or a hidden risk that comps aren't pricing in. Stress-test before assuming the spread holds.
Location & tenants
- Location reads 75/100 on livability (#142 in TX, #4,037 nationally) — a middle-class / working-renter tenant base. Strengths: cost of living A+, housing A+, health & safety A+; Watch: crime D, commute F.
- Abilene ISD (urban): math 32% / reading 34% proficiency, ranked #575 of 826 in TX (top 70%) — families likely to look elsewhere, expect single-tenant / working-renter base with shorter leases.
- Zoned schools: Bowie El (math 34% / reading 36%, grade F, #1,965 of 4,322 statewide, top 46%, 476 students, 87% FRL) — zoned schools average 87% FRL vs 57% district-wide (30 pts higher); higher-poverty schools than district average — tighter screening recommended.
- Market conditions: Rents rising fast (+33.5%/yr); 374 active listings in the ZIP; 9 comparable units currently listed for rent nearby; rentals at typical pace (median 23d on market — plan ~3-4 weeks tenant-placement turnaround); solid renter incomes; 508 units permitted in Taylor County in 2024 (0 in 5+ unit buildings).
- This rent runs 36% of the median local income ($90k/yr) — at the standard rent-burdened threshold; future hikes will face affordability resistance.
Forward outlook
- Local home prices are declining (-3.0%/yr); year-one equity from $1k of loan paydown is wiped out by about $6k of value loss. Plan a longer hold.
- Taylor County population projected at +16% by 2050 — long-run rental-demand tailwind backs the buy-and-hold thesis.
- At projected returns (-3.0% appreciation + 8.0% rent growth), your $53k cash investment doubles in ~6 years — after that, you're playing with house money.
Negotiation context
- It's been on market 18 days — a 2% lower offer ($187k) is reasonable based on typical stale-listing flexibility.
- 2 sale attempts since 16y ago; this cycle's ask has dropped $10k (5%) from the opening price — seller is motivated, your offer sets the floor, not the list.
Risks & watch-outs
- Watch-outs: built in 1942 — expect roof / HVAC / electrical / plumbing capex.
- Climate carrying-cost: extreme-heat days projected 7→24/yr by 2055 (HVAC capex compounding) — expect insurance premiums to compound above CPI over the hold.
Questions for the listing agent
- Built in 1942 — when were the roof, HVAC, electrical panel, plumbing, and water heater last replaced?
- Is there a deadline driving the sale (1031 exchange, divorce, estate, relocation)? That informs how much negotiation room exists.
- Schools are D-rated, which usually means shorter tenancies and higher turnover. Who's the typical renter profile here, and what's been the actual vacancy rate?
- Crime grade is D in this area — have there been break-ins, vandalism, or insurance claims at this property in the last 3 years? What carrier currently insures it and at what premium?
- What's the average days-on-market for RENTAL listings here right now (not sales)? A rising rental-DOM trend means longer vacancies and softer asking-rent achievability than the comps imply.
- What's the recent tenant-quality profile in this submarket — average credit score on applications, eviction rate, late-payment / NSF rate, and stable-employment percentage? A property-management company in the area should have these aggregated.
- How much new for-sale + rental construction is in the pipeline within 1–3 miles? Heavy new supply typically softens prices + rents 12–24 months out; constrained supply supports both.
Investment metrics
- 1% rule
- 1.40% ✓
- Cap rate
- 10.67%
- Cash-on-cash
- 15.64%
- DSCR
- 1.70
- GRM
- 5.9
CMA / ARV
- ARV (on-the-fly)
- $207,968
- Comps found
- 12
Show comp detail 12 sales within ~0.75 mi
| Address | Dist | Beds/Ba | Sqft | Sold | Price | $/sf | Match |
|---|---|---|---|---|---|---|---|
| 1457 S 18th St | 0.39mi | 3/1.0 | 1,454 (-6%) | 5mo | $177,490 | $122 | 67 |
| 1841 Sycamore St | 0.10mi | 3/2.0 | 1,778 (+15%) | 1mo | $219,900 | $124 | 66 |
| 1733 Palm St | 0.39mi | 3/2.0 | 1,381 (-11%) | 1mo | $159,900 | $116 | 59 |
| 2302 Vine St | 0.69mi | 3/2.0 | 1,524 (-2%) | 6mo | $229,000 | $150 | 56 |
| 1441 Peach St | 0.55mi | 3/2.0 | 1,420 (-8%) | 4mo | $180,000 | $127 | 53 |
| 2209 Poplar St | 0.39mi | 4/1.0 (+1) | 1,328 (-14%) | 1mo | $145,000 | $109 | 52 |
| 1726 Palm St | 0.42mi | 4/2.0 (+1) | 1,716 (+11%) | 3mo | $65,000 | $38 | 51 |
| 1701 S 21st St | 0.57mi | 3/2.0 | 1,384 (-11%) | 2mo | $199,900 | $144 | 50 |
| 2026 S 20th St | 0.74mi | 3/2.0 | 1,448 (-7%) | 1mo | $199,900 | $138 | 50 |
| 1317 Chestnut St | 0.58mi | 3/2.0 | 1,384 (-11%) | 4mo | $228,000 | $165 | 48 |
| 1309 Chestnut St | 0.59mi | 4/2.0 (+1) | 1,400 (-10%) | 1mo | $260,000 | $186 | 47 |
| 1350 Jeanette St | 0.72mi | 3/2.0 | 1,348 (-13%) | 5mo | $180,000 | $134 | 36 |
Match score weights: distance 35% · size 25% · config 20% · recency 20%. Top-matched comps best support the ARV.
Projected returns pro-forma
-3.0% appreciation · 8.0% rent growth · sell at horizon
- IRR
- 12.3%
- Equity multiple
- 1.52×
- Total profit
- $27,531
- Equity at exit
- $28,315
- IRR
- 25.0%
- Equity multiple
- 3.73×
- Total profit
- $145,228
- Equity at exit
- $16,419
Cash invested: $53,172 (down + closing). Projections, not guarantees.
Landlord ↔ Tenant lean methodology
- Overall (STATE)
- 87 Strongly Landlord-Friendly
- State Texas
- 87 Strongly Landlord-Friendly · R+5
- County
- — inherits STATE
- City
- — inherits STATE
ZIP-level market 79602
- Home prices YoY
- -19.6%
- Rents YoY
- 33.5%
- Active inventory
- 374
- Price-to-rent
- 5.9×
Monthly cashflow live
- Estimated rent
- $2,661 high interval (Pro) →
- Mortgage (P&I)
- −$996
- Tax from tax record
- −$334 /mo · $4,013/yr
- Insurance
- −$79
- HOA
- −$0
- Vacancy / Maint / Mgmt
- −$559
- Net cashflow
- $693
Break-even live
Sensitivity live
| Price | -10% $801 | -5% $747 | +0% $693 | +5% $639 | +10% $586 |
|---|---|---|---|---|---|
| Rent | -10% $483 | -5% $588 | +0% $693 | +5% $798 | +10% $903 |
| Rate | -1.0pp $789 | -0.5pp $741 | base $693 | +0.5pp $644 | +1.0pp $594 |
UW: 25.0% down · 7.5% · 30yr · 1.5% tax · 5.0% vac · 8.0% maint · 8.0% mgmt
Financing live
Cash to close
- Down payment
- $47,475
- Closing costs
- $5,697
- Reserves months
- —
- Total cash needed
- —
Loan-product check · same deal, 3 products live
Conventional
25% down · 7.5% · 30yr
- Down + closing
- —
- Monthly P&I
- —
- Monthly cashflow
- —
- DSCR
- —
- Eligible?
- —
Personal DTI + credit; lowest rate.
DSCR
20% down · 8.5% · 30yr
- Down + closing
- —
- Monthly P&I
- —
- Monthly cashflow
- —
- DSCR
- —
- Eligible?
- —
No personal income docs; deal must DSCR.
Hard money
10% down · 12.0% · 12mo
- Down + closing
- —
- Monthly P&I
- —
- Monthly cashflow
- —
- DSCR
- —
- Eligible?
- —
Short-term bridge; refi at stabilization.
Rent comps 9 comps
| Address | Beds | Baths | Sqft | Rent | $/sqft | DOM | Units | Dist |
|---|---|---|---|---|---|---|---|---|
| 801 S 17th St Abilene, TX | 3.0 | 1.0 | 1200 | $1,800 | $1.50 | 15d | 1 | 0.23mi |
| 1349 Meander St Abilene, TX | 3.0 | 1.0 | 1532 | $3,800 | $2.48 | 15d | 1 | 0.77mi |
| 1709 Bandolero Rd Abilene, TX | 3.0 | 2.0 | 1288 | $4,500 | $3.49 | 15d | 1 | 0.97mi |
| 2402 S 20th St Abilene, TX | 2.0 | 1.0 | 2040 | $1,400 | $0.69 | 22d | 1 | 1.00mi |
| 1934 Portland Ave Abilene, TX | 3.0 | 2.0 | 1108 | $1,900 | $1.71 | 45d | 1 | 1.11mi |
| 725 Peach St Abilene, TX | 3.0 | 2.0 | 1618 | $3,500 | $2.16 | 22d | 1 | 1.18mi |
| 108 Dotty Lou St Abilene, TX | 4.0 | 2.0 | 1401 | $4,800 | $3.43 | 0d | 1 | 1.20mi |
| 2601 Edgemont Dr Abilene, TX | 2.0 | 2.0 | 1624 | $2,495 | $1.54 | 22d | 1 | 1.37mi |
| 889 Ross Ave Abilene, TX | 2.0 | 1.0 | 1223 | $1,700 | $1.39 | 22d | 1 | 1.37mi |
Listing history 13 events
-
2026-06-22days on market $189,900 Active 18 DOM
-
2026-06-19days on market $189,900 Active 16 DOM
-
2026-06-18days on market $189,900 Active 15 DOM
-
2026-06-17days on market $189,900 Active 14 DOM
-
2026-06-16days on market $189,900 Active 13 DOM
-
2026-06-15days on market $189,900 Active 12 DOM
-
2026-06-14pricedays on market $189,900 Active 10 DOM
-
2026-06-13days on market $199,900 Active 9 DOM
-
2026-06-10days on market $199,900 Active 7 DOM
-
2026-06-09days on market $199,900 Active 6 DOM
-
2026-06-08days on market $199,900 Active 5 DOM
-
2026-06-07remarks 699-char remark
-
2026-06-07$199,900 Active 4 DOM
ⓘ Source: listings_history table (triggers on properties + properties_extension) + one-shot
backfill from property_details.listing_events for pre-trigger history.
Tax reassessment forecast TX · Resets to sale price
- Current annual tax
- $4,013 · $334/mo
- Projected year-2 tax
- $4,013 · $334/mo
- Expected delta
- $0/yr ($0/mo · 0.0%)
ⓘ Screening estimate from a state-policy table — verify with the county assessor before closing.
Climate risk First Street
- Flood 1/10 Low FEMA zone X (unshaded) · 0% chance over 30 yrs
- Wildfire 3/10 Moderate
- Heat 7/10 Severe 7 d/yr ≥103°F today · 24 d/yr by 30 yrs out
- Wind 4/10 Moderate 11% chance of damaging wind over 30 yrs
- Air quality 1/10 Low 0 unhealthy d/yr today · 0 by 30 yrs out
Nearby sold comps map
Loading sold comps map…
Walkable amenities ~0.75 mi
Loading nearby amenities…
Taxation est. · year 1
- Rental income
- $31,935
- − Mortgage interest
- −$10,637
- − Property taxes
- −$4,013
- − Insurance
- −$950
- − Repairs & maintenance
- −$2,555
- − Management
- −$2,555
- − Depreciation
- −$5,524
- Taxable income
- $5,702
- Est. tax owed @ 24.0%
- −$1,368
- After-tax cash flow
- $6,948/yr
For passive investors: Depreciation is non-cash, so a rental often shows a tax loss while cash-flowing — sheltering income. Rental losses are passive: they offset passive income freely, and up to $25,000/yr can offset ordinary (W-2) income if you actively participate and your MAGI is under $100k (phasing out to $0 by $150k); unused losses carry forward. On sale, claimed depreciation is recaptured at up to 25%, and gains may owe capital-gains tax (a 1031 exchange can defer both). Figures are a year-1 estimate at your 24.0% rate — not tax advice; consult a CPA.
Schools (NCES district)
- District
- Abilene ISD
- NCES district ID
- 4807440
- Math proficiency
- 32% ▼ -11.00%
- Reading proficiency
- 34% ▼ -5.00%
- Median HH income
- $39,782
- Composite
- 27.71/100
- National rank
- #6909
- State rank
- #575 of 826 in TX
Livability — Abilene
- Score
- 75/100
- State rank
- #142
- US rank
- #4037
Category grades
Schools grade is shown separately in the Schools card above.
Census & demographics
- Census place
- Abilene, TX
- County
- Taylor County · 136,672 people
- City population
- 136,672
- Metro
- Abilene, TX
- Population (ZIP)
- 27,425
- Household income
- $89,551
- Rent vs Own
- Severe rent burden
- 338.0
Population outlook (Taylor County) Hauer SSP2
- Today (2025)
- 145,270 people
- By 2030
- 150,050 · +3.3%
- By 2040
- 159,417 · +9.7%
- By 2050
- 168,883 · +16.3%
- By 2075
- 194,436 · +33.8%
- By 2100
- 203,163 · +39.9%
Race, ethnicity, and origin ACS 2023
- Neighborhood character
- Majority White (64%)
- Race & ethnicity
- White 64% Hispanic / Latino 22% Two or more races 12% Black 10% Asian 2%
- Hispanic origin (detail)
- Mexican 19%
- Common ancestry
- Romanian 2% Italian 2% Portuguese 2%
- Foreign-born
- 6% · Canada, Vietnam, Jamaica
- Languages at home
- 87% English-only · Spanish 9% Other Asian/Pacific 1% French/Haitian/Cajun 1%
Political lean MEDSL · Taylor
- 2024 margin
- Solid R (+49.8) · D 24.6% · R 74.4% · Other 1.0%
- 2008→2024 swing
- -4.2pp toward R · 2008: -45.6pp · 2024: -49.8pp
- All cycles
- 2024: R+49.8 2020: R+45.3 2016: R+51.1 2012: R+53.6 2008: R+45.6
Not yet ingested
- Civics
- —
Market trends
- HPI YoY
- ▼ -46.04%
- Current HPI
- 189.3098
- Rent YoY
- ▲ 33.46%
- Metro
- Abilene, TX
- State GDP YoY
- ▲ 3.95%
- F500 in state
- 110
Industry mix (Fortune 500 HQ in TX)
| Industry | F500 HQs | Revenue |
|---|---|---|
| Energy | 16 | $1,198B |
|
||
| Technology | 5 | $198B |
|
||
| Engineering / Construction | 4 | $72B |
|
||
| Energy Services | 3 | $60B |
|
||
| Utilities | 3 | $41B |
|
||
| Healthcare | 2 | $330B |
|
||
Price history
+150.2% since first listed6 events — show timeline
- 2026-05-31 Listed $199,900 NTREIS
- 2024-03-25 Sold (Public Records) — Public Records
- 2011-02-22 Sold (Public Records) — Public Records
- 2011-02-17 Sold (MLS) — NTREIS
- 2011-01-17 Listing Removed — NTREIS
- 2010-08-09 Listed $79,900 NTREIS
Property tax history
+6.6%/yrLatest (2025): $4,013 · +0.1% YoY. Source: county tax records.
Cash-flow waterfall
monthlySold comps — $/sqft
last 12 mo · ≤1 miLoading sold comps…