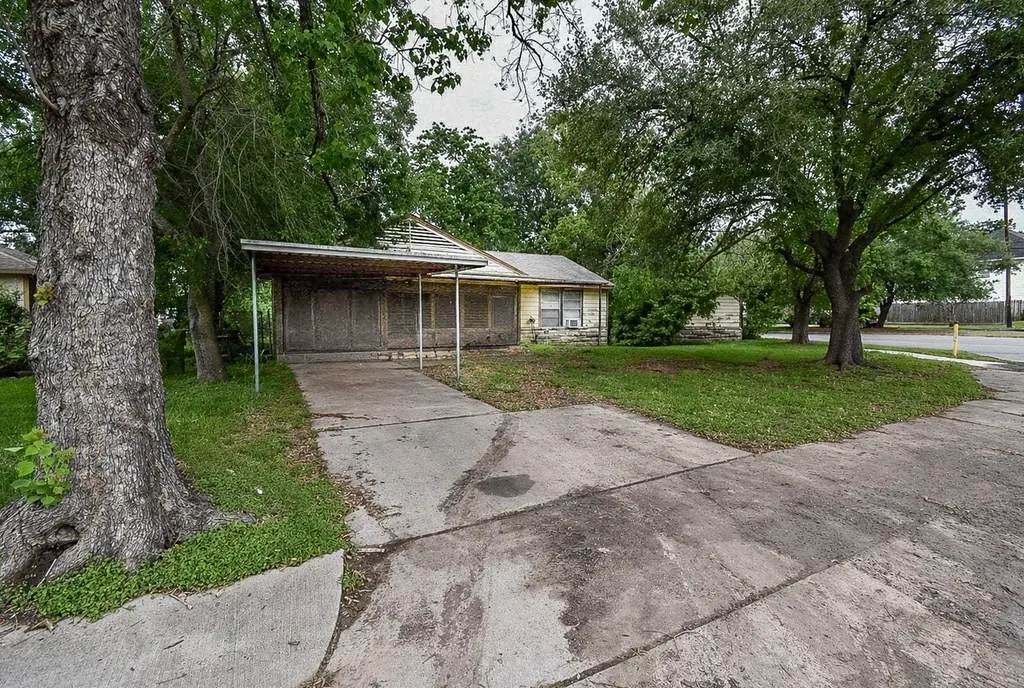
5155 Balkin St · Houston, TX
Flood risk 7/10 · Major
- FEMA flood zone
- X (unshaded)
- Chance of flooding over 30 yrs
- 0.99%
- Est. flood insurance / yr
- $507 – $1,088
Fire risk 1/10 · Minimal
- Est. fire insurance / yr
- $1,222 – $2,270
Heat risk 9/10 · Severe
- Hot days now (above 109°F)
- 7 days/yr
- Hot days in 30 yrs
- 23 days/yr
Wind risk 9/10 · Severe
- Chance of severe wind over 30 yrs
- 99.0%
Air-quality risk 2/10 · Minimal
- Unhealthy air days now
- 2 days/yr
- Unhealthy air days in 30 yrs
- 2 days/yr
Risk factors via First Street. Map © Google.
Why this score? — see what drove the C- grade
The composite is a weighted blend of 9 inputs, each scored 0–100. Each bar is that input's sub-score; the figure is the points it added to the 100-point composite (weight × sub-score).
- Cash flow +16.5/30.0
- ARV discount +15.0/15.0
- 1% rule +5.3/10.0
- DSCR +5.1/10.0
- Livability +3.7/5.0
- Rent growth +3.0/5.0
- Schools +2.7/10.0
- Condition / age +2.5/5.0
- Appreciation +0.0/10.0
$110,000
🖨 Deal sheet 📄 Offer letter ✓ Due diligence
Listing remarks MLS
Selling: As Is. This property can be restored or torn down to build your dream home. Homebuyers looking to build instant equity, along with an investor or handyman, this corner lot home is for you.
Key facts
- 6,599 sq ft lot
- Garage
- Built 1955
Neighborhood map
What this means for you Summary
Snapshot
- This is a 2-bed/1.0-bath single-family listed at $110k.
Deal economics
- At list price, monthly cash flow is $-1 ($-12/yr) — negative.
- To cash-flow at today's rent, offer at most $110k (0.2% below list).
- Meets the 1% rule at list price ($1k rent vs $110k).
- Recommended offer: $97k (12.0% below list) — sets the bar for market timing.
- Cap rate 7.0% vs local median 3.2% in Houston — top-decile yield for the area; either an underpriced asset or a hidden risk that comps aren't pricing in. Stress-test before assuming the spread holds.
Location & tenants
- Location reads 74/100 on livability (#184 in TX, #4,771 nationally) — a middle-class / working-renter tenant base. Strengths: amenities A+, cost of living A+, housing A+; Watch: schools D, crime F.
- Houston ISD (urban): math 27% / reading 35% proficiency, ranked #593 of 826 in TX (top 72%) — families likely to look elsewhere, expect single-tenant / working-renter base with shorter leases; 71% free/reduced lunch — lower-income household profile, screen leases tightly.
- Market conditions: Rents rising (+2.2%/yr); 467 active listings in the ZIP; 25 comparable units currently listed for rent nearby; rentals at typical pace (median 25d on market — plan ~3-4 weeks tenant-placement turnaround); 48% of comp listings sitting > 30 days — soft ceiling on asking rent; 29,883 units permitted in Harris County in 2024 (8,621 in 5+ unit buildings).
Forward outlook
- Local home prices are declining (-3.0%/yr); year-one equity from $761 of loan paydown is wiped out by about $3k of value loss. Plan a longer hold.
- Harris County population projected at +47% by 2050 — long-run rental-demand tailwind backs the buy-and-hold thesis.
Negotiation context
- It's been on market 125 days — a 12% lower offer ($97k) is reasonable based on typical stale-listing flexibility.
Risks & watch-outs
- Watch-outs: flood insurance adds $66/mo; built in 1955 — expect roof / HVAC / electrical / plumbing capex.
- Climate carrying-cost: major flood risk; severe wind risk, 99% chance of damaging wind over 30y; extreme-heat days projected 7→23/yr by 2055 (HVAC capex compounding) — expect insurance premiums to compound above CPI over the hold.
Questions for the listing agent
- What do current leases actually rent for vs. the listed asking? Can we see a recent rent roll and the last 12 months of T-12 income?
- It's been on market 125 days. Have you received any prior offers? Is the seller open to a 12% concession, seller financing, or rate buy-down credit?
- Built in 1955 — when were the roof, HVAC, electrical panel, plumbing, and water heater last replaced?
- What's the actual annual flood-insurance premium (NFIP or private), and is the property in a SFHA with mandatory coverage?
- Why hasn't it sold? Are there any deal-killer items the seller is aware of (foundation, flood, title, zoning, code violations)?
- Is there a deadline driving the sale (1031 exchange, divorce, estate, relocation)? That informs how much negotiation room exists.
- Schools are D-rated, which usually means shorter tenancies and higher turnover. Who's the typical renter profile here, and what's been the actual vacancy rate?
- Crime grade is F in this area — have there been break-ins, vandalism, or insurance claims at this property in the last 3 years? What carrier currently insures it and at what premium?
- What's the average days-on-market for RENTAL listings here right now (not sales)? A rising rental-DOM trend means longer vacancies and softer asking-rent achievability than the comps imply.
- What's the recent tenant-quality profile in this submarket — average credit score on applications, eviction rate, late-payment / NSF rate, and stable-employment percentage? A property-management company in the area should have these aggregated.
- How much new for-sale + rental construction is in the pipeline within 1–3 miles? Heavy new supply typically softens prices + rents 12–24 months out; constrained supply supports both.
Investment metrics
- 1% rule
- 1.03% ✓
- Cap rate
- 7.01%
- Cash-on-cash
- 2.55%
- DSCR
- 1.11
- GRM
- 8.1
CMA / ARV
- ARV (median comp)
- $162,310
- List price
- $110,000
- Delta
- -32.23%
- Verdict
- UNDERPRICED
- Comps
- 20 within 1.0 mi
Show comp detail 12 sales within ~0.75 mi
| Address | Dist | Beds/Ba | Sqft | Sold | Price | $/sf | Match |
|---|---|---|---|---|---|---|---|
| 6418 Calhoun Rd | 0.56mi | 2/1.5 | 945 (-0%) | 2mo | $190,000 | $201 | 70 |
| 5010 Gren St | 0.31mi | 3/1.0 (+1) | 1,017 (+7%) | 9mo | $135,000 | $133 | 61 |
| 5018 Balkin St | 0.21mi | 3/2.0 (+1) | 1,048 (+11%) | 9mo | $189,000 | $180 | 56 |
| 5303 Dewberry St | 0.29mi | 3/1.0 (+1) | 1,050 (+11%) | 11mo | $130,000 | $124 | 54 |
| 4613 Kingsbury St | 0.56mi | 2/1.0 | 1,036 (+9%) | 6mo | $105,000 | $101 | 54 |
| 5942 Southridge St | 0.68mi | 3/1.0 (+1) | 1,039 (+10%) | 9mo | $105,000 | $101 | 40 |
| 4526 Kingsbury St St | 0.65mi | 3/1.0 (+1) | 1,049 (+11%) | 9mo | $119,000 | $113 | 39 |
| 6427 Paris St | 0.59mi | 3/2.0 (+1) | 1,089 (+15%) | 0mo | $205,000 | $188 | 38 |
| 5106 Malmedy Rd | 0.54mi | 3/1.5 (+1) | 1,071 (+13%) | 9mo | $159,999 | $149 | 38 |
| 6320 Paris St | 0.61mi | 3/2.0 (+1) | 1,089 (+15%) | 0mo | $230,000 | $211 | 37 |
| 4523 Keystone St | 0.65mi | 3/2.0 (+1) | 1,073 (+13%) | 4mo | $195,000 | $182 | 35 |
| 5034 Rapido Rd | 0.69mi | 3/1.0 (+1) | 1,058 (+12%) | 12mo | $109,000 | $103 | 33 |
Match score weights: distance 35% · size 25% · config 20% · recency 20%. Top-matched comps best support the ARV.
Projected returns pro-forma
-3.0% appreciation · 2.17% rent growth · sell at horizon
- IRR
- -17.4%
- Equity multiple
- 0.39×
- Total profit
- $-18,729
- Equity at exit
- $16,401
- IRR
- -11.1%
- Equity multiple
- 0.36×
- Total profit
- $-19,776
- Equity at exit
- $9,511
Cash invested: $30,800 (down + closing). Projections, not guarantees.
Landlord ↔ Tenant lean methodology
- Overall (STATE)
- 87 Strongly Landlord-Friendly
- State Texas
- 87 Strongly Landlord-Friendly · R+5
- County
- — inherits STATE
- City
- — inherits STATE
ZIP-level market 77021
- Home prices YoY
- -23.6%
- Rents YoY
- 2.2%
- Active inventory
- 467
- Price-to-rent
- 8.1×
Monthly cashflow live
- Estimated rent
- $1,137 high interval (Pro) →
- Mortgage (P&I)
- −$577
- Tax from tax record
- −$210 /mo · $2,519/yr
- Insurance
- −$46
- Flood insurance flood zone
- −$66 /mo · $798/yr
- HOA
- −$0
- Vacancy / Maint / Mgmt
- −$239
- Net cashflow
- $-1
Break-even live
UW: 25.0% down · 7.5% · 30yr · 1.5% tax · 5.0% vac · 8.0% maint · 8.0% mgmt
Financing live
Cash to close
- Down payment
- $27,500
- Closing costs
- $3,300
- Reserves months
- —
- Total cash needed
- —
Loan-product check · same deal, 3 products live
Conventional
25% down · 7.5% · 30yr
- Down + closing
- —
- Monthly P&I
- —
- Monthly cashflow
- —
- DSCR
- —
- Eligible?
- —
Personal DTI + credit; lowest rate.
DSCR
20% down · 8.5% · 30yr
- Down + closing
- —
- Monthly P&I
- —
- Monthly cashflow
- —
- DSCR
- —
- Eligible?
- —
No personal income docs; deal must DSCR.
Hard money
10% down · 12.0% · 12mo
- Down + closing
- —
- Monthly P&I
- —
- Monthly cashflow
- —
- DSCR
- —
- Eligible?
- —
Short-term bridge; refi at stabilization.
Rent comps 25 comps
| Address | Beds | Baths | Sqft | Rent | $/sqft | DOM | Units | Dist |
|---|---|---|---|---|---|---|---|---|
| 6030 Schroeder Rd Houston, TX | 1.0 | 1.0 | 740 | $850 | $1.15 | 44d | 1 | 0.32mi |
| 5918 Schroeder Rd Houston, TX | 1.0–2.0 | 1.0 | 850 | $1,000 | $1.18 | 44d | 1 | 0.43mi |
| 5924 Schroeder Rd Houston, TX | 1.0 | 1.0 | 800 | $795 | $0.99 | 24d | 1 | 0.44mi |
| 5924 Schroeder Rd Houston, TX | 2.0 | 1.0 | 900 | $895 | $0.99 | 22d | 1 | 0.44mi |
| 5924 Schroeder Rd Houston, TX | 2.0 | 1.0 | 900 | $895 | $0.99 | 44d | 1 | 0.44mi |
| 5537 Bataan Rd Houston, TX | 2.0 | 1.0 | 880 | $1,300 | $1.48 | 44d | 1 | 0.51mi |
| 5514 Griggs Rd Unit 324 Houston, TX | 1.0 | 1.0 | 1003 | $965 | $0.96 | 8d | 1 | 0.55mi |
| 5514 Griggs Rd Unit 5565 Houston, TX | 1.0 | 1.0 | 1003 | $935 | $0.93 | 44d | 1 | 0.55mi |
| 5514 Griggs Rd Unit 5535 Houston, TX | 1.0 | 1.0 | 1003 | $1,004 | $1.00 | 11d | 1 | 0.55mi |
| 5514 Griggs Rd Unit 1165 Houston, TX | 1.0 | 1.0 | 1003 | $962 | $0.96 | 3d | 1 | 0.55mi |
| 5514 Griggs Rd Unit 5535 Houston, TX | 1.0 | 1.0 | 1003 | $940 | $0.94 | 14d | 1 | 0.55mi |
| 5514 Griggs Rd Unit 1162 Houston, TX | 1.0 | 1.0 | 1003 | $965 | $0.96 | 5d | 1 | 0.55mi |
| 5514 Griggs Rd Houston, TX | 1.0 | 1.0 | 1003 | $935 | $0.93 | 14d | 1 | 0.56mi |
| 5514 Griggs Rd Unit 1047 Houston, TX | 1.0 | 1.0 | 1003 | $1,005 | $1.00 | 11d | 1 | 0.60mi |
| 5610 Royal Palms St Houston, TX | 1.0 | 1.0 | 560 | $875 | $1.56 | 44d | 1 | 0.64mi |
| 5610 Royal Palms St Houston, TX | 2.0 | 1.0 | 900 | $950 | $1.06 | 24d | 1 | 0.64mi |
| 5520 Griggs Rd Houston, TX | 1.0 | 1.0 | 1003 | $1,030 | $1.03 | 24d | 1 | 0.66mi |
| 5600 Royal Palms St Unit 22 Houston, TX | 1.0 | 1.0 | 560 | $875 | $1.56 | 44d | 1 | 0.69mi |
| 6420 Conley St Unit 7 Houston, TX | 2.0 | 1.0 | 652 | $975 | $1.50 | 44d | 1 | 1.04mi |
| 4722 Old Spanish Trl Unit B301 Houston, TX | 2.0 | 2.0 | 1027 | $1,695 | $1.65 | 44d | 1 | 1.06mi |
| 4977 Martin Luther King Blvd Houston, TX | 1.0 | 1.0 | 630 | $1,630 | $2.59 | 44d | 1 | 1.12mi |
| 4977 Martin Luther King Blvd Houston, TX | 1.0 | 1.0 | 630 | $1,630 | $2.59 | 22d | 1 | 1.12mi |
| 4007 Corder St Houston, TX | 2.0 | 1.0 | 814 | $885 | $1.09 | 24d | 1 | 1.35mi |
| 5314 Northridge Dr Unit A Houston, TX | 3.0 | 2.0 | 872 | $1,185 | $1.36 | 44d | 1 | 1.48mi |
| 7818 Calhoun Rd Unit 8 Houston, TX | 2.0 | 1.0 | 800 | $1,200 | $1.50 | 44d | 1 | 1.49mi |
Listing history 13 events
-
2026-06-18days on market $110,000 Active 125 DOM
-
2026-06-17days on market $110,000 Active 124 DOM
-
2026-06-16days on market $110,000 Active 123 DOM
-
2026-06-15days on market $110,000 Active 122 DOM
-
2026-06-13days on market $110,000 Active 120 DOM
-
2026-06-10days on market $110,000 Active 116 DOM
-
2026-06-08days on market $110,000 Active 115 DOM
-
2026-06-07days on market $110,000 Active 114 DOM
-
2026-06-04days on market $110,000 Active 111 DOM
-
2026-06-01days on market $110,000 Active 108 DOM
-
2026-05-31days on market $110,000 Active 107 DOM
-
2026-02-13$110,000 Active 197-char remark
Show marketing remark (197 chars)
Selling: As Is. This property can be restored or torn down to build your dream home. Homebuyers looking to build instant equity, along with an investor or handyman, this corner lot home is for you.
-
1988-01-02soldstatus
ⓘ Source: listings_history table (triggers on properties + properties_extension) + one-shot
backfill from property_details.listing_events for pre-trigger history.
Tax reassessment forecast TX · Resets to sale price
- Current annual tax
- $2,519 · $210/mo
- Projected year-2 tax
- $2,519 · $210/mo
- Expected delta
- $0/yr ($0/mo · 0.0%)
ⓘ Screening estimate from a state-policy table — verify with the county assessor before closing.
Climate risk First Street
- Flood 7/10 Severe FEMA zone X (unshaded) · 99% chance over 30 yrs
- Wildfire 1/10 Low
- Heat 9/10 Extreme 7 d/yr ≥109°F today · 23 d/yr by 30 yrs out
- Wind 9/10 Extreme 99% chance of damaging wind over 30 yrs
- Air quality 2/10 Low 2 unhealthy d/yr today · 2 by 30 yrs out
Nearby sold comps map
Loading sold comps map…
Walkable amenities ~0.75 mi
Loading nearby amenities…
Taxation est. · year 1
- Rental income
- $13,641
- − Mortgage interest
- −$6,162
- − Property taxes
- −$2,519
- − Insurance
- −$1,348
- − Repairs & maintenance
- −$1,091
- − Management
- −$1,091
- − Depreciation
- −$3,200
- Taxable loss
- −$1,770
- Est. tax savings @ 24.0%
- +$425
- After-tax cash flow
- $412/yr
For passive investors: Depreciation is non-cash, so a rental often shows a tax loss while cash-flowing — sheltering income. Rental losses are passive: they offset passive income freely, and up to $25,000/yr can offset ordinary (W-2) income if you actively participate and your MAGI is under $100k (phasing out to $0 by $150k); unused losses carry forward. On sale, claimed depreciation is recaptured at up to 25%, and gains may owe capital-gains tax (a 1031 exchange can defer both). Figures are a year-1 estimate at your 24.0% rate — not tax advice; consult a CPA.
Schools (NCES district)
- District
- Houston ISD
- NCES district ID
- 4823640
- Math proficiency
- 27% ▼ -18.00%
- Reading proficiency
- 35% ▼ -6.00%
- Median HH income
- $46,054
- Composite
- 26.63/100
- National rank
- #7173
- State rank
- #593 of 826 in TX
Livability — Houston
- Score
- 74/100
- State rank
- #184
- US rank
- #4771
Category grades
Schools grade is shown separately in the Schools card above.
Census & demographics
- Census place
- Houston, TX
- County
- Harris County · 4,702,590 people
- City population
- 3,226,434
- Metro
- Houston-The Woodlands-Sugar Land, TX
- Population (ZIP)
- 26,153
- Household income
- $45,574
- Rent vs Own
- Severe rent burden
- 2532.0
Population outlook (Harris County) Hauer SSP2
- Today (2025)
- 5,571,493 people
- By 2030
- 6,089,821 · +9.3%
- By 2040
- 7,142,806 · +28.2%
- By 2050
- 8,185,864 · +46.9%
- By 2075
- 10,574,329 · +89.8%
- By 2100
- 12,109,958 · +117.4%
Race, ethnicity, and origin ACS 2023
- Neighborhood character
- Diverse neighborhood (Simpson 0.55)
- Race & ethnicity
- Black 62% Hispanic / Latino 22% Two or more races 12% White 10% Asian 2%
- Hispanic origin (detail)
- Mexican 15%
- Common ancestry
- Italian 1% Romanian 1% Lithuanian 1%
- Foreign-born
- 11% · Canada
- Languages at home
- 77% English-only · Spanish 19% French/Haitian/Cajun 1% Other Indo-European 1%
Political lean MEDSL · Harris
- 2024 margin
- Lean D (+5.5) · D 52.0% · R 46.4% · Other 1.6%
- 2008→2024 swing
- +3.9pp toward D · 2008: 1.6pp · 2024: 5.5pp
- All cycles
- 2024: D+5.5 2020: D+13.3 2016: D+12.4 2012: D+0.1 2008: D+1.6
Not yet ingested
- Civics
- —
Market trends
- HPI YoY
- ▼ -71.22%
- Current HPI
- 230.2869
- Rent YoY
- ▲ 2.17%
- Metro
- Houston-The Woodlands-Sugar Land, TX
- State GDP YoY
- ▲ 3.95%
- F500 in state
- 110
Industry mix (Fortune 500 HQ in TX)
| Industry | F500 HQs | Revenue |
|---|---|---|
| Energy | 16 | $1,198B |
|
||
| Technology | 5 | $198B |
|
||
| Engineering / Construction | 4 | $72B |
|
||
| Energy Services | 3 | $60B |
|
||
| Utilities | 3 | $41B |
|
||
| Healthcare | 2 | $330B |
|
||
Price history
2 events — show timeline
- 2026-02-13 Listed $110,000 HARMLS
- 1988-01-02 Sold (Public Records) — Public Records
Property tax history
+2.0%/yrLatest (2025): $2,519 · +8.3% YoY. Source: county tax records.
Cash-flow waterfall
monthlySold comps — $/sqft
last 12 mo · ≤1 miLoading sold comps…