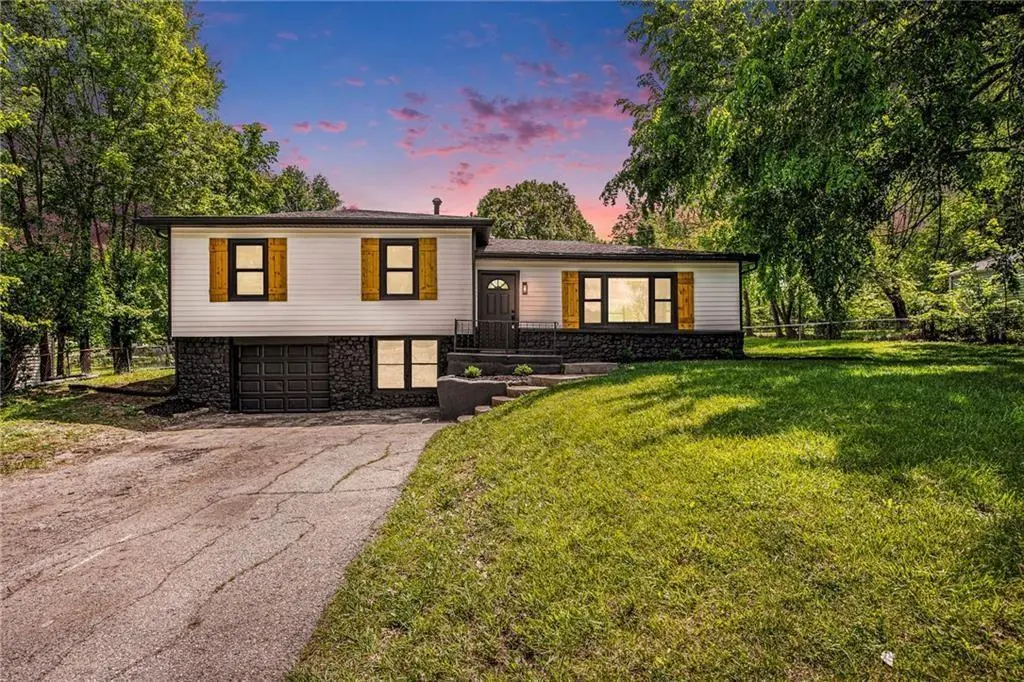
16105 Oakland Ave · Belton, MO
Flood risk 1/10 · Minimal
- FEMA flood zone
- X (unshaded)
- Chance of flooding over 30 yrs
- 0.0%
- Est. flood insurance / yr
- $473 – $860
Fire risk 1/10 · Minimal
- Est. fire insurance / yr
- $1,054 – $1,958
Heat risk 4/10 · Minor
- Hot days now (above 107°F)
- 7 days/yr
- Hot days in 30 yrs
- 17 days/yr
Wind risk 2/10 · Minimal
- Chance of severe wind over 30 yrs
- —
Air-quality risk 2/10 · Minimal
- Unhealthy air days now
- 2 days/yr
- Unhealthy air days in 30 yrs
- 2 days/yr
Risk factors via First Street. Map © Google.
Why this score? — see what drove the D+ grade
The composite is a weighted blend of 9 inputs, each scored 0–100. Each bar is that input's sub-score; the figure is the points it added to the 100-point composite (weight × sub-score).
- Cash flow +15.3/30.0
- ARV discount +8.9/15.0
- DSCR +4.7/10.0
- Rent growth +3.8/5.0
- Livability +3.8/5.0
- 1% rule +3.4/10.0
- Schools +3.0/10.0
- Condition / age +2.5/5.0
- Appreciation +0.0/10.0
$235,000
🖨 Deal sheet (PDF) 📄 Offer letter ✓ Due diligence
Listing remarks MLS
Beautifully remodeled and ready for you to move in! This stylish split-level home in Belton sits on a spacious lot with mature trees and a fully fenced backyard—ideal for pets, entertaining, or simply enjoying the outdoors. The striking exterior features fresh paint, custom shutters, and modern black stone accents for standout curb appeal. Inside, you'll find a bright and open concept layout with stunning refinished hardwood floors throughout. The living room is centered around a sleek, custom fireplace with wood beam detail, creating the perfect ambiance. The kitchen boasts all new white shaker cabinetry, granite countertops, stainless steel appliances, modern light fixtures, and a custom tile backsplash—perfect for cooking and hosting. The home includes 3 bedrooms and 1.5 updated bathrooms, including a beautiful full bath with contemporary tile and matte black fixtures. The generous primary bedroom offers double closets and an en-suite half bath. Downstairs, the freshly painted walk-out basement provides extra storage or potential for future finishing. An attached garage adds convenience and security. Enjoy the large patio out back, perfect for summer gatherings or quiet mornings. Located near schools, parks, and easy highway access, this home combines comfort, style, and convenience. Don’t miss your chance to own this turn-key beauty in a quiet neighborhood!
Key facts
- 0.38 acre lot
- Garage
- Built 1959
Property features AI
Finance
- Other: Living area reported as 1,226 (source: public records)
Exterior
- Parking: Basement access to parking; One-car garage
- Utilities: Public water; Public sewer
- Home design: Single family residence; Residential property; One-story layout (main living on main level)
- Construction: Frame construction; Composition roof; Built approximately 51–75 years ago
- Exterior features: Lot approximately 16,509 square feet
Interior
- Bedrooms: Three bedrooms on the main level
- Bathrooms: One full bathroom on the main level; One half bathroom on the main level
- Heating & cooling: Natural gas heating; Electric cooling (central)
- Interior features: Side/side split floor plan; Partial basement; One fireplace
Neighborhood map
What this means for you Summary
Snapshot
- This is a 3-bed/1.5-bath single-family listed at $235k.
Deal economics
- At list price, monthly cash flow is $85 ($1k/yr) — positive.
- The deal already cash-flows at list — no discount required.
- To meet the 1% rule (rent ≥ 1% of price), the offer needs to be $198k (15.8% below list).
- Recommended offer: $198k (15.8% below list) — sets the bar for 1% rule.
- Cap rate 6.7% vs local median 4.7% in Belton — top-decile yield for the area; either an underpriced asset or a hidden risk that comps aren't pricing in. Stress-test before assuming the spread holds.
Location & tenants
- Location reads 76/100 on livability (#52 in MO, #3,782 nationally) — a middle-class / working-renter tenant base. Strengths: cost of living A+, housing A+, health & safety A+; Watch: crime C-, commute F.
- Belton 124 (suburban): math 28% / reading 39% proficiency, ranked #216 of 324 in MO (top 67%) — families likely to look elsewhere, expect single-tenant / working-renter base with shorter leases.
- Zoned schools: Wilckens Steam Acad @Hillcrest (math 44% / reading 47%, grade D-, #405 of 1,115 statewide, top 37%, 474 students, 37% FRL); Belton Middle School (math 24% / reading 35%, grade F, #291 of 391 statewide, top 76%, 639 students, 46% FRL); Belton High (math 27% / reading 59%, grade F, #211 of 521 statewide, top 41%, 1,374 students, 42% FRL) — zoned schools at 42% FRL track the district average.
- Market conditions: Rents rising fast (+5.2%/yr); 205 active listings in the ZIP; 4 comparable units currently listed for rent nearby; rentals at typical pace (median 26d on market — plan ~3-4 weeks tenant-placement turnaround); 588 units permitted in Cass County in 2024 (0 in 5+ unit buildings).
- This rent runs 33% of the median local income ($72k/yr) — at the standard rent-burdened threshold; future hikes will face affordability resistance.
Forward outlook
- Local home prices are declining (-3.0%/yr); year-one equity from $2k of loan paydown is wiped out by about $7k of value loss. Plan a longer hold.
- Cass County population projected to shrink 3% by 2050 — rents likely to lag national; underwrite the cash flow, not the appreciation.
Negotiation context
- Only 3 days on market — expect competitive offers; lowballing is unlikely to land.
- 2 sale attempts; this cycle's ask has dropped $40k (15%) from the opening price — seller is motivated, your offer sets the floor, not the list.
Risks & watch-outs
- Watch-outs: built in 1959 — expect roof / HVAC / electrical / plumbing capex.
Questions for the listing agent
- Built in 1959 — when were the roof, HVAC, electrical panel, plumbing, and water heater last replaced?
- Is there a deadline driving the sale (1031 exchange, divorce, estate, relocation)? That informs how much negotiation room exists.
- Schools are D-rated, which usually means shorter tenancies and higher turnover. Who's the typical renter profile here, and what's been the actual vacancy rate?
- The area grade is low — what's the realistic commute time and amenity access for the typical tenant pool here? Any planned neighborhood developments (good or bad) we should know about?
- What's the average days-on-market for RENTAL listings here right now (not sales)? A rising rental-DOM trend means longer vacancies and softer asking-rent achievability than the comps imply.
- What's the recent tenant-quality profile in this submarket — average credit score on applications, eviction rate, late-payment / NSF rate, and stable-employment percentage? A property-management company in the area should have these aggregated.
- How much new for-sale + rental construction is in the pipeline within 1–3 miles? Heavy new supply typically softens prices + rents 12–24 months out; constrained supply supports both.
Investment metrics
- 1% rule
- 0.84% ✗
- Cap rate
- 6.72%
- Cash-on-cash
- 1.54%
- DSCR
- 1.07
- GRM
- 9.9
CMA / ARV
- ARV (on-the-fly)
- $242,748
- Comps found
- 12
Show comp detail 12 sales within ~0.75 mi
| Address | Dist | Beds/Ba | Sqft | Sold | Price | $/sf | Match |
|---|---|---|---|---|---|---|---|
| 16105 Oakland Ave | 0.00mi | 3/1.5 | 1,226 (0%) | 11mo | $220,000 | $179 | 91 |
| 16111 Richmond Ave W | 0.08mi | 3/2.0 | 1,284 (+5%) | 9mo | $275,000 | $214 | 79 |
| 16108 Speaker Ave | 0.31mi | 2/2.0 (-1) | 1,260 (+3%) | 1mo | $224,999 | $179 | 73 |
| 16006 Lawrence Ave | 0.42mi | 3/2.0 | 1,186 (-3%) | 0mo | $255,000 | $215 | 73 |
| 7209 E 162nd St | 0.09mi | 3/2.0 | 1,170 (-5%) | 20mo | $217,900 | $186 | 69 |
| 16403 Rebecca Ln | 0.64mi | 3/2.0 | 1,178 (-4%) | 1mo | $205,000 | $174 | 61 |
| 16112 Harris Ave | 0.39mi | 3/2.0 | 1,148 (-6%) | 12mo | $255,000 | $222 | 59 |
| 15803 Lawrence Ave | 0.56mi | 3/2.0 | 1,299 (+6%) | 8mo | $275,000 | $212 | 55 |
| 16010 Allen Ave | 0.67mi | 3/2.0 | 1,200 (-2%) | 13mo | $235,000 | $196 | 53 |
| 15900 Hight Ave | 0.33mi | 3/2.5 | 1,400 (+14%) | 8mo | $277,898 | $198 | 50 |
| 16407 Speaker Ave | 0.52mi | 3/2.0 | 1,276 (+4%) | 21mo | $293,000 | $230 | 50 |
| 16011 Ann Ave | 0.51mi | 3/2.5 | 1,406 (+15%) | 16mo | $250,000 | $178 | 34 |
Match score weights: distance 35% · size 25% · config 20% · recency 20%. Top-matched comps best support the ARV.
Projected returns pro-forma
-3.0% appreciation · 5.17% rent growth · sell at horizon
- IRR
- -11.7%
- Equity multiple
- 0.57×
- Total profit
- $-28,340
- Equity at exit
- $35,039
- IRR
- 0.2%
- Equity multiple
- 1.01×
- Total profit
- $950
- Equity at exit
- $20,319
Cash invested: $65,800 (down + closing). Projections, not guarantees.
Landlord ↔ Tenant lean methodology
- Overall (STATE)
- 81 Strongly Landlord-Friendly
- State Missouri
- 81 Strongly Landlord-Friendly · R+10
- County
- — inherits STATE
- City
- — inherits STATE
ZIP-level market 64012
- Rents YoY
- 5.2%
- Active inventory
- 205
- Price-to-rent
- 9.9×
Monthly cashflow live
- Estimated rent
- $1,979 medium interval (Pro) →
- Mortgage (P&I)
- −$1,232
- Tax from tax record
- −$148 /mo · $1,781/yr
- Insurance
- −$98
- HOA
- −$0
- Vacancy / Maint / Mgmt
- −$416
- Net cashflow
- $85
Break-even live
Sensitivity live
| Price | -10% $218 | -5% $151 | +0% $85 | +5% $18 | +10% $-48 |
|---|---|---|---|---|---|
| Rent | -10% $-72 | -5% $6 | +0% $85 | +5% $163 | +10% $241 |
| Rate | -1.0pp $203 | -0.5pp $144 | base $85 | +0.5pp $24 | +1.0pp $-38 |
UW: 25.0% down · 7.5% · 30yr · 1.5% tax · 5.0% vac · 8.0% maint · 8.0% mgmt
Financing live
Cash to close
- Down payment
- $58,750
- Closing costs
- $7,050
- Reserves months
- —
- Total cash needed
- —
Loan-product check · same deal, 3 products live
Conventional
25% down · 7.5% · 30yr
- Down + closing
- —
- Monthly P&I
- —
- Monthly cashflow
- —
- DSCR
- —
- Eligible?
- —
Personal DTI + credit; lowest rate.
DSCR
20% down · 8.5% · 30yr
- Down + closing
- —
- Monthly P&I
- —
- Monthly cashflow
- —
- DSCR
- —
- Eligible?
- —
No personal income docs; deal must DSCR.
Hard money
10% down · 12.0% · 12mo
- Down + closing
- —
- Monthly P&I
- —
- Monthly cashflow
- —
- DSCR
- —
- Eligible?
- —
Short-term bridge; refi at stabilization.
Rent comps 4 comps
| Address | Beds | Baths | Sqft | Rent | $/sqft | DOM | Units | Dist |
|---|---|---|---|---|---|---|---|---|
| 16311 Hight Ave Belton, MO | 4.0 | 3.0 | 1308 | $2,285 | $1.75 | 6d | 1 | 0.39mi |
| 301 Towne Center Dr Belton, MO | 1.0–2.0 | 1.0–2.0 | 1069 | $1,799 | $1.68 | 3d | 9 | 1.03mi |
| 15319 Grand Summit Ext Grandview, MO | 1.0–2.0 | 1.0–2.0 | 818 | $1,150 | $1.41 | 45d | 1 | 1.04mi |
| 8201 Spring Valley Rd Apt 13D Belton, MO | 2.0 | 1.0 | 750 | $850 | $1.13 | 25d | 1 | 1.19mi |
Listing history 3 events
-
2026-06-07statusdays on market $235,000 Pending 3 DOM
-
2026-06-05status $235,000 Active 1 DOM
-
2026-06-02$235,000 Coming Soon 1 DOM
ⓘ Source: listings_history table (triggers on properties + properties_extension) + one-shot
backfill from property_details.listing_events for pre-trigger history.
Tax reassessment forecast MO · Resets to sale price
- Current annual tax
- $1,781 · $148/mo
- Projected year-2 tax
- $2,280 · $190/mo
- Expected delta
- +$499/yr (+$42/mo · 28.0%)
ⓘ Screening estimate from a state-policy table — verify with the county assessor before closing.
Climate risk First Street
- Flood 1/10 Low FEMA zone X (unshaded) · 0% chance over 30 yrs
- Wildfire 1/10 Low
- Heat 4/10 Moderate 7 d/yr ≥107°F today · 17 d/yr by 30 yrs out
- Wind 2/10 Low
- Air quality 2/10 Low 2 unhealthy d/yr today · 2 by 30 yrs out
Nearby sold comps map
Loading sold comps map…
Walkable amenities ~0.75 mi
Loading nearby amenities…
Taxation est. · year 1
- Rental income
- $23,745
- − Mortgage interest
- −$13,164
- − Property taxes
- −$1,781
- − Insurance
- −$1,175
- − Repairs & maintenance
- −$1,900
- − Management
- −$1,900
- − Depreciation
- −$6,836
- Taxable loss
- −$3,010
- Est. tax savings @ 24.0%
- +$722
- After-tax cash flow
- $1,737/yr
For passive investors: Depreciation is non-cash, so a rental often shows a tax loss while cash-flowing — sheltering income. Rental losses are passive: they offset passive income freely, and up to $25,000/yr can offset ordinary (W-2) income if you actively participate and your MAGI is under $100k (phasing out to $0 by $150k); unused losses carry forward. On sale, claimed depreciation is recaptured at up to 25%, and gains may owe capital-gains tax (a 1031 exchange can defer both). Figures are a year-1 estimate at your 24.0% rate — not tax advice; consult a CPA.
Schools (NCES district)
- District
- Belton 124
- NCES district ID
- 2904620
- Math proficiency
- 28% ▼ -9.00%
- Reading proficiency
- 39% ▼ -9.00%
- Median HH income
- $56,946
- Composite
- 29.73/100
- National rank
- #6446
- State rank
- #216 of 324 in MO
Livability — Belton
- Score
- 76/100
- State rank
- #52
- US rank
- #3782
Category grades
Schools grade is shown separately in the Schools card above.
Census & demographics
- Census place
- Belton, MO
- County
- Cass County · 65,358 people
- City population
- 29,304
- Metro
- Kansas City, MO-KS
- Population (ZIP)
- 29,304
- Household income
- $71,814
- Rent vs Own
- Severe rent burden
- 1081.0
Population outlook (Cass County) Hauer SSP2
- Today (2025)
- 105,292 people
- By 2030
- 106,109 · +0.8%
- By 2040
- 105,786 · +0.5%
- By 2050
- 102,062 · -3.1%
- By 2075
- 88,569 · -15.9%
- By 2100
- 68,293 · -35.1%
Race, ethnicity, and origin ACS 2023
- Neighborhood character
- Predominantly White (80%)
- Race & ethnicity
- White 80% Two or more races 7% Hispanic / Latino 7% Black 6% Asian 1%
- Hispanic origin (detail)
- Mexican 5%
- Common ancestry
- Italian 2% Lithuanian 2% Portuguese 2%
- Foreign-born
- 2% · Canada
- Languages at home
- 96% English-only · Spanish 2% German/W. Germanic 1% Other Asian/Pacific 1%
Political lean MEDSL · Cass
- 2024 margin
- Solid R (+32.1) · D 33.3% · R 65.4% · Other 1.3%
- 2008→2024 swing
- -12.5pp toward R · 2008: -19.6pp · 2024: -32.1pp
- All cycles
- 2024: R+32.1 2020: R+31.6 2016: R+35.9 2012: R+28.4 2008: R+19.6
Not yet ingested
- Civics
- —
Market trends
- HPI YoY
- ▼ -244.76%
- Current HPI
- 214.6157
- Rent YoY
- ▲ 5.17%
- Metro
- Kansas City, MO-KS
- State GDP YoY
- ▲ 1.84%
- F500 in state
- 20
Industry mix (Fortune 500 HQ in MO)
| Industry | F500 HQs | Revenue |
|---|---|---|
| Healthcare | 1 | $163B |
|
||
| Insurance | 1 | $21B |
|
||
| Industrial Technology | 1 | $17B |
|
||
| Retail | 1 | $16B |
|
||
| Industrial Distribution | 1 | $10B |
|
||
| Utilities | 1 | $9B |
|
||
Price history
-14.5% since first listed12 events — show timeline
- 2026-06-02 Coming Soon $235,000 Heartland MLS as Distributed by MLS Grid
- 2025-08-04 Sold (Public Records) — Public Records
- 2025-08-04 Sold (MLS) — Heartland MLS as Distributed by MLS Grid
- 2025-07-03 Pending — Heartland MLS as Distributed by MLS Grid
- 2025-06-26 Price Changed $220,000 Heartland MLS as Distributed by MLS Grid
- 2025-06-19 Relisted — Heartland MLS as Distributed by MLS Grid
- 2025-06-16 Pending — Heartland MLS as Distributed by MLS Grid
- 2025-06-02 Price Changed $245,000 Heartland MLS as Distributed by MLS Grid
- 2025-05-28 Price Changed $255,000 Heartland MLS as Distributed by MLS Grid
- 2025-05-12 Price Changed $265,000 Heartland MLS as Distributed by MLS Grid
- 2025-05-08 Listed $275,000 Heartland MLS as Distributed by MLS Grid
- 2010-04-28 Sold (Public Records) — Public Records
Property tax history
+4.0%/yrLatest (2025): $1,781 · +12.3% YoY. Source: county tax records.
Cash-flow waterfall
monthlySold comps — $/sqft
last 12 mo · ≤1 miLoading sold comps…