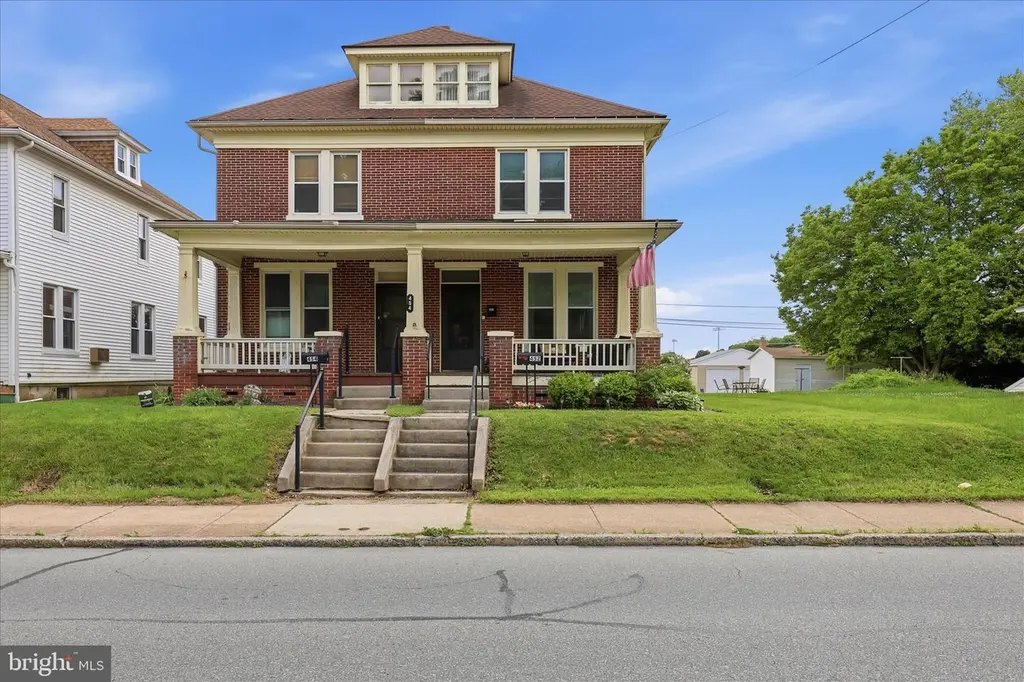
452 S Main St · Red Lion, PA
Flood risk 1/10 · Minimal
- FEMA flood zone
- X (unshaded)
- Chance of flooding over 30 yrs
- 0.0%
- Est. flood insurance / yr
- $473 – $860
Fire risk 1/10 · Minimal
- Est. fire insurance / yr
- $511 – $949
Heat risk 5/10 · Moderate
- Hot days now (above 100°F)
- 7 days/yr
- Hot days in 30 yrs
- 15 days/yr
Wind risk 4/10 · Minor
- Chance of severe wind over 30 yrs
- 14.0%
Air-quality risk 3/10 · Minor
- Unhealthy air days now
- 2 days/yr
- Unhealthy air days in 30 yrs
- 5 days/yr
Risk factors via First Street. Map © Google.
Why this score? — see what drove the F grade
The composite is a weighted blend of 9 inputs, each scored 0–100. Each bar is that input's sub-score; the figure is the points it added to the 100-point composite (weight × sub-score).
- Cash flow +8.1/30.0
- Livability +3.9/5.0
- Schools +3.8/10.0
- Rent growth +2.5/5.0
- Condition / age +2.5/5.0
- 1% rule +2.3/10.0
- DSCR +2.2/10.0
- ARV discount +0.0/15.0
- Appreciation +0.0/10.0
$215,000
🖨 Deal sheet (PDF) 📄 Offer letter ✓ Due diligence
Listing remarks MLS
Now is the time to buy! Interest rates remain low and this 3BR brick semi-detached is the perfect home to own! Low Maintenance and Turn-Key Condition! Detached 1-car garage with oversize parking pad; beautiful updated kitchen with ceramic tile backsplash; hardwood floors and natural woodwork. Another great feature, it's located within walking distance of Red Lion HS, parks, recreation, and small-town conveniences.
Key facts
- Garage
- Built 1924
- Listed 3 days
Property features AI
Finance
- Other: Not in a federal flood zone; Pets allowed with no restrictions; 2+ access exits (accessibility feature)
Exterior
- Parking: Detached rear-entry garage (1 car); Gravel driveway; One total garage/parking space
- Utilities: Public water; Public sewer
- Home design: Semi-detached property; Very good to excellent condition; Fee simple ownership
- Construction: Brick and vinyl siding exterior; Concrete perimeter foundation; Basement with poured concrete; Basement present (above-grade and below-grade space)
- Exterior features: Balcony; Brick patio; Patio(s); Porch(es); Awnings; Play area; Sidewalks; Privacy fencing
Interior
- Kitchen: Kitchen island; Electric range/oven; Microwave; Refrigerator; Dishwasher
- Bedrooms: Three bedrooms on the upper level
- Flooring: Hardwood; Luxury vinyl plank; Tile or brick
- Bathrooms: One full bathroom
- Heating & cooling: Hot water heating; Central heating; Window air conditioning units; Electric cooling fuel; Natural gas heating and hot water
- Interior features: Attic; Tub with shower; Breakfast area; Built-in shelving; Ceiling fans; Open combination dining and living area; Crown molding; Kitchen island; Wood floors
- Laundry & utility: Washer and dryer; Laundry located in the basement
Neighborhood map
What this means for you Summary
Snapshot
- This is a 3-bed/1.0-bath townhouse listed at $215k.
Deal economics
- At list price, monthly cash flow is $-207 ($-2k/yr) — negative.
- To cash-flow at today's rent, offer at most $178k (17.0% below list).
- To meet the 1% rule (rent ≥ 1% of price), the offer needs to be $157k (27.1% below list).
- Recommended offer: $157k (27.1% below list) — sets the bar for 1% rule.
Location & tenants
- Location reads 77/100 on livability (#349 in PA, #3,056 nationally) — a middle-class / working-renter tenant base. Strengths: cost of living A+, housing A+, health & safety A+; Watch: amenities D, commute F.
- Red Lion Area SD (suburban): math 36% / reading 50% proficiency, ranked #282 of 539 in PA (top 52%) — families likely to look elsewhere, expect single-tenant / working-renter base with shorter leases.
- Zoned schools: Pleasant View El Sch (math 33% / reading 53%, grade F, #873 of 1,518 statewide, top 58%, 453 students, 49% FRL); Red Lion Area Jhs (math 23% / reading 49%, grade F, #313 of 512 statewide, top 62%, 813 students, 50% FRL); Red Lion Area Shs (math 63% / reading 24%, grade F, #211 of 437 statewide, top 48%, 1,432 students, 44% FRL) — zoned schools average 47% FRL vs 28% district-wide (19 pts higher); higher-poverty schools than district average — tighter screening recommended.
- Market conditions: 147 active listings in the ZIP; 7 comparable units currently listed for rent nearby; rentals lingering (median 46d on market — plan ~5-8 weeks vacancy on turnover, expect pricing pressure); 57% of comp listings sitting > 30 days — soft ceiling on asking rent; solid renter incomes; 1,328 units permitted in York County in 2024 (338 in 5+ unit buildings).
Forward outlook
- Local home prices are declining (-3.0%/yr); year-one equity from $1k of loan paydown is wiped out by about $6k of value loss. Plan a longer hold.
Negotiation context
- Only 3 days on market — expect competitive offers; lowballing is unlikely to land.
- 2 sale attempts since 10y ago with the ask held roughly flat each time — persistent listings suggest the price (not the market) is what's stuck; bring a comps-based counter.
- Current owner paid $138k; list at $215k implies a 55% gain — meaningful room to come down on a strong offer.
Risks & watch-outs
- Watch-outs: built in 1924 — expect roof / HVAC / electrical / plumbing capex.
- Climate carrying-cost: extreme-heat days projected 7→15/yr by 2055 (HVAC capex compounding) — expect insurance premiums to compound above CPI over the hold.
Questions for the listing agent
- What do current leases actually rent for vs. the listed asking? Can we see a recent rent roll and the last 12 months of T-12 income?
- Built in 1924 — when were the roof, HVAC, electrical panel, plumbing, and water heater last replaced?
- Is there a deadline driving the sale (1031 exchange, divorce, estate, relocation)? That informs how much negotiation room exists.
- The area grade is low — what's the realistic commute time and amenity access for the typical tenant pool here? Any planned neighborhood developments (good or bad) we should know about?
- What's the average days-on-market for RENTAL listings here right now (not sales)? A rising rental-DOM trend means longer vacancies and softer asking-rent achievability than the comps imply.
- What's the recent tenant-quality profile in this submarket — average credit score on applications, eviction rate, late-payment / NSF rate, and stable-employment percentage? A property-management company in the area should have these aggregated.
- How much new for-sale + rental construction is in the pipeline within 1–3 miles? Heavy new supply typically softens prices + rents 12–24 months out; constrained supply supports both.
Investment metrics
- 1% rule
- 0.73% ✗
- Cap rate
- 5.14%
- Cash-on-cash
- -4.12%
- DSCR
- 0.82
- GRM
- 11.4
CMA / ARV
- ARV (on-the-fly)
- $181,632
- Comps found
- 12
Show comp detail 12 sales within ~0.75 mi
| Address | Dist | Beds/Ba | Sqft | Sold | Price | $/sf | Match |
|---|---|---|---|---|---|---|---|
| 28 Pleasant Ave | 0.53mi | 3/1.0 | 1,386 (-2%) | 5mo | $160,000 | $115 | 68 |
| 316 W Broadway | 0.51mi | 3/1.0 | 1,478 (+5%) | 3mo | $202,500 | $137 | 66 |
| 11 E Lancaster St | 0.27mi | 4/1.5 (+1) | 1,523 (+8%) | 4mo | $192,500 | $126 | 64 |
| 171 Linden Ave | 0.64mi | 3/1.0 | 1,344 (-4%) | 2mo | $174,000 | $129 | 61 |
| 317 S Main St | 0.12mi | 4/1.5 (+1) | 1,612 (+14%) | 10mo | $215,000 | $133 | 55 |
| 118 Keener Ave | 0.66mi | 3/— | 1,286 (-9%) | 1mo | $176,750 | $137 | 54 |
| 327 1st Ave | 0.62mi | 4/2.0 (+1) | 1,471 (+4%) | 1mo | $205,000 | $139 | 54 |
| 79 E 1st Ave | 0.55mi | 4/1.5 (+1) | 1,484 (+5%) | 6mo | $168,500 | $114 | 53 |
| 130 Linden Ave | 0.65mi | 3/1.0 | 1,496 (+6%) | 9mo | $16,756 | $11 | 52 |
| 81 W 1st Ave Unit E | 0.55mi | 4/2.0 (+1) | 1,484 (+5%) | 6mo | $168,500 | $114 | 51 |
| 124 Linden Ave | 0.64mi | 3/1.0 | 1,496 (+6%) | 11mo | $156,000 | $104 | 51 |
| 217 N Charles St | 0.70mi | 3/2.0 | 1,500 (+6%) | 5mo | $222,500 | $148 | 48 |
Match score weights: distance 35% · size 25% · config 20% · recency 20%. Top-matched comps best support the ARV.
Projected returns pro-forma
-3.0% appreciation · 3.0% rent growth · sell at horizon
- IRR
- -23.3%
- Equity multiple
- 0.20×
- Total profit
- $-48,009
- Equity at exit
- $32,057
- IRR
- -17.9%
- Equity multiple
- 0.02×
- Total profit
- $-58,768
- Equity at exit
- $18,589
Cash invested: $60,200 (down + closing). Projections, not guarantees.
Landlord ↔ Tenant lean methodology
- Overall (STATE)
- 62 Landlord-Friendly
- State Pennsylvania
- 62 Landlord-Friendly · EVEN
- County
- — inherits STATE
- City
- — inherits STATE
ZIP-level market 17356
- Home prices YoY
- -21.0%
- Active inventory
- 147
- Price-to-rent
- 11.4×
Monthly cashflow live
- Estimated rent
- $1,567 high interval (Pro) →
- Mortgage (P&I)
- −$1,127
- Tax from tax record
- −$228 /mo · $2,733/yr
- Insurance
- −$90
- HOA
- −$0
- Vacancy / Maint / Mgmt
- −$329
- Net cashflow
- $-207
Break-even live
Sensitivity live
| Price | -10% $-85 | -5% $-146 | +0% $-207 | +5% $-268 | +10% $-328 |
|---|---|---|---|---|---|
| Rent | -10% $-331 | -5% $-269 | +0% $-207 | +5% $-145 | +10% $-83 |
| Rate | -1.0pp $-98 | -0.5pp $-152 | base $-207 | +0.5pp $-262 | +1.0pp $-319 |
UW: 25.0% down · 7.5% · 30yr · 1.5% tax · 5.0% vac · 8.0% maint · 8.0% mgmt
Financing live
Cash to close
- Down payment
- $53,750
- Closing costs
- $6,450
- Reserves months
- —
- Total cash needed
- —
Loan-product check · same deal, 3 products live
Conventional
25% down · 7.5% · 30yr
- Down + closing
- —
- Monthly P&I
- —
- Monthly cashflow
- —
- DSCR
- —
- Eligible?
- —
Personal DTI + credit; lowest rate.
DSCR
20% down · 8.5% · 30yr
- Down + closing
- —
- Monthly P&I
- —
- Monthly cashflow
- —
- DSCR
- —
- Eligible?
- —
No personal income docs; deal must DSCR.
Hard money
10% down · 12.0% · 12mo
- Down + closing
- —
- Monthly P&I
- —
- Monthly cashflow
- —
- DSCR
- —
- Eligible?
- —
Short-term bridge; refi at stabilization.
Rent comps 7 comps
| Address | Beds | Baths | Sqft | Rent | $/sqft | DOM | Units | Dist |
|---|---|---|---|---|---|---|---|---|
| 21 E Lancaster St Red Lion, PA | 2.0 | 1.0 | 900 | $1,295 | $1.44 | 46d | 1 | 0.29mi |
| 305 W Broadway Red Lion, PA | 2.0 | 1.0 | 968 | $1,395 | $1.44 | 46d | 1 | 0.50mi |
| 16 W High St Red Lion, PA | 3.0 | 1.0 | 1075 | $1,075 | $1.00 | 23d | 1 | 0.61mi |
| 705 Country Club Rd Red Lion, PA | 3.0 | 2.5 | 1660 | $1,695 | $1.02 | 46d | 1 | 0.84mi |
| 703 Country Club Rd Red Lion, PA | 3.0 | 2.5 | 1540 | $1,795 | $1.17 | 46d | 1 | 0.85mi |
| 201 Burrows Rd Red Lion, PA | 3.0 | 2.5 | 1485 | $1,924 | $1.30 | 15d | 1 | 1.24mi |
| 118 W Main St Windsor, PA | 2.0 | 1.0 | 1402 | $1,150 | $0.82 | 23d | 1 | 1.47mi |
Listing history 8 events
-
2026-05-23$215,000 Active
-
2026-05-16historical $215,000
-
2021-02-22soldstatus $138,500
-
2016-05-02soldstatus $119,000
-
2016-04-29soldstatus $119,000 417-char remark
Show marketing remark (417 chars)
Now is the time to buy! Interest rates remain low and this 3BR brick semi-detached is the perfect home to own! Low Maintenance and Turn-Key Condition! Detached 1-car garage with oversize parking pad; beautiful updated kitchen with ceramic tile backsplash; hardwood floors and natural woodwork. Another great feature, it's located within walking distance of Red Lion HS, parks, recreation, and small-town conveniences.
-
2016-03-19historical 417-char remark
Show marketing remark (417 chars)
Now is the time to buy! Interest rates remain low and this 3BR brick semi-detached is the perfect home to own! Low Maintenance and Turn-Key Condition! Detached 1-car garage with oversize parking pad; beautiful updated kitchen with ceramic tile backsplash; hardwood floors and natural woodwork. Another great feature, it's located within walking distance of Red Lion HS, parks, recreation, and small-town conveniences.
-
2016-03-09$119,000 417-char remark
Show marketing remark (417 chars)
Now is the time to buy! Interest rates remain low and this 3BR brick semi-detached is the perfect home to own! Low Maintenance and Turn-Key Condition! Detached 1-car garage with oversize parking pad; beautiful updated kitchen with ceramic tile backsplash; hardwood floors and natural woodwork. Another great feature, it's located within walking distance of Red Lion HS, parks, recreation, and small-town conveniences.
-
1987-08-21soldstatus $42,500
ⓘ Source: listings_history table (triggers on properties + properties_extension) + one-shot
backfill from property_details.listing_events for pre-trigger history.
Tax reassessment forecast PA · Partial reset (capped growth)
- Current annual tax
- $2,733 · $228/mo
- Projected year-2 tax
- $3,065 · $255/mo
- Expected delta
- +$332/yr (+$28/mo · 12.1%)
ⓘ Screening estimate from a state-policy table — verify with the county assessor before closing.
Climate risk First Street
- Flood 1/10 Low FEMA zone X (unshaded) · 0% chance over 30 yrs
- Wildfire 1/10 Low
- Heat 5/10 Major 7 d/yr ≥100°F today · 15 d/yr by 30 yrs out
- Wind 4/10 Moderate 14% chance of damaging wind over 30 yrs
- Air quality 3/10 Moderate 2 unhealthy d/yr today · 5 by 30 yrs out
Nearby sold comps map
Loading sold comps map…
Walkable amenities ~0.75 mi
Loading nearby amenities…
Taxation est. · year 1
- Rental income
- $18,806
- − Mortgage interest
- −$12,043
- − Property taxes
- −$2,733
- − Insurance
- −$1,075
- − Repairs & maintenance
- −$1,504
- − Management
- −$1,504
- − Depreciation
- −$6,255
- Taxable loss
- −$6,309
- Est. tax savings @ 24.0%
- +$1,514
- After-tax cash flow
- $-967/yr
For passive investors: Depreciation is non-cash, so a rental often shows a tax loss while cash-flowing — sheltering income. Rental losses are passive: they offset passive income freely, and up to $25,000/yr can offset ordinary (W-2) income if you actively participate and your MAGI is under $100k (phasing out to $0 by $150k); unused losses carry forward. On sale, claimed depreciation is recaptured at up to 25%, and gains may owe capital-gains tax (a 1031 exchange can defer both). Figures are a year-1 estimate at your 24.0% rate — not tax advice; consult a CPA.
Schools (NCES district)
- District
- Red Lion Area SD
- NCES district ID
- 4220100
- Math proficiency
- 36% ▼ -10.00%
- Reading proficiency
- 50% ▼ -10.00%
- Median HH income
- $60,225
- Composite
- 37.91/100
- National rank
- #4313
- State rank
- #282 of 539 in PA
Livability — Red Lion
- Score
- 77/100
- State rank
- #349
- US rank
- #3056
Category grades
Schools grade is shown separately in the Schools card above.
Census & demographics
- Census place
- Red Lion, PA
- County
- York County · 278,806 people
- City population
- 22,869
- Metro
- York-Hanover, PA
- Population (ZIP)
- 22,869
- Household income
- $86,561
- Rent vs Own
- Severe rent burden
- 559.0
Population outlook (York County) Hauer SSP2
- Today (2025)
- 454,205 people
- By 2030
- 457,407 · +0.7%
- By 2040
- 457,529 · +0.7%
- By 2050
- 448,261 · -1.3%
- By 2075
- 427,388 · -5.9%
- By 2100
- 384,218 · -15.4%
Race, ethnicity, and origin ACS 2023
- Neighborhood character
- Predominantly White (89%)
- Race & ethnicity
- White 89% Black 4% Two or more races 4% Asian 2% Hispanic / Latino 2%
- Common ancestry
- Romanian 3% Slovak 3% Serbian 2%
- Foreign-born
- 4% · China
- Languages at home
- 95% English-only · Russian/Polish/Slavic 1% Chinese 1% Other Indo-European 1%
Political lean MEDSL · York
- 2024 margin
- Strong R (+25.3) · D 36.9% · R 62.1%
- 2008→2024 swing
- -11.7pp toward R · 2008: -13.6pp · 2024: -25.3pp
- All cycles
- 2024: R+25.3 2020: R+24.6 2016: R+29.3 2012: R+21.2 2008: R+13.6
Not yet ingested
- Civics
- —
Market trends
- HPI YoY
- ▼ -69.16%
- Current HPI
- 259.7294
- Rent YoY
- —
- Metro
- York-Hanover, PA
- State GDP YoY
- ▲ 1.68%
- F500 in state
- 34
Industry mix (Fortune 500 HQ in PA)
| Industry | F500 HQs | Revenue |
|---|---|---|
| Healthcare | 2 | $309B |
|
||
| Insurance | 2 | $27B |
|
||
| Telecommunications / Media | 1 | $124B |
|
||
| Industrial Distribution | 1 | $22B |
|
||
| Financial Services | 1 | $20B |
|
||
| Chemicals / Materials | 1 | $18B |
|
||
Price history
+405.9% since first listed8 events — show timeline
- 2026-05-23 Listed $215,000 BRIGHT MLS
- 2026-05-16 Coming Soon $215,000 BRIGHT MLS
- 2021-02-22 Sold (Public Records) $138,500 Public Records
- 2016-05-02 Sold (Public Records) $119,000 Public Records
- 2016-04-29 Sold (MLS) $119,000 BRIGHT MLS
- 2016-03-19 Listing Removed — BRIGHT MLS
- 2016-03-09 Listed $119,000 BRIGHT MLS
- 1987-08-21 Sold (Public Records) $42,500 Public Records
Property tax history
+0.9%/yrLatest (2025): $2,733 · +3.0% YoY. Source: county tax records.
Cash-flow waterfall
monthlySold comps — $/sqft
last 12 mo · ≤1 miLoading sold comps…