 Duplex
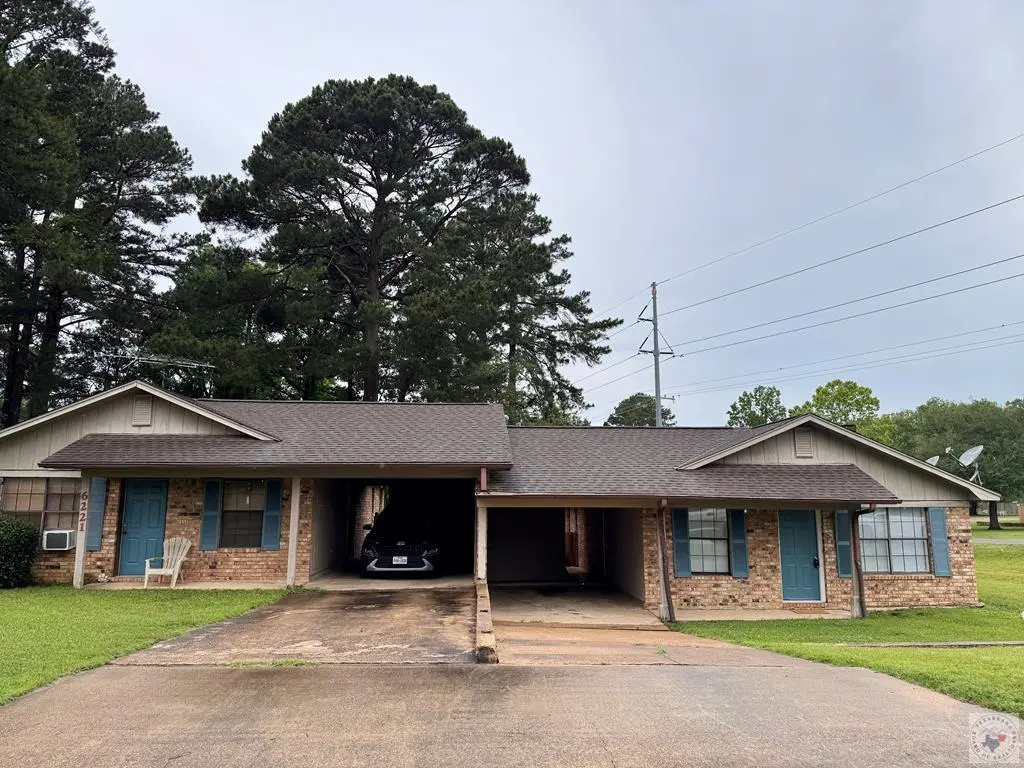
6221-6223 Sandlin Ave · Texarkana, TX
Flood risk 1/10 · Minimal
- FEMA flood zone
- X (unshaded)
- Chance of flooding over 30 yrs
- 0.0%
- Est. flood insurance / yr
- $507 – $1,088
Fire risk 4/10 · Minor
- Est. fire insurance / yr
- $1,222 – $2,270
Heat risk 7/10 · Major
- Hot days now (above 111°F)
- 7 days/yr
- Hot days in 30 yrs
- 22 days/yr
Wind risk 4/10 · Minor
- Chance of severe wind over 30 yrs
- 24.0%
Air-quality risk 2/10 · Minimal
- Unhealthy air days now
- 0 days/yr
- Unhealthy air days in 30 yrs
- 1 days/yr
Risk factors via First Street. Map © Google.
Why this score? — see what drove the C- grade
The composite is a weighted blend of 9 inputs, each scored 0–100. Each bar is that input's sub-score; the figure is the points it added to the 100-point composite (weight × sub-score).
- Cash flow +19.8/30.0
- ARV discount +7.5/15.0
- DSCR +6.3/10.0
- Schools +5.6/10.0
- 1% rule +5.3/10.0
- Livability +3.9/5.0
- Rent growth +2.5/5.0
- Condition / age +2.5/5.0
- Appreciation +0.0/10.0
$235,000
🖨 Deal sheet (PDF) 📄 Offer letter ✓ Due diligence
Multi-family units
County records classify this as Multi-Family (2-4 Unit). Listing-text estimate: 2 units. confirmed
Listing remarks
Investment opportunity in a desirable and convenient location! This duplex features two units, each offering 2 bedrooms, 2 bathrooms, and a laundry area. Unit 6223 has been updated with new floor covering, fresh paint, new kitchen countertops, and appliances, making it move-in ready. Unit 6221 is currently tenant-occupied. Located in a high-demand rental area with easy access to schools, shopping, restaurants, and medical facilities
Key facts
- Fresh paint
- New appliances
- 0.43 acre lot
Tags
Property features AI
Finance
- Other: Lot approximately 0.43 acres
- HOA & community: No community features listed
Exterior
- Parking: Carport
- Utilities: Public water; Public sewer
- Home design: Duplex (residential income); One level; Brick construction
- Construction: Composition roof; Slab foundation; Built of brick
- Exterior features: Concrete road frontage on a city street
Interior
- Kitchen: Dishwasher; Disposal; Electric cooktop; Electric oven; Vented exhaust fan
- Flooring: Carpet; Tile
- Heating & cooling: Natural gas heating; Central air conditioning
- Interior features: Ceiling fan(s); Fireplace (1)
- Laundry & utility: Washer hookup inside; Electric dryer hookup
Neighborhood map
What this means for you Summary
Snapshot
- This is a 2 × 2-bed/2.0-bath units multifamily listed at $235k.
Deal economics
- At list price, monthly cash flow is $280 ($3k/yr) — positive. Per door: $140/mo.
- The deal already cash-flows at list — no discount required.
- Meets the 1% rule at list price ($2k rent vs $235k).
- Cap rate 7.7% vs local median 4.3% in Texarkana — top-decile yield for the area; either an underpriced asset or a hidden risk that comps aren't pricing in. Stress-test before assuming the spread holds.
Location & tenants
- Location reads 77/100 on livability (#93 in TX, #3,241 nationally) — a middle-class / working-renter tenant base. Strengths: cost of living A+, housing A+, health & safety A+; Watch: amenities D+, crime D, employment D.
- Pleasant Grove ISD (urban): math 63% / reading 65% proficiency, ranked #30 of 826 in TX (top 4%) — acceptable for families but not a draw, mixed tenant base, ~2y average lease.
- Zoned schools: Margaret Fischer Davis El (530 students, 45% FRL); Pleasant Grove Middle (math 56% / reading 60%, grade B, #197 of 1,662 statewide, top 12%, 501 students, 41% FRL); Pleasant Grove H S (math 57% / reading 72%, grade B-, #199 of 1,632 statewide, top 14%, 796 students, 28% FRL).
- Market conditions: 300 active listings in the ZIP; 11 comparable units currently listed for rent nearby; rentals lingering (median 45d on market — plan ~5-8 weeks vacancy on turnover, expect pricing pressure); 100% of comp listings sitting > 30 days — soft ceiling on asking rent; 137 units permitted in Bowie County in 2024 (5 in 5+ unit buildings).
- This rent runs 40% of the median local income ($72k/yr) — at the standard rent-burdened threshold; future hikes will face affordability resistance.
Forward outlook
- Local home prices are declining (-3.0%/yr); year-one equity from $2k of loan paydown is wiped out by about $7k of value loss. Plan a longer hold.
Negotiation context
- Only 12 days on market — expect competitive offers; lowballing is unlikely to land.
- 2 sale attempts since 3y ago with the ask held roughly flat each time — persistent listings suggest the price (not the market) is what's stuck; bring a comps-based counter.
Risks & watch-outs
- Climate carrying-cost: extreme-heat days projected 7→22/yr by 2055 (HVAC capex compounding) — expect insurance premiums to compound above CPI over the hold.
Questions for the listing agent
- Can we see the unit-by-unit rent roll, current vacancy, and any below-market leases? What's the average tenancy length?
- What capital expenditures (roof, boiler, parking lot, exteriors) have been made in the last 5 years, and what's planned in the next 2?
- Is there a deadline driving the sale (1031 exchange, divorce, estate, relocation)? That informs how much negotiation room exists.
- Schools are D-rated, which usually means shorter tenancies and higher turnover. Who's the typical renter profile here, and what's been the actual vacancy rate?
- Crime grade is D in this area — have there been break-ins, vandalism, or insurance claims at this property in the last 3 years? What carrier currently insures it and at what premium?
- What's the average days-on-market for RENTAL listings here right now (not sales)? A rising rental-DOM trend means longer vacancies and softer asking-rent achievability than the comps imply.
- What's the recent tenant-quality profile in this submarket — average credit score on applications, eviction rate, late-payment / NSF rate, and stable-employment percentage? A property-management company in the area should have these aggregated.
- How much new apartment / multifamily construction is in the pipeline within 1–3 miles? Heavy new supply (>2% of stock underway) typically softens rents 12–24 months out; light construction supports rent growth.
Investment metrics
- 1% rule
- 1.03% ✓
- Cap rate
- 7.72%
- Cash-on-cash
- 5.11%
- DSCR
- 1.23
- GRM
- 8.1
CMA / ARV
No comps found within radius.
Projected returns pro-forma
-3.0% appreciation · 3.0% rent growth · sell at horizon
- IRR
- -8.3%
- Equity multiple
- 0.69×
- Total profit
- $-20,181
- Equity at exit
- $35,039
- IRR
- 1.2%
- Equity multiple
- 1.08×
- Total profit
- $5,584
- Equity at exit
- $20,319
Cash invested: $65,800 (down + closing). Projections, not guarantees.
Landlord ↔ Tenant lean methodology
- Overall (STATE)
- 87 Strongly Landlord-Friendly
- State Texas
- 87 Strongly Landlord-Friendly · R+5
- County
- — inherits STATE
- City
- — inherits STATE
ZIP-level market 75503
- Home prices YoY
- -21.0%
- Active inventory
- 300
- Price-to-rent
- 16.2×
Monthly cashflow live
- Estimated rent
- $2,417 medium interval (Pro) →
- Mortgage (P&I)
- −$1,232
- Tax from tax record
- −$299 /mo · $3,585/yr
- Insurance
- −$98
- HOA
- −$0
- Vacancy / Maint / Mgmt
- −$508
- Net cashflow
- $280
Break-even live
Sensitivity live
| Price | -10% $413 | -5% $347 | +0% $280 | +5% $214 | +10% $147 |
|---|---|---|---|---|---|
| Rent | -10% $89 | -5% $185 | +0% $280 | +5% $376 | +10% $471 |
| Rate | -1.0pp $399 | -0.5pp $340 | base $280 | +0.5pp $220 | +1.0pp $158 |
2-unit breakdown (identical units grouped — click to expand)
| Units | Beds | Baths | Est. rent |
|---|---|---|---|
| 2× units | 2 | 2 | $2,418 |
| #1 | 2 | 2 | $1,209 |
| #2 | 2 | 2 | $1,209 |
| Total (2 units) | $2,417 | ||
UW: 25.0% down · 7.5% · 30yr · 1.5% tax · 5.0% vac · 8.0% maint · 8.0% mgmt
Financing live
Cash to close
- Down payment
- $58,750
- Closing costs
- $7,050
- Reserves months
- —
- Total cash needed
- —
Loan-product check · same deal, 3 products live
Conventional
25% down · 7.5% · 30yr
- Down + closing
- —
- Monthly P&I
- —
- Monthly cashflow
- —
- DSCR
- —
- Eligible?
- —
Personal DTI + credit; lowest rate.
DSCR
20% down · 8.5% · 30yr
- Down + closing
- —
- Monthly P&I
- —
- Monthly cashflow
- —
- DSCR
- —
- Eligible?
- —
No personal income docs; deal must DSCR.
Hard money
10% down · 12.0% · 12mo
- Down + closing
- —
- Monthly P&I
- —
- Monthly cashflow
- —
- DSCR
- —
- Eligible?
- —
Short-term bridge; refi at stabilization.
Rent comps 11 comps
| Address | Beds | Baths | Sqft | Rent | $/sqft | DOM | Units | Dist |
|---|---|---|---|---|---|---|---|---|
| 3008 Brittney Ln Texarkana, TX | 3.0 | 2.0 | 1566 | $1,895 | $1.21 | 45d | 1 | 0.27mi |
| 3514 Skyline Blvd Texarkana, TX | 3.0 | 2.0 | 1635 | $4,000 | $2.45 | 45d | 1 | 0.42mi |
| 3516 Skyline Blvd Texarkana, TX | 3.0 | 2.0 | 1635 | $4,000 | $2.45 | 45d | 1 | 0.42mi |
| 7 Fernwood Dr Unit A Texarkana, TX | 4.0 | 2.0 | 2087 | $3,249 | $1.56 | 45d | 1 | 0.91mi |
| 6 Fernwood Dr Unit B Texarkana, TX | 3.0 | 2.5 | 1691 | $1,695 | $1.00 | 45d | 1 | 0.93mi |
| 3 Sidney Dr Texarkana, TX | 3.0 | 2.0 | 1951 | $1,950 | $1.00 | 45d | 1 | 0.95mi |
| 2 Fernwood Dr Unit A Texarkana, TX | 4.0 | 3.5 | 2041 | $2,200 | $1.08 | 45d | 1 | 0.97mi |
| 3808 Moores Ln Texarkana, TX | 4.0 | 2.0 | 2617 | $2,400 | $0.92 | 45d | 1 | 0.98mi |
| 3320 Robin Ln Unit 12 Texarkana, TX | 3.0 | 2.5 | 2704 | $1,599 | $0.59 | 45d | 1 | 1.22mi |
| 2011 Mall Dr Texarkana, TX | 5.0 | 1.0 | 2656 | $2,700 | $1.02 | 45d | 1 | 1.42mi |
| 3515 Arista Blvd Texarkana, TX | 1.0–3.0 | 1.0–2.0 | 1130 | $1,600 | $1.42 | 45d | 27 | 1.47mi |
Listing history 13 events
-
2026-06-13status $235,000 Pending 12 DOM
-
2026-06-10days on market $235,000 Active 12 DOM
-
2026-06-09days on market $235,000 Active 11 DOM
-
2026-06-08days on market $235,000 Active 10 DOM
-
2026-06-07days on market $235,000 Active 9 DOM
-
2026-06-05days on market $235,000 Active 6 DOM
-
2026-06-03days on market $235,000 Active 5 DOM
-
2026-06-02days on market $235,000 Active 4 DOM
-
2026-06-01days on market $235,000 Active 3 DOM
-
2026-05-31days on market $235,000 Active 2 DOM
-
2026-05-29$235,000 Active
-
2023-12-01historical $1,095
-
2023-11-03$1,095
ⓘ Source: listings_history table (triggers on properties + properties_extension) + one-shot
backfill from property_details.listing_events for pre-trigger history.
Tax reassessment forecast TX · Resets to sale price
- Current annual tax
- $3,585 · $299/mo
- Projected year-2 tax
- $4,300 · $358/mo
- Expected delta
- +$716/yr (+$60/mo · 20.0%)
ⓘ Screening estimate from a state-policy table — verify with the county assessor before closing.
Climate risk First Street
- Flood 1/10 Low FEMA zone X (unshaded) · 0% chance over 30 yrs
- Wildfire 4/10 Moderate
- Heat 7/10 Severe 7 d/yr ≥111°F today · 22 d/yr by 30 yrs out
- Wind 4/10 Moderate 24% chance of damaging wind over 30 yrs
- Air quality 2/10 Low 0 unhealthy d/yr today · 1 by 30 yrs out
Nearby sold comps map
Loading sold comps map…
Walkable amenities ~0.75 mi
Loading nearby amenities…
Taxation est. · year 1
- Rental income
- $29,004
- − Mortgage interest
- −$13,164
- − Property taxes
- −$3,585
- − Insurance
- −$1,175
- − Repairs & maintenance
- −$2,320
- − Management
- −$2,320
- − Depreciation
- −$6,836
- Taxable loss
- −$397
- Est. tax savings @ 24.0%
- +$95
- After-tax cash flow
- $3,460/yr
For passive investors: Depreciation is non-cash, so a rental often shows a tax loss while cash-flowing — sheltering income. Rental losses are passive: they offset passive income freely, and up to $25,000/yr can offset ordinary (W-2) income if you actively participate and your MAGI is under $100k (phasing out to $0 by $150k); unused losses carry forward. On sale, claimed depreciation is recaptured at up to 25%, and gains may owe capital-gains tax (a 1031 exchange can defer both). Figures are a year-1 estimate at your 24.0% rate — not tax advice; consult a CPA.
Schools (NCES district)
- District
- Pleasant Grove ISD
- NCES district ID
- 4835130
- Math proficiency
- 63% ▲ 3.00%
- Reading proficiency
- 65% ▲ 6.00%
- Median HH income
- $69,316
- Composite
- 56.24/100
- National rank
- #1175
- State rank
- #30 of 826 in TX
Livability — Texarkana
- Score
- 77/100
- State rank
- #93
- US rank
- #3241
Category grades
Schools grade is shown separately in the Schools card above.
Census & demographics
- Census place
- Texarkana, TX
- County
- Bowie County · 61,238 people
- City population
- 61,238
- Metro
- Texarkana, TX-AR
- Population (ZIP)
- 26,372
- Household income
- $72,159
- Rent vs Own
- Severe rent burden
- 773.0
Population outlook (Bowie County) Hauer SSP2
- Today (2025)
- 94,699 people
- By 2030
- 94,824 · +0.1%
- By 2040
- 94,870 · +0.2%
- By 2050
- 93,686 · -1.1%
- By 2075
- 90,082 · -4.9%
- By 2100
- 76,579 · -19.1%
Race, ethnicity, and origin ACS 2023
- Neighborhood character
- Majority White (63%)
- Race & ethnicity
- White 63% Black 23% Hispanic / Latino 7% Two or more races 5% Asian 3%
- Hispanic origin (detail)
- Mexican 6%
- Common ancestry
- Slovak 2% Serbian 1% Lithuanian 1%
- Foreign-born
- 5% · Canada, Vietnam, South Korea
- Languages at home
- 92% English-only · Spanish 6% Other Indo-European 1%
Political lean MEDSL · Bowie
- 2024 margin
- Solid R (+48.7) · D 25.3% · R 74.0%
- 2008→2024 swing
- -10.8pp toward R · 2008: -37.9pp · 2024: -48.7pp
- All cycles
- 2024: R+48.7 2020: R+42.8 2016: R+46.6 2012: R+41.5 2008: R+37.9
Not yet ingested
- Civics
- —
Market trends
- HPI YoY
- ▼ -48.09%
- Current HPI
- 181.3052
- Rent YoY
- —
- Metro
- Texarkana, TX-AR
- State GDP YoY
- ▲ 3.95%
- F500 in state
- 110
Industry mix (Fortune 500 HQ in TX)
| Industry | F500 HQs | Revenue |
|---|---|---|
| Energy | 16 | $1,198B |
|
||
| Technology | 5 | $198B |
|
||
| Engineering / Construction | 4 | $72B |
|
||
| Energy Services | 3 | $60B |
|
||
| Utilities | 3 | $41B |
|
||
| Healthcare | 2 | $330B |
|
||
Price history
+21361.2% since first listed3 events — show timeline
- 2026-05-29 Listed $235,000 TBOR
- 2023-12-01 Rental Removed $1,095 APPFOLIO
- 2023-11-03 Listed for Rent $1,095 APPFOLIO
Property tax history
+4.9%/yrLatest (2025): $3,585 · +3.5% YoY. Source: county tax records.
Cash-flow waterfall
monthlySold comps — $/sqft
last 12 mo · ≤1 miLoading sold comps…