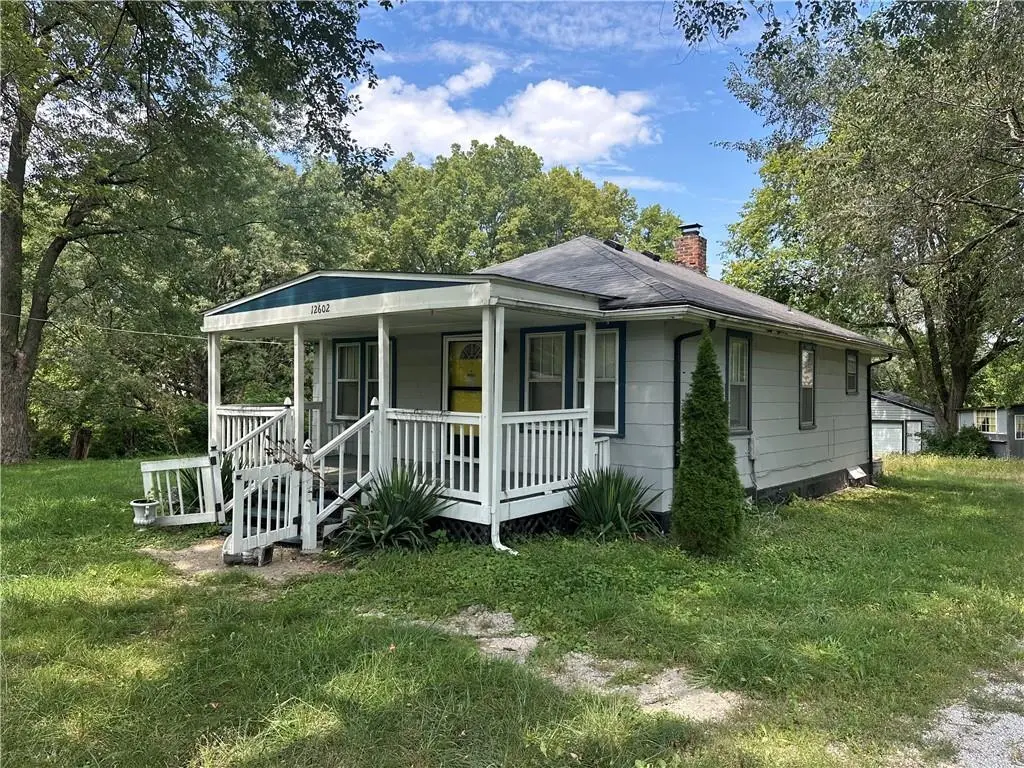
12602 E 37th St N · Sugar Creek, MO
Flood risk 1/10 · Minimal
- FEMA flood zone
- X (unshaded)
- Chance of flooding over 30 yrs
- 0.0%
- Est. flood insurance / yr
- $473 – $860
Fire risk 2/10 · Minimal
- Est. fire insurance / yr
- $1,054 – $1,958
Heat risk 4/10 · Minor
- Hot days now (above 106°F)
- 6 days/yr
- Hot days in 30 yrs
- 14 days/yr
Wind risk 2/10 · Minimal
- Chance of severe wind over 30 yrs
- —
Air-quality risk 3/10 · Minor
- Unhealthy air days now
- 3 days/yr
- Unhealthy air days in 30 yrs
- 3 days/yr
Risk factors via First Street. Map © Google.
Why this score? — see what drove the B- grade
The composite is a weighted blend of 9 inputs, each scored 0–100. Each bar is that input's sub-score; the figure is the points it added to the 100-point composite (weight × sub-score).
- Cash flow +25.4/30.0
- ARV discount +15.0/15.0
- DSCR +8.4/10.0
- 1% rule +6.5/10.0
- Rent growth +3.4/5.0
- Livability +3.2/5.0
- Schools +2.7/10.0
- Condition / age +2.5/5.0
- Appreciation +0.0/10.0
$115,000
🖨 Deal sheet 📄 Offer letter ✓ Due diligence
Listing remarks
Perfect opportunity to enjoy a little country feel while still being close to the city. Situated on approximately 1.5 acres, this charming bungalow offers an incredible value at $115,000. The home features a full basement with potential for additional finished living space, plus a detached two-car garage for extra storage, hobbies, or parking. Plenty of room to spread out, garden, entertain, or create your own private retreat. Whether you’re looking for your first home, investment opportunity, or a property with room to grow, this one offers endless possibilities at an affordable price. Seller Pays: Buyer uses Premium Title Services, the seller’s preferred title partner and clos
Key facts
- Full basement
- 1.53 acre lot
- 2 garage spots
Tags
Property features AI
Finance
- Other: Lot size about 1.53 acres (dimensions 124 x 540)
Exterior
- Parking: Detached 2-car garage
- Utilities: Public water; Sewer: unknown
- Home design: Single-family residence; Residential property; One story (bungalow); Approximate living area 784
- Construction: Metal siding; Other siding materials; Composition roof; Home age approximately 76–100 years; Has basement
- Exterior features: Metal fencing; Acreage lot
Interior
- Kitchen: Kitchen (eat-in)
- Bedrooms: 1 bedroom
- Bathrooms: 1 full bathroom
- Heating & cooling: Natural gas heat; Electric cooling
- Interior features: Bungalow floor plan; Eat-in kitchen; Walk-up basement access; Stone/rock basement walls
Neighborhood map
What this means for you Summary
Snapshot
- This is a 2-bed/1.0-bath single-family listed at $115k.
Deal economics
- At list price, monthly cash flow is $265 ($3k/yr) — positive.
- The deal already cash-flows at list — no discount required.
- Meets the 1% rule at list price ($1k rent vs $115k).
- Recommended offer: $112k (3.0% below list) — sets the bar for market timing.
- Cap rate 9.1% vs local median 5.2% in Sugar Creek — top-decile yield for the area; either an underpriced asset or a hidden risk that comps aren't pricing in. Stress-test before assuming the spread holds.
Location & tenants
- Location reads 65/100 on livability (#261 in MO) — a middle-class / working-renter tenant base. Strengths: cost of living A+, housing A-, commute B; Watch: crime F, amenities F, employment F.
- Independence 30 (suburban): math 26% / reading 38% proficiency, ranked #252 of 324 in MO (top 78%) — families likely to look elsewhere, expect single-tenant / working-renter base with shorter leases.
- Zoned schools: Mill Creek Elem. (math 37% / reading 52%, grade F, #413 of 1,115 statewide, top 42%, 290 students, 70% FRL); William Chrisman High (math 21% / reading 45%, grade F, #351 of 521 statewide, top 68%, 1,406 students, 66% FRL).
- Market conditions: Rents rising (+3.8%/yr); 125 active listings in the ZIP; 6 comparable units currently listed for rent nearby; rentals lingering (median 44d on market — plan ~5-8 weeks vacancy on turnover, expect pricing pressure); 50% of comp listings sitting > 30 days — soft ceiling on asking rent; 4,002 units permitted in Jackson County in 2024 (2,271 in 5+ unit buildings).
- This rent runs 33% of the median local income ($49k/yr) — at the standard rent-burdened threshold; future hikes will face affordability resistance.
Forward outlook
- Local home prices are declining (-3.0%/yr); year-one equity from $795 of loan paydown is wiped out by about $3k of value loss. Plan a longer hold.
- Jackson County population projected at +4% by 2050 — modest demand growth; plan on rents tracking national, not racing it.
- At projected returns (-3.0% appreciation + 3.8% rent growth), your $32k cash investment doubles in ~10 years — after that, you're playing with house money.
Negotiation context
- It's been on market 35 days — a 3% lower offer ($112k) is reasonable based on typical stale-listing flexibility.
Risks & watch-outs
- Watch-outs: built in 1920 — expect roof / HVAC / electrical / plumbing capex.
Questions for the listing agent
- It's been on market 35 days. Have you received any prior offers? Is the seller open to a 3% concession, seller financing, or rate buy-down credit?
- Built in 1920 — when were the roof, HVAC, electrical panel, plumbing, and water heater last replaced?
- Is there a deadline driving the sale (1031 exchange, divorce, estate, relocation)? That informs how much negotiation room exists.
- Schools are F-rated, which usually means shorter tenancies and higher turnover. Who's the typical renter profile here, and what's been the actual vacancy rate?
- Crime grade is F in this area — have there been break-ins, vandalism, or insurance claims at this property in the last 3 years? What carrier currently insures it and at what premium?
- What's the average days-on-market for RENTAL listings here right now (not sales)? A rising rental-DOM trend means longer vacancies and softer asking-rent achievability than the comps imply.
- What's the recent tenant-quality profile in this submarket — average credit score on applications, eviction rate, late-payment / NSF rate, and stable-employment percentage? A property-management company in the area should have these aggregated.
- How much new for-sale + rental construction is in the pipeline within 1–3 miles? Heavy new supply typically softens prices + rents 12–24 months out; constrained supply supports both.
Investment metrics
- 1% rule
- 1.15% ✓
- Cap rate
- 9.06%
- Cash-on-cash
- 9.87%
- DSCR
- 1.44
- GRM
- 7.2
CMA / ARV
- ARV (median comp)
- $188,094
- List price
- $115,000
- Delta
- -38.86%
- Verdict
- UNDERPRICED
- Comps
- 3 within 1.0 mi
Projected returns pro-forma
-3.0% appreciation · 3.79% rent growth · sell at horizon
- IRR
- -0.6%
- Equity multiple
- 0.98×
- Total profit
- $-694
- Equity at exit
- $17,147
- IRR
- 9.9%
- Equity multiple
- 1.79×
- Total profit
- $25,584
- Equity at exit
- $9,943
Cash invested: $32,200 (down + closing). Projections, not guarantees.
Landlord ↔ Tenant lean methodology
- Overall (STATE)
- 81 Strongly Landlord-Friendly
- State Missouri
- 81 Strongly Landlord-Friendly · R+10
- County
- — inherits STATE
- City
- — inherits STATE
ZIP-level market 64050
- Home prices YoY
- -15.5%
- Rents YoY
- 3.8%
- Active inventory
- 125
- Price-to-rent
- 7.2×
Monthly cashflow live
- Estimated rent
- $1,323 high interval (Pro) →
- Mortgage (P&I)
- −$603
- Tax from tax record
- −$129 /mo · $1,552/yr
- Insurance
- −$48
- HOA
- −$0
- Vacancy / Maint / Mgmt
- −$278
- Net cashflow
- $265
Break-even live
UW: 25.0% down · 7.5% · 30yr · 1.5% tax · 5.0% vac · 8.0% maint · 8.0% mgmt
Financing live
Cash to close
- Down payment
- $28,750
- Closing costs
- $3,450
- Reserves months
- —
- Total cash needed
- —
Loan-product check · same deal, 3 products live
Conventional
25% down · 7.5% · 30yr
- Down + closing
- —
- Monthly P&I
- —
- Monthly cashflow
- —
- DSCR
- —
- Eligible?
- —
Personal DTI + credit; lowest rate.
DSCR
20% down · 8.5% · 30yr
- Down + closing
- —
- Monthly P&I
- —
- Monthly cashflow
- —
- DSCR
- —
- Eligible?
- —
No personal income docs; deal must DSCR.
Hard money
10% down · 12.0% · 12mo
- Down + closing
- —
- Monthly P&I
- —
- Monthly cashflow
- —
- DSCR
- —
- Eligible?
- —
Short-term bridge; refi at stabilization.
Rent comps 6 comps
| Address | Beds | Baths | Sqft | Rent | $/sqft | DOM | Units | Dist |
|---|---|---|---|---|---|---|---|---|
| 702 W 39th St N Independence, MO | 3.0 | 1.5 | 913 | $1,450 | $1.59 | 43d | 1 | 0.24mi |
| 3407 N Pleasant St Independence, MO | 3.0 | 1.5 | 905 | $1,400 | $1.55 | 3d | 1 | 0.30mi |
| 2522 N River Blvd Independence, MO | 3.0 | 1.0 | 910 | $1,495 | $1.64 | 4d | 1 | 0.69mi |
| 2405 N River Blvd Independence, MO | 2.0 | 1.0 | 830 | $1,095 | $1.32 | 7d | 1 | 0.79mi |
| 1714 N Pearl St Independence, MO | 2.0 | 1.0 | 792 | $1,195 | $1.51 | 43d | 1 | 1.42mi |
| 1612 N Dodgion Ave Independence, MO | 3.0 | 1.0 | 1000 | $1,345 | $1.34 | 43d | 1 | 1.47mi |
Listing history 15 events
-
2026-06-18days on market $115,000 Active 35 DOM
-
2026-06-17days on market $115,000 Active 34 DOM
-
2026-06-16days on market $115,000 Active 33 DOM
-
2026-06-15days on market $115,000 Active 32 DOM
-
2026-06-13days on market $115,000 Active 30 DOM
-
2026-06-09days on market $115,000 Active 26 DOM
-
2026-06-08days on market $115,000 Active 25 DOM
-
2026-06-07days on market $115,000 Active 24 DOM
-
2026-06-05days on market $115,000 Active 21 DOM
-
2026-06-03days on market $115,000 Active 20 DOM
-
2026-06-02days on market $115,000 Active 19 DOM
-
2026-06-01days on market $115,000 Active 18 DOM
-
2026-05-31days on market $115,000 Active 17 DOM
-
2026-05-14$115,000 Active 1079-char remark
-
2025-08-19soldstatus
ⓘ Source: listings_history table (triggers on properties + properties_extension) + one-shot
backfill from property_details.listing_events for pre-trigger history.
Tax reassessment forecast MO · Resets to sale price
- Current annual tax
- $1,552 · $129/mo
- Projected year-2 tax
- $1,552 · $129/mo
- Expected delta
- $0/yr ($0/mo · 0.0%)
ⓘ Screening estimate from a state-policy table — verify with the county assessor before closing.
Climate risk First Street
- Flood 1/10 Low FEMA zone X (unshaded) · 0% chance over 30 yrs
- Wildfire 2/10 Low
- Heat 4/10 Moderate 6 d/yr ≥106°F today · 14 d/yr by 30 yrs out
- Wind 2/10 Low
- Air quality 3/10 Moderate 3 unhealthy d/yr today · 3 by 30 yrs out
Nearby sold comps map
Loading sold comps map…
Walkable amenities ~0.75 mi
Loading nearby amenities…
Taxation est. · year 1
- Rental income
- $15,877
- − Mortgage interest
- −$6,442
- − Property taxes
- −$1,552
- − Insurance
- −$575
- − Repairs & maintenance
- −$1,270
- − Management
- −$1,270
- − Depreciation
- −$3,345
- Taxable income
- $1,422
- Est. tax owed @ 24.0%
- −$341
- After-tax cash flow
- $2,837/yr
For passive investors: Depreciation is non-cash, so a rental often shows a tax loss while cash-flowing — sheltering income. Rental losses are passive: they offset passive income freely, and up to $25,000/yr can offset ordinary (W-2) income if you actively participate and your MAGI is under $100k (phasing out to $0 by $150k); unused losses carry forward. On sale, claimed depreciation is recaptured at up to 25%, and gains may owe capital-gains tax (a 1031 exchange can defer both). Figures are a year-1 estimate at your 24.0% rate — not tax advice; consult a CPA.
Schools (NCES district)
- District
- Independence 30
- NCES district ID
- 2915480
- Math proficiency
- 26% ▼ -8.00%
- Reading proficiency
- 38% ▼ -5.00%
- Median HH income
- $41,843
- Composite
- 27.04/100
- National rank
- #7054
- State rank
- #252 of 324 in MO
Livability — Sugar Creek
- Score
- 65/100
- State rank
- #261
- US rank
- #12484
Category grades
Schools grade is shown separately in the Schools card above.
Census & demographics
- Census place
- Sugar Creek, MO
- County
- Jackson County · 687,798 people
- City population
- 3,547
- Metro
- Kansas City, MO-KS
- Population (ZIP)
- 21,079
- Household income
- $48,834
- Rent vs Own
- Severe rent burden
- 972.0
Population outlook (Jackson County) Hauer SSP2
- Today (2025)
- 719,589 people
- By 2030
- 731,456 · +1.6%
- By 2040
- 746,689 · +3.8%
- By 2050
- 749,289 · +4.1%
- By 2075
- 736,227 · +2.3%
- By 2100
- 668,210 · -7.1%
Race, ethnicity, and origin ACS 2023
- Neighborhood character
- Predominantly White (72%)
- Race & ethnicity
- White 72% Hispanic / Latino 11% Two or more races 9% Black 7% Pacific Islander 1%
- Hispanic origin (detail)
- Mexican 8%
- Common ancestry
- Italian 4% Serbian 2% Lithuanian 1%
- Foreign-born
- 5% · Canada
- Languages at home
- 91% English-only · Spanish 7% Other Asian/Pacific 1%
Political lean MEDSL · Jackson
- 2024 margin
- D (+19.3) · D 58.9% · R 39.5% · Other 1.6%
- 2008→2024 swing
- -6.1pp toward R · 2008: 25.4pp · 2024: 19.3pp
- All cycles
- 2024: D+19.3 2020: D+22.0 2016: D+16.6 2012: D+19.0 2008: D+25.4
Not yet ingested
- Civics
- —
Market trends
- HPI YoY
- ▼ -56.24%
- Current HPI
- 305.796
- Rent YoY
- ▲ 3.79%
- Metro
- Kansas City, MO-KS
- State GDP YoY
- ▲ 1.84%
- F500 in state
- 20
Industry mix (Fortune 500 HQ in MO)
| Industry | F500 HQs | Revenue |
|---|---|---|
| Healthcare | 1 | $163B |
|
||
| Insurance | 1 | $21B |
|
||
| Industrial Technology | 1 | $17B |
|
||
| Retail | 1 | $16B |
|
||
| Industrial Distribution | 1 | $10B |
|
||
| Utilities | 1 | $9B |
|
||
Price history
2 events — show timeline
- 2026-05-14 Listed $115,000 Heartland MLS as Distributed by MLS Grid
- 2025-08-19 Sold (Public Records) — Public Records
Property tax history
+4.0%/yrLatest (2025): $1,552 · -28.9% YoY. Source: county tax records.
Cash-flow waterfall
monthlySold comps — $/sqft
last 12 mo · ≤1 miLoading sold comps…