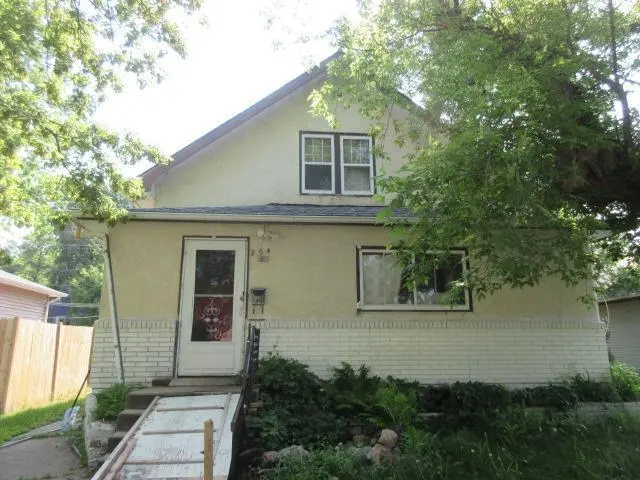
804 2nd Ave NE · Jamestown, ND
Flood risk No data
- FEMA flood zone
- —
- Chance of flooding over 30 yrs
- —
- Est. flood insurance / yr
- —
Fire risk No data
- Est. fire insurance / yr
- —
Heat risk No data
- Hot days now (above threshold)
- —
- Hot days in 30 yrs
- —
Wind risk No data
- Chance of severe wind over 30 yrs
- —
Air-quality risk No data
- Unhealthy air days now
- —
- Unhealthy air days in 30 yrs
- —
Risk factors via First Street. Map © Google.
Why this score? — see what drove the D+ grade
The composite is a weighted blend of 9 inputs, each scored 0–100. Each bar is that input's sub-score; the figure is the points it added to the 100-point composite (weight × sub-score).
- Cash flow +15.0/30.0
- ARV discount +7.5/15.0
- 1% rule +5.0/10.0
- DSCR +5.0/10.0
- Schools +4.1/10.0
- Livability +3.7/5.0
- Rent growth +3.4/5.0
- Condition / age +2.5/5.0
- Appreciation +0.0/10.0
$1
🖨 Deal sheet (PDF) 📄 Offer letter ✓ Due diligence
Listing remarks MLS
1 1/2 story home in valley Jamestown location. If you are looking for a home that needs a little TLC, this is the property for you. Come and take a look!
Key facts
- 6,969 sq ft lot
- Garage
- Built 1945
Property features AI
Exterior
- Parking: 1-car garage
- Utilities: City water connected; City sewer connected; Natural gas
- Home design: Residential property; Main level plus partial upper level
- Construction: Foundation details: see remarks
- Exterior features: Stucco exterior; Lot approximately 0.16 acres (about 7,000 sq ft)
Interior
- Bedrooms: 3 bedrooms
- Bathrooms: 1 full bathroom
- Heating & cooling: Forced air heating; Central air conditioning
- Interior features: Basement with other/unspecified features; One and one-half levels
Neighborhood map
What this means for you Summary
Snapshot
- This is a 3-bed/1.0-bath other listed at $1.
Deal economics
- At list price, monthly cash flow is $897 ($11k/yr) — positive.
- The deal already cash-flows at list — no discount required.
- Meets the 1% rule at list price ($1k rent vs $1).
- Cap rate 1076414.1% vs local median 3.2% in Jamestown — top-decile yield for the area; either an underpriced asset or a hidden risk that comps aren't pricing in. Stress-test before assuming the spread holds.
Location & tenants
- Location reads 73/100 on livability (#35 in ND) — a middle-class / working-renter tenant base. Strengths: cost of living A+, housing A+, crime A; Watch: employment D+, health & safety D+, amenities F.
- Jamestown 1 (town): math 45% / reading 52% proficiency, ranked #14 of 53 in ND (top 26%) — families likely to look elsewhere, expect single-tenant / working-renter base with shorter leases.
- Market conditions: Rents rising (+3.7%/yr); 98 active listings in the ZIP; 19 units permitted in Stutsman County in 2024 (0 in 5+ unit buildings).
Forward outlook
- Local home prices are declining (-3.0%/yr); year-one equity from $0 of loan paydown is wiped out by about $0 of value loss. Plan a longer hold.
- Stutsman County population projected at +4% by 2050 — modest demand growth; plan on rents tracking national, not racing it.
- At projected returns (-3.0% appreciation + 3.7% rent growth), your $0 cash investment doubles in ~1 year — after that, you're playing with house money.
Negotiation context
- Only 10 days on market — expect competitive offers; lowballing is unlikely to land.
- 2 sale attempts since 7y ago with the ask held roughly flat each time — persistent listings suggest the price (not the market) is what's stuck; bring a comps-based counter.
Risks & watch-outs
- Watch-outs: built in 1945 — expect roof / HVAC / electrical / plumbing capex.
Questions for the listing agent
- Built in 1945 — when were the roof, HVAC, electrical panel, plumbing, and water heater last replaced?
- Is there a deadline driving the sale (1031 exchange, divorce, estate, relocation)? That informs how much negotiation room exists.
- Schools are B-rated — typically a magnet for longer-tenancy family renters. What's the average tenant stay here, and is there a school-zone premium baked into asking?
- The area grade is low — what's the realistic commute time and amenity access for the typical tenant pool here? Any planned neighborhood developments (good or bad) we should know about?
- What's the average days-on-market for RENTAL listings here right now (not sales)? A rising rental-DOM trend means longer vacancies and softer asking-rent achievability than the comps imply.
- What's the recent tenant-quality profile in this submarket — average credit score on applications, eviction rate, late-payment / NSF rate, and stable-employment percentage? A property-management company in the area should have these aggregated.
- How much new for-sale + rental construction is in the pipeline within 1–3 miles? Heavy new supply typically softens prices + rents 12–24 months out; constrained supply supports both.
Investment metrics
- 1% rule
- 113546.00% ✓
- Cap rate
- 1076414.08%
- Cash-on-cash
- 3844313.53%
- DSCR
- 171051.32
- GRM
- 0.0
CMA / ARV
No comps found within radius.
Projected returns pro-forma
-3.0% appreciation · 3.68% rent growth · sell at horizon
- IRR
- —
- Equity multiple
- 206893.46×
- Total profit
- $57,930
- Equity at exit
- $0
- IRR
- —
- Equity multiple
- 454761.79×
- Total profit
- $127,333
- Equity at exit
- $0
Cash invested: $0 (down + closing). Projections, not guarantees.
Landlord ↔ Tenant lean methodology
- Overall (STATE)
- 82 Strongly Landlord-Friendly
- State North Dakota
- 82 Strongly Landlord-Friendly · R+20
- County
- — inherits STATE
- City
- — inherits STATE
ZIP-level market 58401
- Rents YoY
- 3.7%
- Active inventory
- 98
Monthly cashflow live
- Estimated rent
- $1,135 medium interval (Pro) →
- Mortgage (P&I)
- −$0
- Tax est. 1.5%
- −$0 /mo · $0/yr
- Insurance
- −$0
- HOA
- −$0
- Vacancy / Maint / Mgmt
- −$238
- Net cashflow
- $897
Break-even live
Sensitivity live
| Price | -10% $897 | -5% $897 | +0% $897 | +5% $897 | +10% $897 |
|---|---|---|---|---|---|
| Rent | -10% $807 | -5% $852 | +0% $897 | +5% $942 | +10% $987 |
| Rate | -1.0pp $897 | -0.5pp $897 | base $897 | +0.5pp $897 | +1.0pp $897 |
UW: 25.0% down · 7.5% · 30yr · 1.5% tax · 5.0% vac · 8.0% maint · 8.0% mgmt
Financing live
Cash to close
- Down payment
- $0
- Closing costs
- $0
- Reserves months
- —
- Total cash needed
- —
Loan-product check · same deal, 3 products live
Conventional
25% down · 7.5% · 30yr
- Down + closing
- —
- Monthly P&I
- —
- Monthly cashflow
- —
- DSCR
- —
- Eligible?
- —
Personal DTI + credit; lowest rate.
DSCR
20% down · 8.5% · 30yr
- Down + closing
- —
- Monthly P&I
- —
- Monthly cashflow
- —
- DSCR
- —
- Eligible?
- —
No personal income docs; deal must DSCR.
Hard money
10% down · 12.0% · 12mo
- Down + closing
- —
- Monthly P&I
- —
- Monthly cashflow
- —
- DSCR
- —
- Eligible?
- —
Short-term bridge; refi at stabilization.
Listing history 8 events
-
2026-06-19days on market $1 Active 10 DOM
-
2026-06-18days on market $1 Active 9 DOM
-
2026-06-17days on market $1 Active 8 DOM
-
2026-06-16days on market $1 Active 7 DOM
-
2026-06-15days on market $1 Active 6 DOM
-
2026-06-14days on market $1 Active 4 DOM
-
2026-06-12days on market $1 Active 3 DOM
-
2026-06-09$1 Active 1 DOM
ⓘ Source: listings_history table (triggers on properties + properties_extension) + one-shot
backfill from property_details.listing_events for pre-trigger history.
Nearby sold comps map
Loading sold comps map…
Walkable amenities ~0.75 mi
Loading nearby amenities…
Taxation est. · year 1
- Rental income
- $13,626
- − Mortgage interest
- −$0
- − Property taxes
- −$0
- − Insurance
- −$0
- − Repairs & maintenance
- −$1,090
- − Management
- −$1,090
- − Depreciation
- −$0
- Taxable income
- $11,445
- Est. tax owed @ 24.0%
- −$2,747
- After-tax cash flow
- $8,017/yr
For passive investors: Depreciation is non-cash, so a rental often shows a tax loss while cash-flowing — sheltering income. Rental losses are passive: they offset passive income freely, and up to $25,000/yr can offset ordinary (W-2) income if you actively participate and your MAGI is under $100k (phasing out to $0 by $150k); unused losses carry forward. On sale, claimed depreciation is recaptured at up to 25%, and gains may owe capital-gains tax (a 1031 exchange can defer both). Figures are a year-1 estimate at your 24.0% rate — not tax advice; consult a CPA.
Schools (NCES district)
- District
- Jamestown 1
- NCES district ID
- 3800021
- Math proficiency
- 45% ▼ -9.00%
- Reading proficiency
- 52% ▼ -5.00%
- Median HH income
- $48,557
- Composite
- 41.38/100
- National rank
- #3487
- State rank
- #14 of 53 in ND
Livability — Jamestown
- Score
- 73/100
- State rank
- #35
- US rank
- #5212
Category grades
Schools grade is shown separately in the Schools card above.
Census & demographics
- Census place
- Jamestown, ND
- County
- Stutsman County · 17,189 people
- City population
- 17,189
- Metro
- Jamestown, ND
- Population (ZIP)
- 17,189
- Household income
- $60,228
- Rent vs Own
- Severe rent burden
- 964.0
Population outlook (Stutsman County) Hauer SSP2
- Today (2025)
- 21,104 people
- By 2030
- 21,292 · +0.9%
- By 2040
- 21,485 · +1.8%
- By 2050
- 21,960 · +4.1%
- By 2075
- 25,753 · +22.0%
- By 2100
- 29,779 · +41.1%
Race, ethnicity, and origin ACS 2023
- Neighborhood character
- Predominantly White (90%)
- Race & ethnicity
- White 90% Two or more races 3% Hispanic / Latino 3% Black 2% Native American 1%
- Common ancestry
- Portuguese 17% Romanian 5% Lithuanian 3%
- Foreign-born
- 3% · Canada
- Languages at home
- 97% English-only · Spanish 1% German/W. Germanic 1%
Political lean MEDSL · Stutsman
- 2024 margin
- Solid R (+44.6) · D 26.7% · R 71.3% · Other 1.9%
- 2008→2024 swing
- -29.9pp toward R · 2008: -14.7pp · 2024: -44.6pp
- All cycles
- 2024: R+44.6 2020: R+43.4 2016: R+42.5 2012: R+22.1 2008: R+14.7
Not yet ingested
- Civics
- —
Market trends
- HPI YoY
- ▼ -171.65%
- Current HPI
- 123.841
- Rent YoY
- ▲ 3.68%
- Metro
- Jamestown, ND
- State GDP YoY
- ▲ 2.09%
- F500 in state
- 2
Industry mix (Fortune 500 HQ in ND)
| Industry | F500 HQs | Revenue |
|---|---|---|
| Utilities / Construction | 1 | $6B |
|
||
Price history
-7.2% since first listed4 events — show timeline
- 2026-06-09 Listed $1 NORTHSTARMLS as Distributed by MLS Grid
- 2020-01-29 Sold (Public Records) $90,000 Public Records
- 2020-01-27 Sold (MLS) — GNMLS
- 2019-09-11 Listed $97,000 GNMLS
Property tax history
+6.8%/yrLatest (2025): $2,496 · +24.5% YoY. Source: county tax records.
Cash-flow waterfall
monthlySold comps — $/sqft
last 12 mo · ≤1 miLoading sold comps…