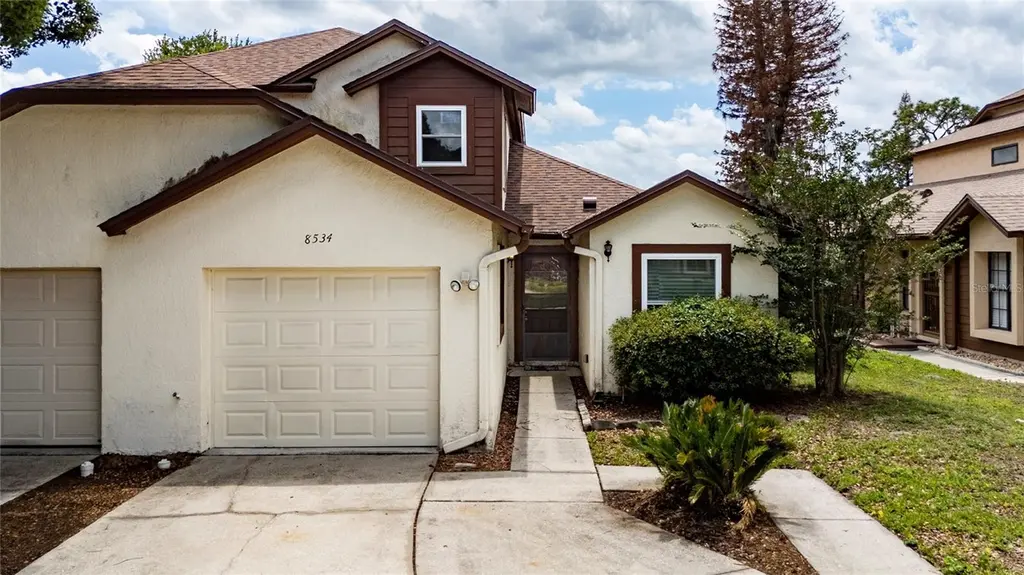
8534 Sparrowhawk Ct · Orlando, FL
Flood risk 1/10 · Minimal
- FEMA flood zone
- X (unshaded)
- Chance of flooding over 30 yrs
- 0.0%
- Est. flood insurance / yr
- $507 – $1,088
Fire risk 4/10 · Minor
- Est. fire insurance / yr
- $947 – $1,759
Heat risk 9/10 · Severe
- Hot days now (above 108°F)
- 7 days/yr
- Hot days in 30 yrs
- 22 days/yr
Wind risk 9/10 · Severe
- Chance of severe wind over 30 yrs
- 99.0%
Air-quality risk 2/10 · Minimal
- Unhealthy air days now
- 1 days/yr
- Unhealthy air days in 30 yrs
- 1 days/yr
Risk factors via First Street. Map © Google.
Why this score? — see what drove the D grade
The composite is a weighted blend of 9 inputs, each scored 0–100. Each bar is that input's sub-score; the figure is the points it added to the 100-point composite (weight × sub-score).
- Cash flow +12.7/30.0
- ARV discount +7.5/15.0
- Livability +4.3/5.0
- Schools +4.1/10.0
- DSCR +3.8/10.0
- Rent growth +3.1/5.0
- 1% rule +2.7/10.0
- Condition / age +2.5/5.0
- Appreciation +0.0/10.0
$319,000
🖨 Deal sheet 📄 Offer letter ✓ Due diligence
Listing remarks
Desirable 3-bedroom, 2.5-bath duplex with a 1-car garage, located in a well-established Orlando neighborhood. This home is an excellent opportunity for first-time homebuyers, investors seeking a rental property, or those looking to downsize. The kitchen features tile flooring, an eat-in breakfast nook, a pantry, refrigerator, brand-new dishwasher, and a new glass-top stove. The primary bedroom is conveniently located on the first floor and includes an en-suite bathroom with newly installed shower tile with several closets. Upstairs, you’ll find two secondary bedrooms and a full bathroom with a tub—perfect for family or guests. The first floor has new carpet throughout, adding a
Key facts
- $16 HOA
- Garage
- Built 1989
Property features AI
Finance
- Other: Pond view; Zoned R-2
- Financial info: No lease restrictions noted; Unfurnished
- HOA & community: Has HOA (Hawks Landing HOA) with semi-annual fee; Monthly HOA approximately $16.54 (semi-annual association fee $99.24); Deed restrictions; Sidewalks in community; Pets allowed
Exterior
- Parking: Driveway; Attached 1-car garage
- Utilities: Public water; Public sewer; Cable available; Electricity available and connected; Water and sewer available and connected
- Home design: Residential half duplex; Attached property; Two stories; Home faces north
- Construction: Block and stucco construction; Shingle roof; Slab foundation; Built on less than 1/4 acre lot
- Exterior features: Covered rear screened porch; Patio/porch screened and covered; Sidewalk; Cul-de-sac lot; Asphalt road
Interior
- Kitchen: Dishwasher; Range; Range hood; Refrigerator
- Bedrooms: 3 bedrooms
- Flooring: Carpet; Tile; Vinyl
- Bathrooms: 2 full baths; 1 half bath
- Heating & cooling: Central heating (electric); Central air conditioning
- Interior features: Ceiling fans; Eat-in kitchen; High ceilings; Living room/dining room combo
- Laundry & utility: Washer hookup; Electric dryer hookup; Laundry located in garage
Neighborhood map
What this means for you Summary
Snapshot
- This is a 3-bed/3.0-bath townhouse listed at $319k.
Deal economics
- At list price, monthly cash flow is $-35 ($-417/yr) — negative.
- To cash-flow at today's rent, offer at most $313k (1.9% below list).
- To meet the 1% rule (rent ≥ 1% of price), the offer needs to be $246k (23.0% below list).
- Recommended offer: $246k (23.0% below list) — sets the bar for 1% rule.
- Cap rate 6.2% vs local median 3.0% in Orlando — top-decile yield for the area; either an underpriced asset or a hidden risk that comps aren't pricing in. Stress-test before assuming the spread holds.
Location & tenants
- Location reads 86/100 on livability (#12 in FL, #360 nationally) — a professional / high-income tenant draw. Strengths: amenities A+, commute A+, housing A+.
- Orange (suburban): math 46% / reading 51% proficiency, ranked #43 of 73 in FL (top 59%) — families likely to look elsewhere, expect single-tenant / working-renter base with shorter leases.
- Zoned schools: Hidden Oaks Elementary (math 57% / reading 52%, grade C, #892 of 2,144 statewide, top 44%, 402 students, 50% FRL); Colonial High (math 16% / reading 33%, grade F, #505 of 667 statewide, top 79%, 3,442 students, 62% FRL) — zoned schools at 56% FRL track the district average.
- Market conditions: Rents rising (+2.4%/yr); 237 active listings in the ZIP; 16 comparable units currently listed for rent nearby; rentals at typical pace (median 20d on market — plan ~3-4 weeks tenant-placement turnaround); solid renter incomes; 8,053 units permitted in Orange County in 2024 (3,133 in 5+ unit buildings).
Forward outlook
- Local home prices are declining (-3.0%/yr); year-one equity from $2k of loan paydown is wiped out by about $10k of value loss. Plan a longer hold.
- Orange County population projected at +52% by 2050 — long-run rental-demand tailwind backs the buy-and-hold thesis.
Negotiation context
- It's been on market 36 days — a 3% lower offer ($309k) is reasonable based on typical stale-listing flexibility.
- 2 sale attempts since 16y ago with the ask held roughly flat each time — persistent listings suggest the price (not the market) is what's stuck; bring a comps-based counter.
- Current owner paid $81k; list at $319k implies a 294% gain — meaningful room to come down on a strong offer.
Risks & watch-outs
- Climate carrying-cost: severe wind risk, 99% chance of damaging wind over 30y; extreme-heat days projected 7→22/yr by 2055 (HVAC capex compounding) — expect insurance premiums to compound above CPI over the hold.
Questions for the listing agent
- What do current leases actually rent for vs. the listed asking? Can we see a recent rent roll and the last 12 months of T-12 income?
- It's been on market 36 days. Have you received any prior offers? Is the seller open to a 23% concession, seller financing, or rate buy-down credit?
- What does the HOA fee cover, when was the last increase, and are there any pending special assessments or reserve-fund shortfalls?
- Is there a deadline driving the sale (1031 exchange, divorce, estate, relocation)? That informs how much negotiation room exists.
- Schools are B-rated — typically a magnet for longer-tenancy family renters. What's the average tenant stay here, and is there a school-zone premium baked into asking?
- The area grade is low — what's the realistic commute time and amenity access for the typical tenant pool here? Any planned neighborhood developments (good or bad) we should know about?
- What's the average days-on-market for RENTAL listings here right now (not sales)? A rising rental-DOM trend means longer vacancies and softer asking-rent achievability than the comps imply.
- What's the recent tenant-quality profile in this submarket — average credit score on applications, eviction rate, late-payment / NSF rate, and stable-employment percentage? A property-management company in the area should have these aggregated.
- How much new for-sale + rental construction is in the pipeline within 1–3 miles? Heavy new supply typically softens prices + rents 12–24 months out; constrained supply supports both.
Investment metrics
- 1% rule
- 0.77% ✗
- Cap rate
- 6.16%
- Cash-on-cash
- -0.47%
- DSCR
- 0.98
- GRM
- 10.8
CMA / ARV
No comps found within radius.
Projected returns pro-forma
-3.0% appreciation · 2.35% rent growth · sell at horizon
- IRR
- -17.8%
- Equity multiple
- 0.38×
- Total profit
- $-55,604
- Equity at exit
- $47,564
- IRR
- -11.1%
- Equity multiple
- 0.35×
- Total profit
- $-58,154
- Equity at exit
- $27,581
Cash invested: $89,320 (down + closing). Projections, not guarantees.
Landlord ↔ Tenant lean methodology
- Overall (STATE)
- 87 Strongly Landlord-Friendly
- State Florida
- 87 Strongly Landlord-Friendly · R+3
- County
- — inherits STATE
- City
- — inherits STATE
ZIP-level market 32829
- Home prices YoY
- -20.9%
- Rents YoY
- 2.4%
- Active inventory
- 237
- Price-to-rent
- 10.8×
Monthly cashflow live
- Estimated rent
- $2,456 high interval (Pro) →
- Mortgage (P&I)
- −$1,673
- Tax from tax record
- −$153 /mo · $1,839/yr
- Insurance
- −$133
- HOA
- −$16
- Vacancy / Maint / Mgmt
- −$516
- Net cashflow
- $-35
Break-even live
UW: 25.0% down · 7.5% · 30yr · 1.5% tax · 5.0% vac · 8.0% maint · 8.0% mgmt
Financing live
Cash to close
- Down payment
- $79,750
- Closing costs
- $9,570
- Reserves months
- —
- Total cash needed
- —
Loan-product check · same deal, 3 products live
Conventional
25% down · 7.5% · 30yr
- Down + closing
- —
- Monthly P&I
- —
- Monthly cashflow
- —
- DSCR
- —
- Eligible?
- —
Personal DTI + credit; lowest rate.
DSCR
20% down · 8.5% · 30yr
- Down + closing
- —
- Monthly P&I
- —
- Monthly cashflow
- —
- DSCR
- —
- Eligible?
- —
No personal income docs; deal must DSCR.
Hard money
10% down · 12.0% · 12mo
- Down + closing
- —
- Monthly P&I
- —
- Monthly cashflow
- —
- DSCR
- —
- Eligible?
- —
Short-term bridge; refi at stabilization.
Rent comps 16 comps
| Address | Beds | Baths | Sqft | Rent | $/sqft | DOM | Units | Dist |
|---|---|---|---|---|---|---|---|---|
| 3003 Pigeon Hawk Ct Orlando, FL | 3.0 | 2.5 | 1555 | $2,650 | $1.70 | 21d | 1 | 0.07mi |
| 3228 Curry Woods Cir #2 Orlando, FL | 3.0 | 2.0 | 1447 | $2,321 | $1.60 | 7d | 1 | 0.48mi |
| 7931 Thrippence Ln Orlando, FL | 3.0 | 2.0 | 1225 | $2,000 | $1.63 | 23d | 1 | 0.66mi |
| 2454 Rio Pinar Lakes Blvd Orlando, FL | 3.0 | 2.5 | 1336 | $1,795 | $1.34 | 23d | 1 | 0.80mi |
| 2454 Rio Pinar Lakes Blvd Orlando, FL | 3.0 | 2.5 | 1208 | $1,795 | $1.49 | 20d | 1 | 0.80mi |
| 7870 Pine Fork Dr Orlando, FL | 3.0 | 2.0 | 1119 | $2,223 | $1.99 | 21d | 1 | 0.92mi |
| 2813 Whippet Ct Orlando, FL | 3.0 | 2.0 | 1368 | $2,349 | $1.72 | 3d | 1 | 1.01mi |
| 4233 Anthony Ln Orlando, FL | 3.0 | 1.0 | 1210 | $1,925 | $1.59 | 14d | 1 | 1.13mi |
| 7305 Marseille Cir Orlando, FL | 3.0 | 2.0 | 1138 | $2,199 | $1.93 | 14d | 1 | 1.15mi |
| 7528 Marbella Pointe Dr Orlando, FL | 1.0–4.0 | 1.0–3.0 | 1141 | $1,884 | $1.65 | 2d | 22 | 1.18mi |
| 2832 White Isle Ln Orlando, FL | 3.0 | 2.5 | 1532 | $2,400 | $1.57 | 21d | 1 | 1.26mi |
| 8467 Fort Thomas Way Orlando, FL | 3.0 | 2.0 | 1646 | $2,300 | $1.40 | 4d | 1 | 1.36mi |
| 7721 Silver Pointe Blvd Orlando, FL | 1.0–3.0 | 1.0–2.0 | 1050 | $1,935 | $1.84 | 2d | 23 | 1.39mi |
| 8225 Fort Thomas Way Orlando, FL | 2.0 | 2.0 | 1346 | $3,200 | $2.38 | 23d | 1 | 1.47mi |
| 8562 Fort Thomas Way Orlando, FL | 3.0 | 2.0 | 1408 | $2,540 | $1.80 | 3d | 1 | 1.47mi |
| 3049 Jon Jon Ct Orlando, FL | 3.0 | 2.0 | 1050 | $1,995 | $1.90 | 23d | 1 | 1.48mi |
HOA detail
- Monthly dues
- $16 · $192/yr
Listing history 18 events
-
2026-06-17status $319,000 Pending 36 DOM
-
2026-06-16days on market $319,000 Active 36 DOM
-
2026-06-15days on market $319,000 Active 35 DOM
-
2026-06-13days on market $319,000 Active 33 DOM
-
2026-06-13days on market $319,000 Active 32 DOM
-
2026-06-10status $319,000 Active 29 DOM
-
2026-06-07status $319,000 Pending 29 DOM
-
2026-06-04days on market $319,000 Active 29 DOM
-
2026-06-03days on market $319,000 Active 28 DOM
-
2026-06-02days on market $319,000 Active 27 DOM
-
2026-06-01pricedays on market $319,000 Active 26 DOM
-
2026-05-31days on market $330,000 Active 25 DOM
-
2026-05-06$330,000 Active
-
2011-08-10soldstatus $81,000
-
2011-03-24historical
-
2010-10-15$74,900
-
2006-09-19soldstatus $219,000
-
1996-07-11soldstatus $76,500
ⓘ Source: listings_history table (triggers on properties + properties_extension) + one-shot
backfill from property_details.listing_events for pre-trigger history.
Tax reassessment forecast FL · Resets to sale price
- Current annual tax
- $1,839 · $153/mo
- Projected year-2 tax
- $2,648 · $221/mo
- Expected delta
- +$809/yr (+$67/mo · 44.0%)
ⓘ Screening estimate from a state-policy table — verify with the county assessor before closing.
Climate risk First Street
- Flood 1/10 Low FEMA zone X (unshaded) · 0% chance over 30 yrs
- Wildfire 4/10 Moderate
- Heat 9/10 Extreme 7 d/yr ≥108°F today · 22 d/yr by 30 yrs out
- Wind 9/10 Extreme 99% chance of damaging wind over 30 yrs
- Air quality 2/10 Low 1 unhealthy d/yr today · 1 by 30 yrs out
Nearby sold comps map
Loading sold comps map…
Walkable amenities ~0.75 mi
Loading nearby amenities…
Taxation est. · year 1
- Rental income
- $29,473
- − Mortgage interest
- −$17,869
- − Property taxes
- −$1,839
- − Insurance
- −$1,595
- − Repairs & maintenance
- −$2,358
- − Management
- −$2,358
- − HOA
- −$192
- − Depreciation
- −$9,280
- Taxable loss
- −$6,018
- Est. tax savings @ 24.0%
- +$1,444
- After-tax cash flow
- $1,027/yr
For passive investors: Depreciation is non-cash, so a rental often shows a tax loss while cash-flowing — sheltering income. Rental losses are passive: they offset passive income freely, and up to $25,000/yr can offset ordinary (W-2) income if you actively participate and your MAGI is under $100k (phasing out to $0 by $150k); unused losses carry forward. On sale, claimed depreciation is recaptured at up to 25%, and gains may owe capital-gains tax (a 1031 exchange can defer both). Figures are a year-1 estimate at your 24.0% rate — not tax advice; consult a CPA.
Schools (NCES district)
- District
- Orange
- NCES district ID
- 1201440
- Math proficiency
- 46% ▼ -9.00%
- Reading proficiency
- 51% ▼ -2.00%
- Median HH income
- $49,350
- Composite
- 41.47/100
- National rank
- #3461
- State rank
- #43 of 73 in FL
Livability — Orlando
- Score
- 86/100
- State rank
- #12
- US rank
- #360
Category grades
Schools grade is shown separately in the Schools card above.
Census & demographics
- County
- Orange County · 1,471,359 people
- City population
- 964,969
- Metro
- Orlando-Kissimmee-Sanford, FL
- Population (ZIP)
- 20,819
- Household income
- $99,213
- Rent vs Own
- Severe rent burden
- 393.0
Population outlook (Orange County) Hauer SSP2
- Today (2025)
- 1,618,226 people
- By 2030
- 1,787,404 · +10.5%
- By 2040
- 2,125,621 · +31.4%
- By 2050
- 2,454,016 · +51.6%
- By 2075
- 3,173,711 · +96.1%
- By 2100
- 3,607,781 · +122.9%
Race, ethnicity, and origin ACS 2023
- Neighborhood character
- Diverse neighborhood (Simpson 0.55)
- Race & ethnicity
- Hispanic / Latino 63% Two or more races 24% White 21% Asian 8% Black 5% Pacific Islander 1%
- Hispanic origin (detail)
- Mexican 1% Puerto Rican 37% Cuban 5% Dominican 12%
- Common ancestry
- Lithuanian 1% Serbian 1% Romanian 1%
- Foreign-born
- 21% · Canada, Jamaica, China
- Languages at home
- 46% English-only · Spanish 44% Tagalog/Filipino 2% Other Indo-European 2%
Political lean MEDSL · Orange
- 2024 margin
- D (+13.6) · D 56.1% · R 42.5% · Other 1.3%
- 2008→2024 swing
- -5.0pp toward R · 2008: 18.6pp · 2024: 13.6pp
- All cycles
- 2024: D+13.6 2020: D+23.1 2016: D+24.6 2012: D+18.2 2008: D+18.6
Not yet ingested
- Civics
- —
Market trends
- HPI YoY
- ▼ -80.20%
- Current HPI
- 303.6592
- Rent YoY
- ▲ 2.35%
- Metro
- Orlando-Kissimmee-Sanford, FL
- State GDP YoY
- ▲ 3.28%
- F500 in state
- 36
Industry mix (Fortune 500 HQ in FL)
| Industry | F500 HQs | Revenue |
|---|---|---|
| Industrial Technology | 2 | $29B |
|
||
| Insurance | 2 | $17B |
|
||
| Retail | 1 | $60B |
|
||
| Technology Distribution | 1 | $58B |
|
||
| Homebuilding | 1 | $35B |
|
||
| Technology Manufacturing | 1 | $35B |
|
||
Price history
+331.4% since first listed6 events — show timeline
- 2026-05-06 Listed $330,000 Stellar MLS as Distributed by MLS Grid
- 2011-08-10 Sold (Public Records) $81,000 Public Records
- 2011-03-24 Listing Removed — Stellar MLS as Distributed by MLS Grid
- 2010-10-15 Listed $74,900 Stellar MLS as Distributed by MLS Grid
- 2006-09-19 Sold (Public Records) $219,000 Public Records
- 1996-07-11 Sold (Public Records) $76,500 Public Records
Property tax history
+1.8%/yrLatest (2025): $1,839 · +8.7% YoY. Source: county tax records.
Cash-flow waterfall
monthlySold comps — $/sqft
last 12 mo · ≤1 miLoading sold comps…