44813 Kla-Ha-Nei Trl Unit 2-A-1 · Concrete, WA
Flood risk 8/10 · Major
- FEMA flood zone
- X
- Chance of flooding over 30 yrs
- 0.99%
- Est. flood insurance / yr
- $507 – $1,088
Fire risk 3/10 · Minor
- Est. fire insurance / yr
- $604 – $1,122
Heat risk 1/10 · Minimal
- Hot days now (above 85°F)
- 7 days/yr
- Hot days in 30 yrs
- 16 days/yr
Wind risk 1/10 · Minimal
- Chance of severe wind over 30 yrs
- —
Air-quality risk 7/10 · Major
- Unhealthy air days now
- 12 days/yr
- Unhealthy air days in 30 yrs
- 12 days/yr
Risk factors via First Street. Map © Google.
Why this score? — see what drove the F grade
The composite is a weighted blend of 9 inputs, each scored 0–100. Each bar is that input's sub-score; the figure is the points it added to the 100-point composite (weight × sub-score).
- Appreciation +10.0/10.0
- ARV discount +7.5/15.0
- Livability +3.8/5.0
- Schools +3.2/10.0
- Rent growth +2.5/5.0
- Condition / age +2.2/5.0
- Cash flow +0.0/30.0
- 1% rule +0.0/10.0
- DSCR +0.0/10.0
$94,999
🖨 Deal sheet 📄 Offer letter ✓ Due diligence
Listing remarks
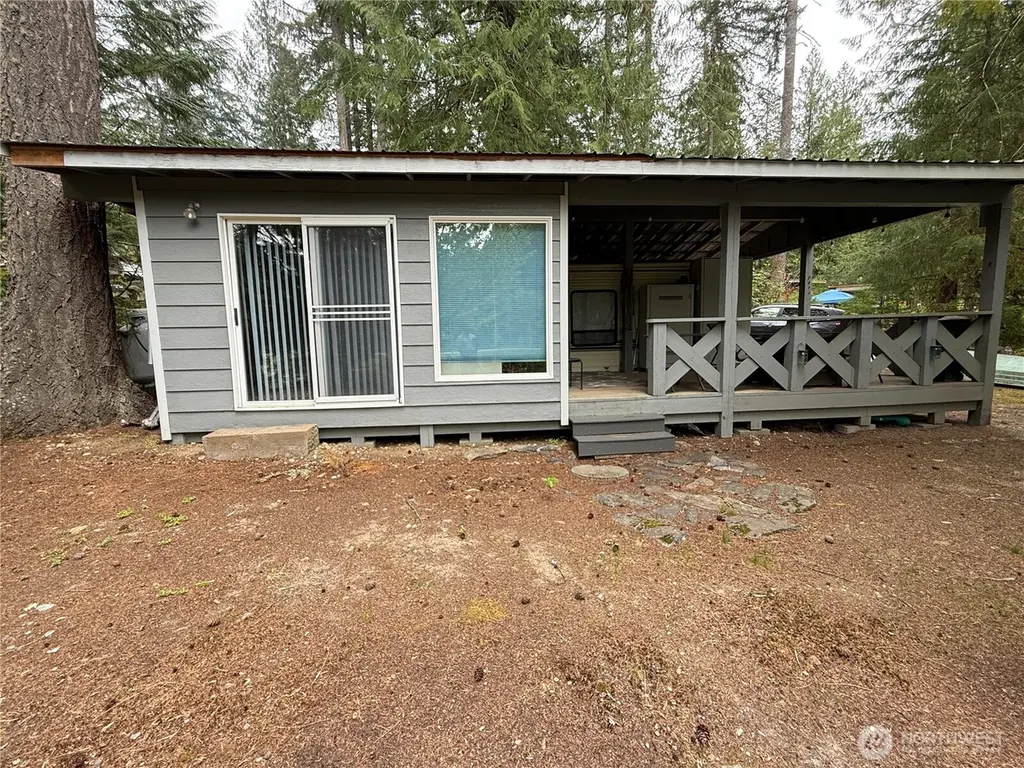
Enjoy lake living at its best in the sought-after Lake Tyee community! This flat, corner lot features a turnkey 35' Sandpiper RV with a fully covered setup, bunk room and added living room, spacious deck, and beautiful lake views—comfortably sleeping 6+ for the perfect relaxing getaway or get together. Ideally located with direct lake access and just a short walk to the clubhouse, pools, playground, sport courts, mini golf, and nearby comfort station with restrooms and showers. Spend your days kayaking, fishing, swimming, hiking the scenic trails, or unwinding around the fire pit after a day on the lake. Covered wood storage adds convenience, while the welcoming community atmosphere m
Key facts
- Lake views
- Direct lake access
- Spacious deck
Tags
Property features AI
Finance
- Other: Zoned for recreation/cabin use
- Financial info: Listing terms: Cash
- HOA & community: Located in Lake Tyee Division No.2 with HOA; Monthly association fee of $187; HOA fee covers water, sewer, trash, road and common area maintenance, lawn service, snow removal, and security; Community amenities include athletic court, boat launch, clubhouse, gated entry, golf, park, playground, trails, and community waterfront/private beach
Exterior
- Parking: Off-street driveway parking; Uncovered parking for 4 vehicles; RV parking available
- Security: Gated community with security gate and security service
- Utilities: Community water; Septic sewer; Power passthrough via HOA (PSE); Internet via Starlink; Propane available
- Home design: Manufactured single-wide on land (Sandpiper 35FB); Detached; One story; Facing south; Has view
- Construction: Metal/vinyl construction; Composition and metal roof options; Tie-down foundation
- Exterior features: Metal/vinyl exterior; Deck; Outdoor fireplace; Patio; High-speed internet (Starlink); RV parking; Corner lot on a dirt road; Level topography; Open space
Interior
- Kitchen: Microwave, Refrigerator, Stove/Range
- Bedrooms: 1 bedroom on the main level; Option for a second bedroom
- Flooring: Laminate; Vinyl
- Bathrooms: 1 full bathroom with tub and shower
- Heating & cooling: Forced air heating (high-efficiency); Central air conditioning
- Interior features: Microwave, Refrigerator, Stove/Range; Laminate and vinyl flooring; No basement
- Laundry & utility: Propane and electric energy sources
Neighborhood map
What this means for you Summary
Snapshot
- This is a manufactured listed at $95k. Condition is rated fair.
Deal economics
- At list price, monthly cash flow is $-910 ($-11k/yr) — negative.
- Rent doesn't cover operating costs at any purchase price — skip.
- Cap rate -4.4% vs local median 2.6% in Concrete — below-typical yield; the buyer is paying a premium for something (appreciation thesis, condition, location) that the cap rate doesn't capture.
Location & tenants
- Location reads 76/100 on livability (#157 in WA, #3,709 nationally) — a middle-class / working-renter tenant base. Strengths: housing A+, health & safety A+, cost of living A; Watch: schools D, crime F, amenities F.
- Concrete School District (rural): math 24% / reading 45% proficiency, ranked #255 of 291 in WA (top 88%) — families likely to look elsewhere, expect single-tenant / working-renter base with shorter leases.
- Market conditions: 96 active listings in the ZIP; 561 units permitted in Skagit County in 2024 (270 in 5+ unit buildings).
Forward outlook
- In year one you build about $10k of equity ($657 loan paydown + $10k appreciation (10.0% local appreciation)).
- Skagit County population projected at +11% by 2050 — modest demand growth; plan on rents tracking national, not racing it.
- By year 4, paydown + projected appreciation supports a ~$36k cash-out refi (75% LTV) — recoverable capital for the next deal without selling this one.
Negotiation context
- Only 1 days on market — expect competitive offers; lowballing is unlikely to land.
Risks & watch-outs
- Watch-outs: flood insurance adds $66/mo.
- Climate carrying-cost: severe flood risk — expect insurance premiums to compound above CPI over the hold.
Questions for the listing agent
- What do current leases actually rent for vs. the listed asking? Can we see a recent rent roll and the last 12 months of T-12 income?
- Have any recent inspections been done? Can we get a copy of the seller's disclosures and any deferred-maintenance estimates?
- What's the actual annual flood-insurance premium (NFIP or private), and is the property in a SFHA with mandatory coverage?
- What does the HOA fee cover, when was the last increase, and are there any pending special assessments or reserve-fund shortfalls?
- Is there a deadline driving the sale (1031 exchange, divorce, estate, relocation)? That informs how much negotiation room exists.
- Schools are D-rated, which usually means shorter tenancies and higher turnover. Who's the typical renter profile here, and what's been the actual vacancy rate?
- Crime grade is F in this area — have there been break-ins, vandalism, or insurance claims at this property in the last 3 years? What carrier currently insures it and at what premium?
- The area grade is low — what's the realistic commute time and amenity access for the typical tenant pool here? Any planned neighborhood developments (good or bad) we should know about?
- What's the average days-on-market for RENTAL listings here right now (not sales)? A rising rental-DOM trend means longer vacancies and softer asking-rent achievability than the comps imply.
- What's the recent tenant-quality profile in this submarket — average credit score on applications, eviction rate, late-payment / NSF rate, and stable-employment percentage? A property-management company in the area should have these aggregated.
- How much new for-sale + rental construction is in the pipeline within 1–3 miles? Heavy new supply typically softens prices + rents 12–24 months out; constrained supply supports both.
Investment metrics
- 1% rule
- 0.00% ✗
- Cap rate
- -4.36%
- Cash-on-cash
- -38.05%
- DSCR
- -0.69
- GRM
- 0.0
CMA / ARV
No comps found within radius.
Show comp detail 12 sales within ~0.75 mi
| Address | Dist | Beds/Ba | Sqft | Sold | Price | $/sf | Match |
|---|---|---|---|---|---|---|---|
| 44754 Kachess Trl Unit 2C2 | 0.21mi | 1/1.0 | 392 | 11mo | $65,000 | $166 | 69 |
| 4980 Kahtai Trl Unit C-64 | 0.43mi | 1/1.0 | 381 | 2mo | $105,000 | $276 | 65 |
| 4636 Skagit Trl Unit 1D36 | 0.34mi | 1/1.0 | 678 | 10mo | $65,000 | $96 | 64 |
| 45153 Kalakala Trl Unit D-2 | 0.56mi | 1/1.0 | 382 | 1mo | $180,000 | $471 | 61 |
| 45016 Kachess Trl Unit 3C86 | 0.60mi | 1/1.0 | 395 | 1mo | $95,000 | $241 | 58 |
| 4605 Skagit Trl | 0.29mi | 2/1.0 | 644 | 20mo | $44,000 | $68 | 57 |
| 45263 Tillicum Trl | 0.71mi | 1/1.0 | 483 | 2mo | $46,500 | $96 | 53 |
| 45038 SIKHS Trl Unit 3C85 | 0.60mi | 1/1.0 | 400 | 12mo | $145,950 | $365 | 50 |
| 4996 Kullah Trl | 0.62mi | 1/1.0 | 377 | 11mo | $152,000 | $403 | 49 |
| 45040 Tyee Dr S | 0.46mi | 1/1.0 | 400 | 20mo | $95,000 | $238 | 49 |
| 45279 Kachess Trl | 0.69mi | 1/1.0 | 320 | 14mo | $58,000 | $181 | 43 |
| 45272 Nesika Trl | 0.70mi | 1/1.0 | 700 | 16mo | $71,500 | $102 | 41 |
Match score weights: distance 35% · size 25% · config 20% · recency 20%. Top-matched comps best support the ARV.
Projected returns pro-forma
10.0% appreciation · 3.0% rent growth · sell at horizon
- IRR
- -2.6%
- Equity multiple
- 0.77×
- Total profit
- $-6,062
- Equity at exit
- $85,583
- IRR
- 3.3%
- Equity multiple
- 2.05×
- Total profit
- $28,035
- Equity at exit
- $184,562
Cash invested: $26,600 (down + closing). Projections, not guarantees.
Landlord ↔ Tenant lean methodology
- Overall (STATE)
- 28 Tenant-Leaning
- State Washington
- 28 Tenant-Leaning · D+8
- County
- — inherits STATE
- City
- — inherits STATE
ZIP-level market 98237
- Home prices YoY
- 18.6%
- Active inventory
- 96
Monthly cashflow live
- Estimated rent
- $0 none
- Mortgage (P&I)
- −$498
- Tax est. 1.5%
- −$119 /mo · $1,425/yr
- Insurance
- −$40
- Flood insurance flood zone
- −$66 /mo · $798/yr
- HOA
- −$187
- Vacancy / Maint / Mgmt
- −$0
- Net cashflow
- $-910
Break-even live
UW: 25.0% down · 7.5% · 30yr · 1.5% tax · 5.0% vac · 8.0% maint · 8.0% mgmt
Financing live
Cash to close
- Down payment
- $23,750
- Closing costs
- $2,850
- Reserves months
- —
- Total cash needed
- —
Loan-product check · same deal, 3 products live
Conventional
25% down · 7.5% · 30yr
- Down + closing
- —
- Monthly P&I
- —
- Monthly cashflow
- —
- DSCR
- —
- Eligible?
- —
Personal DTI + credit; lowest rate.
DSCR
20% down · 8.5% · 30yr
- Down + closing
- —
- Monthly P&I
- —
- Monthly cashflow
- —
- DSCR
- —
- Eligible?
- —
No personal income docs; deal must DSCR.
Hard money
10% down · 12.0% · 12mo
- Down + closing
- —
- Monthly P&I
- —
- Monthly cashflow
- —
- DSCR
- —
- Eligible?
- —
Short-term bridge; refi at stabilization.
HOA detail
- Monthly dues
- $187 · $2,244/yr
- Likely covers
- pool
Listing history 10 events
-
2026-06-13statusdays on market $94,999 Pending 1 DOM
-
2026-06-10days on market $94,999 Active 15 DOM
-
2026-06-09days on market $94,999 Active 14 DOM
-
2026-06-08days on market $94,999 Active 13 DOM
-
2026-06-07days on market $94,999 Active 12 DOM
-
2026-06-02days on market $94,999 Active 7 DOM
-
2026-06-01days on market $94,999 Active 6 DOM
-
2026-05-31days on market $94,999 Active 5 DOM
-
2026-05-30days on market $94,999 Active 4 DOM
-
2026-05-26$94,999 Active
ⓘ Source: listings_history table (triggers on properties + properties_extension) + one-shot
backfill from property_details.listing_events for pre-trigger history.
Climate risk First Street
- Flood 8/10 Severe FEMA zone X · 99% chance over 30 yrs
- Wildfire 3/10 Moderate
- Heat 1/10 Low 7 d/yr ≥85°F today · 16 d/yr by 30 yrs out
- Wind 1/10 Low
- Air quality 7/10 Severe 12 unhealthy d/yr today · 12 by 30 yrs out
Nearby sold comps map
Loading sold comps map…
Walkable amenities ~0.75 mi
Loading nearby amenities…
Taxation est. · year 1
- Rental income
- $0
- − Mortgage interest
- −$5,321
- − Property taxes
- −$1,425
- − Insurance
- −$1,272
- − Repairs & maintenance
- −$0
- − Management
- −$0
- − HOA
- −$2,244
- − Depreciation
- −$2,764
- Taxable loss
- −$13,027
- Est. tax savings @ 24.0%
- +$3,126
- After-tax cash flow
- $-7,793/yr
For passive investors: Depreciation is non-cash, so a rental often shows a tax loss while cash-flowing — sheltering income. Rental losses are passive: they offset passive income freely, and up to $25,000/yr can offset ordinary (W-2) income if you actively participate and your MAGI is under $100k (phasing out to $0 by $150k); unused losses carry forward. On sale, claimed depreciation is recaptured at up to 25%, and gains may owe capital-gains tax (a 1031 exchange can defer both). Figures are a year-1 estimate at your 24.0% rate — not tax advice; consult a CPA.
Condition & rehab AI · 2 photos
This manufactured home requires significant repairs and maintenance, including roof, exterior siding, flooring, interior walls, HVAC system, and landscaping. These improvements will significantly increase its resale and rental value.
Repairs flagged
- Major roof — Significant damage and potential leaks.
- Moderate exterior siding — Visible wear and tear.
- Major flooring — Severe wear and tear.
- Major interior walls/paint — Severe wear and tear.
- Major HVAC system — Visible rust and wear.
- Major landscaping — Overgrown vegetation and lack of maintenance.
Value-add opportunities
- Both roof repair — Fixing the roof will improve both the resale and rental value.
- Both exterior siding repair — Repairing the siding will improve the curb appeal and increase the property's value.
- Both flooring replacement — Replacing the flooring will improve the interior condition and increase the property's value.
- Both interior paint — Painting the interior walls will improve the condition and increase the property's value.
- Both HVAC system replacement — Replacing the HVAC system will improve the comfort and energy efficiency of the home, increasing its value.
- Both landscaping and curb appeal — Improving the landscaping and curb appeal will increase the property's value and attract more potential buyers/tenants.
Renovation cost estimate screening
| Repair item | Severity | Est. cost |
|---|---|---|
| roof · Significant damage and potential leaks. | Major | $15,000–50,000 |
| exterior siding · Visible wear and tear. | Moderate | $3,000–15,000 |
| flooring · Severe wear and tear. | Major | $15,000–50,000 |
| interior walls/paint · Severe wear and tear. | Major | $15,000–50,000 |
| HVAC system · Visible rust and wear. | Major | $15,000–50,000 |
| landscaping · Overgrown vegetation and lack of maintenance. | Major | $15,000–50,000 |
| Total estimated repair cost · 6 items | $78,000–265,000 |
Value-add ROI direction
- Both roof repair — Fixing the roof will improve both the resale and rental value. ↑
- Both exterior siding repair — Repairing the siding will improve the curb appeal and increase the property's value. ↑
- Both flooring replacement — Replacing the flooring will improve the interior condition and increase the property's value. ↑
- Both interior paint — Painting the interior walls will improve the condition and increase the property's value. ↑
- Both HVAC system replacement — Replacing the HVAC system will improve the comfort and energy efficiency of the home, increasing its value. ↑
- Both landscaping and curb appeal — Improving the landscaping and curb appeal will increase the property's value and attract more potential buyers/tenants. ↑
ⓘ Cost ranges are severity-bucket heuristics (US national rule-of-thumb). Get contractor quotes + a written scope before underwriting a rehab budget.
Schools (NCES district)
- District
- Concrete School District
- NCES district ID
- 5301660
- Math proficiency
- 24% ▼ -1.00%
- Reading proficiency
- 45% ▲ 7.00%
- Median HH income
- $43,849
- Composite
- 31.96/100
- National rank
- #11033
- State rank
- #255 of 291 in WA
Livability — Concrete
- Score
- 76/100
- State rank
- #157
- US rank
- #3709
Category grades
Schools grade is shown separately in the Schools card above.
Census & demographics
- Population (ZIP)
- 5,110
Population outlook (Skagit County) Hauer SSP2
- Today (2025)
- 131,498 people
- By 2030
- 135,556 · +3.1%
- By 2040
- 141,717 · +7.8%
- By 2050
- 145,714 · +10.8%
- By 2075
- 152,201 · +15.7%
- By 2100
- 147,980 · +12.5%
Race, ethnicity, and origin ACS 2023
- Neighborhood character
- Predominantly White (79%)
- Race & ethnicity
- White 79% Hispanic / Latino 12% Two or more races 8% Native American 1%
- Hispanic origin (detail)
- Mexican 3% Puerto Rican 2%
- Common ancestry
- Portuguese 5% Iranian 4% Slovak 3%
- Foreign-born
- 3% · Canada
- Languages at home
- 94% English-only · Spanish 4% French/Haitian/Cajun 1% Russian/Polish/Slavic 1%
Political lean MEDSL · Skagit
- 2024 margin
- Lean D (+8.9) · D 52.9% · R 44.0% · Other 3.0%
- 2008→2024 swing
- -0.7pp no change · 2008: 9.6pp · 2024: 8.9pp
- All cycles
- 2024: D+8.9 2020: D+7.5 2016: D+3.2 2012: D+5.8 2008: D+9.6
Not yet ingested
- Civics
- —
Market trends
- HPI YoY
- ▲ 83.52%
- Current HPI
- 533.5113
- Rent YoY
- —
- Metro
- —
- State GDP YoY
- ▲ 4.65%
- F500 in state
- 22
Industry mix (Fortune 500 HQ in WA)
| Industry | F500 HQs | Revenue |
|---|---|---|
| Retail | 2 | $269B |
|
||
| Technology / Retail | 1 | $638B |
|
||
| Technology | 1 | $245B |
|
||
| Telecommunications | 1 | $38B |
|
||
| Food / Beverage | 1 | $36B |
|
||
| Automotive / Trucks | 1 | $34B |
|
||
Price history
1 event — show timeline
- 2026-05-26 Listed $94,999 NWMLS as Distributed by MLS Grid
Cash-flow waterfall
monthlySold comps — $/sqft
last 12 mo · ≤1 miLoading sold comps…