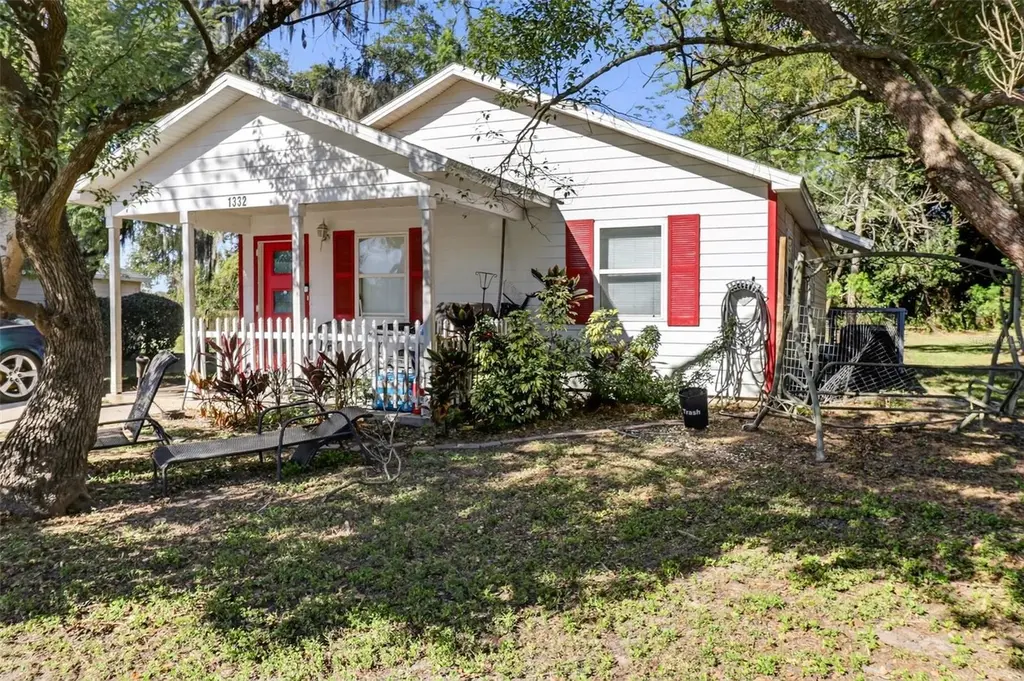
1332 7th Ct · Lakeland, FL
Flood risk 1/10 · Minimal
- FEMA flood zone
- X (unshaded)
- Chance of flooding over 30 yrs
- 0.0%
- Est. flood insurance / yr
- $507 – $1,088
Fire risk 1/10 · Minimal
- Est. fire insurance / yr
- $947 – $1,759
Heat risk 8/10 · Major
- Hot days now (above 108°F)
- 7 days/yr
- Hot days in 30 yrs
- 23 days/yr
Wind risk 9/10 · Severe
- Chance of severe wind over 30 yrs
- 99.0%
Air-quality risk 2/10 · Minimal
- Unhealthy air days now
- 1 days/yr
- Unhealthy air days in 30 yrs
- 1 days/yr
Risk factors via First Street. Map © Google.
Why this score? — see what drove the D grade
The composite is a weighted blend of 9 inputs, each scored 0–100. Each bar is that input's sub-score; the figure is the points it added to the 100-point composite (weight × sub-score).
- Cash flow +13.6/30.0
- ARV discount +7.5/15.0
- DSCR +4.1/10.0
- Livability +3.9/5.0
- Schools +3.5/10.0
- 1% rule +3.4/10.0
- Rent growth +2.7/5.0
- Condition / age +2.5/5.0
- Appreciation +0.0/10.0
$208,000
🖨 Deal sheet (PDF) 📄 Offer letter ✓ Due diligence
Listing remarks
Under contract-accepting backup offers. Move-in ready and priced to sell, this one-story 4-bedroom, 2-bath home offers immediate value and peace of mind in North Lakeland. Major updates were completed in 2017, including the roof, HVAC, water heater, plumbing, and electrical, allowing buyers to move in with confidence and minimal future maintenance. The functional layout provides comfortable living spaces, while the backyard shed adds extra storage flexibility. Conveniently located near shopping, dining, and popular Lakeland destinations, this home delivers both practicality and lifestyle appeal. Connected to public water and sewer and available for immediate occupancy, making it an excellen
Key facts
- One story
- Public sewer
- Backyard shed
Tags
Neighborhood map
What this means for you Summary
Snapshot
- This is a 3-bed/2.0-bath single-family listed at $208k.
Deal economics
- At list price, monthly cash flow is $10 ($116/yr) — positive.
- The deal already cash-flows at list — no discount required.
- To meet the 1% rule (rent ≥ 1% of price), the offer needs to be $175k (16.0% below list).
- Recommended offer: $175k (16.0% below list) — sets the bar for 1% rule.
Location & tenants
- Location reads 77/100 on livability (#206 in FL, #3,179 nationally) — a middle-class / working-renter tenant base. Strengths: cost of living A+, housing A+, health & safety A+; Watch: employment D+, amenities F, commute F.
- Polk (suburban): math 39% / reading 43% proficiency, ranked #62 of 73 in FL (top 85%) — families likely to look elsewhere, expect single-tenant / working-renter base with shorter leases.
- Zoned schools: Sleepy Hill Elementary School (math 44% / reading 38%, grade F, #1,454 of 2,144 statewide, top 69%, 739 students, 66% FRL); Sleepy Hill Middle School (math 29% / reading 34%, grade F, #453 of 571 statewide, top 81%, 1,090 students, 66% FRL); Kathleen Senior High School (math 19% / reading 31%, grade F, #501 of 667 statewide, top 75%, 2,051 students, 59% FRL) — zoned schools at 64% FRL track the district average.
- Market conditions: Rents flat; 164 active listings in the ZIP; 20 comparable units currently listed for rent nearby; rentals at typical pace (median 25d on market — plan ~3-4 weeks tenant-placement turnaround); 10,384 units permitted in Polk County in 2024 (1,716 in 5+ unit buildings).
- This rent runs 33% of the median local income ($63k/yr) — at the standard rent-burdened threshold; future hikes will face affordability resistance.
Forward outlook
- Local home prices are declining (-3.0%/yr); year-one equity from $1k of loan paydown is wiped out by about $6k of value loss. Plan a longer hold.
- Polk County population projected at +33% by 2050 — long-run rental-demand tailwind backs the buy-and-hold thesis.
Negotiation context
- It's been on market 81 days — a 6% lower offer ($196k) is reasonable based on typical stale-listing flexibility.
- 2 sale attempts; this cycle's ask has dropped $11k (5%) from the opening price — seller is motivated, your offer sets the floor, not the list.
Risks & watch-outs
- Climate carrying-cost: severe wind risk, 99% chance of damaging wind over 30y; extreme-heat days projected 7→23/yr by 2055 (HVAC capex compounding) — expect insurance premiums to compound above CPI over the hold.
Questions for the listing agent
- It's been on market 81 days. Have you received any prior offers? Is the seller open to a 16% concession, seller financing, or rate buy-down credit?
- Why hasn't it sold? Are there any deal-killer items the seller is aware of (foundation, flood, title, zoning, code violations)?
- Is there a deadline driving the sale (1031 exchange, divorce, estate, relocation)? That informs how much negotiation room exists.
- The area grade is low — what's the realistic commute time and amenity access for the typical tenant pool here? Any planned neighborhood developments (good or bad) we should know about?
- What's the average days-on-market for RENTAL listings here right now (not sales)? A rising rental-DOM trend means longer vacancies and softer asking-rent achievability than the comps imply.
- What's the recent tenant-quality profile in this submarket — average credit score on applications, eviction rate, late-payment / NSF rate, and stable-employment percentage? A property-management company in the area should have these aggregated.
- How much new for-sale + rental construction is in the pipeline within 1–3 miles? Heavy new supply typically softens prices + rents 12–24 months out; constrained supply supports both.
Investment metrics
- 1% rule
- 0.84% ✗
- Cap rate
- 6.35%
- Cash-on-cash
- 0.20%
- DSCR
- 1.01
- GRM
- 9.9
CMA / ARV
No comps found within radius.
Projected returns pro-forma
-3.0% appreciation · 0.77% rent growth · sell at horizon
- IRR
- -18.4%
- Equity multiple
- 0.37×
- Total profit
- $-36,938
- Equity at exit
- $31,013
- IRR
- -15.7%
- Equity multiple
- 0.20×
- Total profit
- $-46,477
- Equity at exit
- $17,984
Cash invested: $58,240 (down + closing). Projections, not guarantees.
Landlord ↔ Tenant lean methodology
- Overall (STATE)
- 87 Strongly Landlord-Friendly
- State Florida
- 87 Strongly Landlord-Friendly · R+3
- County
- — inherits STATE
- City
- — inherits STATE
ZIP-level market 33805
- Home prices YoY
- -29.8%
- Rents YoY
- 0.8%
- Active inventory
- 164
- Price-to-rent
- 9.9×
Monthly cashflow live
- Estimated rent
- $1,747 high interval (Pro) →
- Mortgage (P&I)
- −$1,091
- Tax from tax record
- −$193 /mo · $2,314/yr
- Insurance
- −$87
- HOA
- −$0
- Vacancy / Maint / Mgmt
- −$367
- Net cashflow
- $10
Break-even live
Sensitivity live
| Price | -10% $127 | -5% $69 | +0% $10 | +5% $-49 | +10% $-108 |
|---|---|---|---|---|---|
| Rent | -10% $-128 | -5% $-59 | +0% $10 | +5% $79 | +10% $148 |
| Rate | -1.0pp $114 | -0.5pp $63 | base $10 | +0.5pp $-44 | +1.0pp $-99 |
UW: 25.0% down · 7.5% · 30yr · 1.5% tax · 5.0% vac · 8.0% maint · 8.0% mgmt
Financing live
Cash to close
- Down payment
- $52,000
- Closing costs
- $6,240
- Reserves months
- —
- Total cash needed
- —
Loan-product check · same deal, 3 products live
Conventional
25% down · 7.5% · 30yr
- Down + closing
- —
- Monthly P&I
- —
- Monthly cashflow
- —
- DSCR
- —
- Eligible?
- —
Personal DTI + credit; lowest rate.
DSCR
20% down · 8.5% · 30yr
- Down + closing
- —
- Monthly P&I
- —
- Monthly cashflow
- —
- DSCR
- —
- Eligible?
- —
No personal income docs; deal must DSCR.
Hard money
10% down · 12.0% · 12mo
- Down + closing
- —
- Monthly P&I
- —
- Monthly cashflow
- —
- DSCR
- —
- Eligible?
- —
Short-term bridge; refi at stabilization.
Rent comps 20 comps
| Address | Beds | Baths | Sqft | Rent | $/sqft | DOM | Units | Dist |
|---|---|---|---|---|---|---|---|---|
| 1137 Edith Ave Lakeland, FL | 3.0 | 1.0 | 1100 | $1,800 | $1.64 | 5d | 1 | 0.19mi |
| 1105 Jewel Ave Lakeland, FL | 2.0 | 1.0 | 987 | $1,200 | $1.22 | 25d | 1 | 0.31mi |
| 1128 Neville Ave Lakeland, FL | 3.0 | 2.0 | 1245 | $1,900 | $1.53 | 16d | 1 | 0.34mi |
| 2340 Shasta St Lakeland, FL | 3.0–5.0 | 2.0–3.0 | 2098 | $2,185 | $1.04 | 5d | 3 | 0.53mi |
| 1550 Wright Dr Lakeland, FL | 3.0 | 1.5 | 1139 | $1,650 | $1.45 | 23d | 1 | 0.55mi |
| 815 N Davis Ave Lakeland, FL | 3.0 | 2.0 | 960 | $1,450 | $1.51 | 25d | 1 | 0.64mi |
| 806 N Swindell Ave Lakeland, FL | 3.0 | 2.0 | 995 | $1,450 | $1.46 | 25d | 1 | 0.68mi |
| 738 N Lorri Ave Lakeland, FL | 4.0 | 2.5 | 1500 | $2,600 | $1.73 | 16d | 1 | 0.68mi |
| 1211 Robert King High Dr Lakeland, FL | 3.0 | 1.5 | 1050 | $1,625 | $1.55 | 25d | 1 | 0.78mi |
| 2117 Ivey Ln Lakeland, FL | 3.0 | 1.0 | 1160 | $1,980 | $1.71 | 25d | 1 | 0.98mi |
| 820 W 13th St Lakeland, FL | 2.0 | 1.0 | 950 | $1,300 | $1.37 | 25d | 1 | 0.99mi |
| 809 Adams St Lakeland, FL | 3.0 | 1.0 | 1164 | $1,525 | $1.31 | 16d | 1 | 1.14mi |
| 1906 Griffin Rd Lakeland, FL | 1.0–3.0 | 1.0–2.0 | 1148 | $2,339 | $2.04 | 5d | 11 | 1.26mi |
| 1704 Martin L King Jr Ave Lakeland, FL | 2.0 | 2.0 | 1050 | $5,000 | $4.76 | 25d | 1 | 1.33mi |
| 2259 Chestnut Woods Dr Lakeland, FL | 2.0 | 1.0 | 1001 | $1,400 | $1.40 | 16d | 1 | 1.35mi |
| 1031 N Florence Ave Unit NA Lakeland, FL | 3.0 | 2.0 | 1100 | $1,495 | $1.36 | 16d | 1 | 1.36mi |
| 850 Martin L King Jr Ave Lakeland, FL | 3.0 | 1.0 | 1222 | $1,495 | $1.22 | 25d | 1 | 1.36mi |
| 2463 Chestnut Woods Dr Lakeland, FL | 2.0 | 1.0 | 910 | $1,500 | $1.65 | 25d | 1 | 1.39mi |
| 1615 N New York Ave Lakeland, FL | 2.0 | 1.0 | 1300 | $1,195 | $0.92 | 25d | 1 | 1.44mi |
| 2559 Chestnut Woods Dr Lakeland, FL | 2.0 | 1.0 | 1001 | $1,500 | $1.50 | 16d | 1 | 1.45mi |
Listing history 6 events
-
2026-04-15status Pending
-
2026-03-27status Active
-
2026-02-20status Pending
-
2026-02-12price $208,000
-
2026-01-12price $213,999
-
2025-12-20$219,000 Active
ⓘ Source: listings_history table (triggers on properties + properties_extension) + one-shot
backfill from property_details.listing_events for pre-trigger history.
Tax reassessment forecast FL · Resets to sale price
- Current annual tax
- $2,314 · $193/mo
- Projected year-2 tax
- $2,314 · $193/mo
- Expected delta
- $0/yr ($0/mo · 0.0%)
ⓘ Screening estimate from a state-policy table — verify with the county assessor before closing.
Climate risk First Street
- Flood 1/10 Low FEMA zone X (unshaded) · 0% chance over 30 yrs
- Wildfire 1/10 Low
- Heat 8/10 Severe 7 d/yr ≥108°F today · 23 d/yr by 30 yrs out
- Wind 9/10 Extreme 99% chance of damaging wind over 30 yrs
- Air quality 2/10 Low 1 unhealthy d/yr today · 1 by 30 yrs out
Nearby sold comps map
Loading sold comps map…
Walkable amenities ~0.75 mi
Loading nearby amenities…
Taxation est. · year 1
- Rental income
- $20,961
- − Mortgage interest
- −$11,651
- − Property taxes
- −$2,314
- − Insurance
- −$1,040
- − Repairs & maintenance
- −$1,677
- − Management
- −$1,677
- − Depreciation
- −$6,051
- Taxable loss
- −$3,449
- Est. tax savings @ 24.0%
- +$828
- After-tax cash flow
- $944/yr
For passive investors: Depreciation is non-cash, so a rental often shows a tax loss while cash-flowing — sheltering income. Rental losses are passive: they offset passive income freely, and up to $25,000/yr can offset ordinary (W-2) income if you actively participate and your MAGI is under $100k (phasing out to $0 by $150k); unused losses carry forward. On sale, claimed depreciation is recaptured at up to 25%, and gains may owe capital-gains tax (a 1031 exchange can defer both). Figures are a year-1 estimate at your 24.0% rate — not tax advice; consult a CPA.
Schools (NCES district)
- District
- Polk
- NCES district ID
- 1201590
- Math proficiency
- 39% ▼ -11.00%
- Reading proficiency
- 43% ▼ -4.00%
- Median HH income
- $43,979
- Composite
- 34.74/100
- National rank
- #5132
- State rank
- #62 of 73 in FL
Livability — Lakeland
- Score
- 77/100
- State rank
- #206
- US rank
- #3179
Category grades
Schools grade is shown separately in the Schools card above.
Census & demographics
- Census place
- Lakeland, FL
- County
- Polk County · 740,051 people
- City population
- 277,690
- Metro
- Lakeland-Winter Haven, FL
- Population (ZIP)
- 28,751
- Household income
- $62,661
- Rent vs Own
- Severe rent burden
- 1179.0
Population outlook (Polk County) Hauer SSP2
- Today (2025)
- 752,975 people
- By 2030
- 804,621 · +6.9%
- By 2040
- 906,117 · +20.3%
- By 2050
- 1,000,476 · +32.9%
- By 2075
- 1,197,520 · +59.0%
- By 2100
- 1,271,518 · +68.9%
Race, ethnicity, and origin ACS 2023
- Neighborhood character
- Diverse neighborhood (Simpson 0.68)
- Race & ethnicity
- White 38% Black 37% Hispanic / Latino 20% Two or more races 8% Asian 1%
- Hispanic origin (detail)
- Mexican 5% Puerto Rican 9% Cuban 2%
- Common ancestry
- Hispanic 2% Lithuanian 1% Romanian 1%
- Foreign-born
- 12% · Canada, Jamaica
- Languages at home
- 79% English-only · Spanish 16% French/Haitian/Cajun 2% Other Asian/Pacific 1%
Political lean MEDSL · Polk
- 2024 margin
- Strong R (+20.7) · D 39.2% · R 59.9%
- 2008→2024 swing
- -14.6pp toward R · 2008: -6.1pp · 2024: -20.7pp
- All cycles
- 2024: R+20.7 2020: R+14.4 2016: R+14.1 2012: R+6.8 2008: R+6.1
Not yet ingested
- Civics
- —
Market trends
- HPI YoY
- ▼ -158.44%
- Current HPI
- 372.7317
- Rent YoY
- ▲ 0.77%
- Metro
- Lakeland-Winter Haven, FL
- State GDP YoY
- ▲ 3.28%
- F500 in state
- 36
Industry mix (Fortune 500 HQ in FL)
| Industry | F500 HQs | Revenue |
|---|---|---|
| Industrial Technology | 2 | $29B |
|
||
| Insurance | 2 | $17B |
|
||
| Retail | 1 | $60B |
|
||
| Technology Distribution | 1 | $58B |
|
||
| Homebuilding | 1 | $35B |
|
||
| Technology Manufacturing | 1 | $35B |
|
||
Price history
-5.0% since first listed6 events — show timeline
- 2026-04-15 Pending — Stellar MLS as Distributed by MLS Grid
- 2026-03-27 Relisted — Stellar MLS as Distributed by MLS Grid
- 2026-02-20 Pending — Stellar MLS as Distributed by MLS Grid
- 2026-02-12 Price Changed $208,000 Stellar MLS as Distributed by MLS Grid
- 2026-01-12 Price Changed $213,999 Stellar MLS as Distributed by MLS Grid
- 2025-12-20 Listed $219,000 Stellar MLS as Distributed by MLS Grid
Property tax history
+10.6%/yrLatest (2025): $2,314 · +4.1% YoY. Source: county tax records.
Cash-flow waterfall
monthlySold comps — $/sqft
last 12 mo · ≤1 miLoading sold comps…