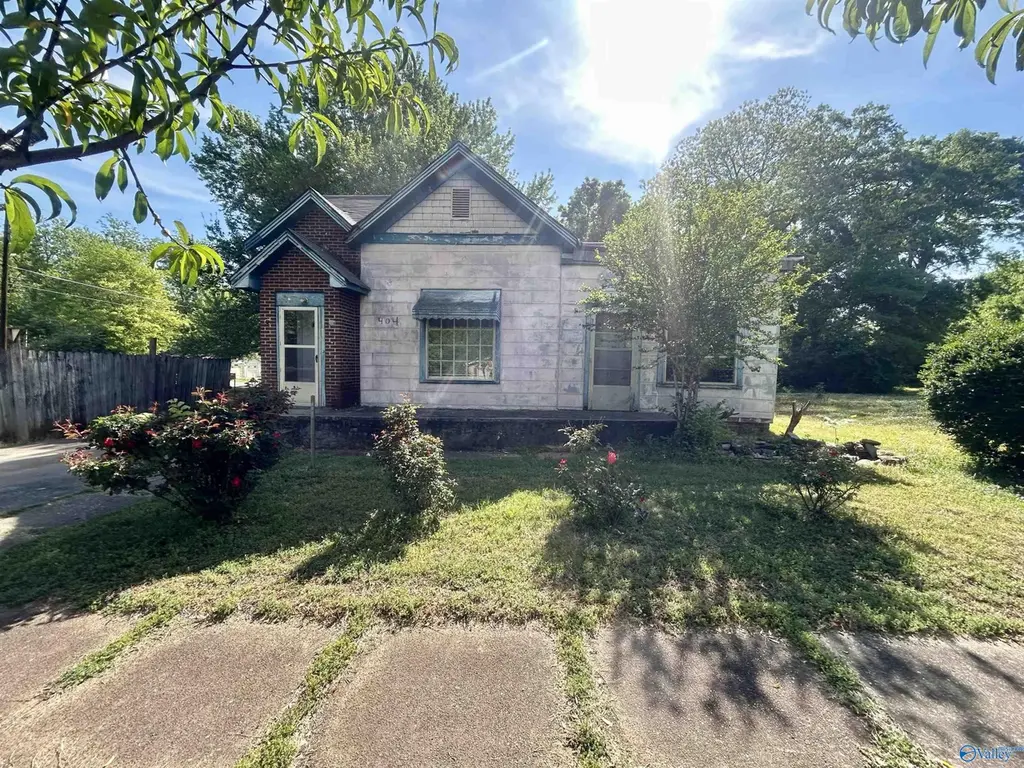
404 7th Ave SW · Decatur, AL
Flood risk 5/10 · Moderate
- FEMA flood zone
- X (unshaded)
- Chance of flooding over 30 yrs
- 0.27%
- Est. flood insurance / yr
- $507 – $1,088
Fire risk 1/10 · Minimal
- Est. fire insurance / yr
- $916 – $1,700
Heat risk 5/10 · Moderate
- Hot days now (above 106°F)
- 7 days/yr
- Hot days in 30 yrs
- 19 days/yr
Wind risk 4/10 · Minor
- Chance of severe wind over 30 yrs
- 22.0%
Air-quality risk 2/10 · Minimal
- Unhealthy air days now
- 1 days/yr
- Unhealthy air days in 30 yrs
- 1 days/yr
Risk factors via First Street. Map © Google.
Why this score? — see what drove the B+ grade
The composite is a weighted blend of 9 inputs, each scored 0–100. Each bar is that input's sub-score; the figure is the points it added to the 100-point composite (weight × sub-score).
- Cash flow +30.0/30.0
- ARV discount +15.0/15.0
- DSCR +10.0/10.0
- 1% rule +9.1/10.0
- Rent growth +3.7/5.0
- Livability +3.6/5.0
- Schools +2.6/10.0
- Condition / age +2.5/5.0
- Appreciation +0.0/10.0
$95,000
🖨 Deal sheet (PDF) 📄 Offer letter ✓ Due diligence
Listing remarks
Opportunity awaits! This 3-bedroom, 2-bath home is perfect for investors or buyers looking to build equity while living in the home. Featuring a huge living room, separate dining room, cozy breakfast nook, and a dedicated laundry space, there’s plenty of room to make it your own. The spacious bedrooms offer comfort, while the layout provides great potential for updates over time. Outside, two outbuildings convey—ideal for storage, a workshop, or future projects. Bring your vision and turn this property into something special! Agent has interest in property.
Key facts
- Cozy breakfast nook
- Separate dining room
- Huge living room
Tags
Property features AI
Finance
- Other: Property type: Single Family Residence; Not new construction
- HOA & community: No homeowners association; Subdivision: Dli&F Co Add 3
Exterior
- Parking: Concrete driveway
- Utilities: Public water; Public sewer; Electric service (implied)
- Home design: Single-family residence, residential property; Built in 1954; Approximately 1,500 square feet living area
- Construction: Factory-built fireplace (1)
- Exterior features: Public water; Public sewer; Lot dimensions approximately 140 x 50; Lot area approximately 0.16 acres
Interior
- Bedrooms: Total rooms: 11
- Bathrooms: 1 full bathroom; 1 three-quarter bathroom
- Heating & cooling: Central heating; Central cooling
- Interior features: Crawl space basement; One factory-built fireplace
Neighborhood map
What this means for you Summary
Snapshot
- This is a 3-bed/1.0-bath single-family listed at $95k.
Deal economics
- At list price, monthly cash flow is $404 ($5k/yr) — positive.
- The deal already cash-flows at list — no discount required.
- Meets the 1% rule at list price ($1k rent vs $95k).
- Recommended offer: $92k (3.0% below list) — sets the bar for market timing.
- Cap rate 11.4% vs local median 4.0% in Decatur — top-decile yield for the area; either an underpriced asset or a hidden risk that comps aren't pricing in. Stress-test before assuming the spread holds.
Location & tenants
- Location reads 72/100 on livability (#28 in AL) — a middle-class / working-renter tenant base. Strengths: cost of living A+, housing A+, health & safety A+; Watch: employment D+, crime F, amenities F.
- Decatur City (urban): math 22% / reading 40% proficiency, ranked #66 of 129 in AL (top 51%) — families likely to look elsewhere, expect single-tenant / working-renter base with shorter leases.
- Zoned schools: West Decatur Elementary School (math 8% / reading 17%, grade F, #536 of 627 statewide, top 88%, 346 students, 89% FRL); Decatur Middle School (math 17% / reading 36%, grade F, #150 of 257 statewide, top 60%, 815 students, 77% FRL); Decatur High School (math 27% / reading 27%, grade F, #90 of 305 statewide, top 35%, 1,040 students, 67% FRL) — zoned schools average 78% FRL vs 57% district-wide (21 pts higher); higher-poverty schools than district average — tighter screening recommended.
- Market conditions: Rents rising fast (+4.7%/yr); 225 active listings in the ZIP; 16 comparable units currently listed for rent nearby; rentals lingering (median 46d on market — plan ~5-8 weeks vacancy on turnover, expect pricing pressure); 62% of comp listings sitting > 30 days — soft ceiling on asking rent; 231 units permitted in Morgan County in 2024 (0 in 5+ unit buildings).
- This rent runs 31% of the median local income ($51k/yr) — at the standard rent-burdened threshold; future hikes will face affordability resistance.
Forward outlook
- Local home prices are declining (-3.0%/yr); year-one equity from $657 of loan paydown is wiped out by about $3k of value loss. Plan a longer hold.
- Morgan County population projected at -11% by 2050 — secular population decline; favor cash flow + early exit over multi-decade hold.
- At projected returns (-3.0% appreciation + 4.7% rent growth), your $27k cash investment doubles in ~6 years — after that, you're playing with house money.
Negotiation context
- It's been on market 52 days — a 3% lower offer ($92k) is reasonable based on typical stale-listing flexibility.
- Current owner paid $11k; list at $95k implies a 772% gain — meaningful room to come down on a strong offer.
Risks & watch-outs
- Watch-outs: built in 1954 — expect roof / HVAC / electrical / plumbing capex.
- Climate carrying-cost: moderate flood risk; extreme-heat days projected 7→19/yr by 2055 (HVAC capex compounding) — expect insurance premiums to compound above CPI over the hold.
Questions for the listing agent
- It's been on market 52 days. Have you received any prior offers? Is the seller open to a 3% concession, seller financing, or rate buy-down credit?
- Built in 1954 — when were the roof, HVAC, electrical panel, plumbing, and water heater last replaced?
- Is there a deadline driving the sale (1031 exchange, divorce, estate, relocation)? That informs how much negotiation room exists.
- Crime grade is F in this area — have there been break-ins, vandalism, or insurance claims at this property in the last 3 years? What carrier currently insures it and at what premium?
- What's the average days-on-market for RENTAL listings here right now (not sales)? A rising rental-DOM trend means longer vacancies and softer asking-rent achievability than the comps imply.
- What's the recent tenant-quality profile in this submarket — average credit score on applications, eviction rate, late-payment / NSF rate, and stable-employment percentage? A property-management company in the area should have these aggregated.
- How much new for-sale + rental construction is in the pipeline within 1–3 miles? Heavy new supply typically softens prices + rents 12–24 months out; constrained supply supports both.
Investment metrics
- 1% rule
- 1.41% ✓
- Cap rate
- 11.40%
- Cash-on-cash
- 18.22%
- DSCR
- 1.81
- GRM
- 5.9
CMA / ARV
- ARV (median comp)
- $131,819
- List price
- $95,000
- Delta
- -27.93%
- Verdict
- UNDERPRICED
- Comps
- 20 within 1.0 mi
Show comp detail 12 sales within ~0.75 mi
| Address | Dist | Beds/Ba | Sqft | Sold | Price | $/sf | Match |
|---|---|---|---|---|---|---|---|
| 207 7th Ave SW | 0.10mi | 3/1.0 | 1,404 (-5%) | 8mo | $120,200 | $86 | 80 |
| 414 5th Ave SW | 0.15mi | 4/1.0 (+1) | 1,546 (+4%) | 10mo | $65,000 | $42 | 72 |
| 609 7th Ave SW | 0.16mi | 4/2.0 (+1) | 1,380 (-7%) | 1mo | $187,000 | $136 | 71 |
| 606 14th Ave | 0.51mi | 3/2.0 | 1,500 (+1%) | 5mo | $50,000 | $33 | 66 |
| 403 Gordon Dr SW | 0.21mi | 2/1.0 (-1) | 1,559 (+5%) | 14mo | $149,900 | $96 | 65 |
| 107 8th Ave NW | 0.22mi | 3/2.0 | 1,344 (-9%) | 8mo | $215,000 | $160 | 64 |
| 310 6th Ave NW | 0.43mi | 3/1.5 | 1,377 (-7%) | 7mo | $164,000 | $119 | 60 |
| 201 10th Ave NW | 0.36mi | 3/1.5 | 1,320 (-11%) | 12mo | $90,000 | $68 | 53 |
| 401 Wildwood Cir SW | 0.43mi | 4/2.5 (+1) | 1,620 (+9%) | 2mo | $179,000 | $110 | 52 |
| 807 SW Price Dr | 0.52mi | 3/2.0 | 1,371 (-8%) | 16mo | $179,900 | $131 | 46 |
| 211 Prospect Dr SE | 0.74mi | 2/1.5 (-1) | 1,330 (-10%) | 3mo | $160,000 | $120 | 39 |
| 302 Canal St NE | 0.72mi | 2/2.0 (-1) | 1,611 (+9%) | 5mo | $240,000 | $149 | 39 |
Match score weights: distance 35% · size 25% · config 20% · recency 20%. Top-matched comps best support the ARV.
Projected returns pro-forma
-3.0% appreciation · 4.67% rent growth · sell at horizon
- IRR
- 11.7%
- Equity multiple
- 1.48×
- Total profit
- $12,645
- Equity at exit
- $14,165
- IRR
- 22.0%
- Equity multiple
- 3.03×
- Total profit
- $53,956
- Equity at exit
- $8,214
Cash invested: $26,600 (down + closing). Projections, not guarantees.
Landlord ↔ Tenant lean methodology
- Overall (STATE)
- 90 Strongly Landlord-Friendly
- State Alabama
- 90 Strongly Landlord-Friendly · R+15
- County
- — inherits STATE
- City
- — inherits STATE
ZIP-level market 35601
- Home prices YoY
- -26.5%
- Rents YoY
- 4.7%
- Active inventory
- 225
- Price-to-rent
- 5.9×
Monthly cashflow live
- Estimated rent
- $1,342 high interval (Pro) →
- Mortgage (P&I)
- −$498
- Tax est. 1.5%
- −$119 /mo · $1,425/yr
- Insurance
- −$40
- HOA
- −$0
- Vacancy / Maint / Mgmt
- −$282
- Net cashflow
- $404
Break-even live
Sensitivity live
| Price | -10% $470 | -5% $437 | +0% $404 | +5% $371 | +10% $338 |
|---|---|---|---|---|---|
| Rent | -10% $298 | -5% $351 | +0% $404 | +5% $457 | +10% $510 |
| Rate | -1.0pp $452 | -0.5pp $428 | base $404 | +0.5pp $379 | +1.0pp $354 |
UW: 25.0% down · 7.5% · 30yr · 1.5% tax · 5.0% vac · 8.0% maint · 8.0% mgmt
Financing live
Cash to close
- Down payment
- $23,750
- Closing costs
- $2,850
- Reserves months
- —
- Total cash needed
- —
Loan-product check · same deal, 3 products live
Conventional
25% down · 7.5% · 30yr
- Down + closing
- —
- Monthly P&I
- —
- Monthly cashflow
- —
- DSCR
- —
- Eligible?
- —
Personal DTI + credit; lowest rate.
DSCR
20% down · 8.5% · 30yr
- Down + closing
- —
- Monthly P&I
- —
- Monthly cashflow
- —
- DSCR
- —
- Eligible?
- —
No personal income docs; deal must DSCR.
Hard money
10% down · 12.0% · 12mo
- Down + closing
- —
- Monthly P&I
- —
- Monthly cashflow
- —
- DSCR
- —
- Eligible?
- —
Short-term bridge; refi at stabilization.
Rent comps 16 comps
| Address | Beds | Baths | Sqft | Rent | $/sqft | DOM | Units | Dist |
|---|---|---|---|---|---|---|---|---|
| 609 7th Ave SW Decatur, AL | 4.0 | 2.0 | 1380 | $1,425 | $1.03 | 45d | 1 | 0.17mi |
| 220 8th Ave NW Decatur, AL | 3.0 | 1.0 | 973 | $1,125 | $1.16 | 45d | 1 | 0.36mi |
| 225 5th Ave NW Decatur, AL | 3.0 | 2.0 | 1496 | $1,300 | $0.87 | 45d | 1 | 0.38mi |
| 315 Hillside Rd SW Decatur, AL | 3.0 | 1.5 | 1344 | $1,400 | $1.04 | 45d | 1 | 0.80mi |
| 14 Walnut St NE Decatur, AL | 3.0 | 2.5 | 1430 | $1,700 | $1.19 | 45d | 1 | 0.90mi |
| 516 Ferry St NE Decatur, AL | 2.0 | 1.0 | 900 | $1,150 | $1.28 | 25d | 1 | 0.90mi |
| 1504 Faye St SW Decatur, AL | 3.0 | 2.0 | 1200 | $1,450 | $1.21 | 45d | 1 | 0.93mi |
| 603 Prospect Dr SE Decatur, AL | 3.0 | 1.0 | 1362 | $1,795 | $1.32 | 45d | 1 | 0.97mi |
| 818 Grant St SE Decatur, AL | 2.0 | 1.0 | 910 | $1,300 | $1.43 | 45d | 1 | 1.09mi |
| 213 Wilson St NE Unit 2 Decatur, AL | 2.0 | 1.0 | 975 | $875 | $0.90 | 25d | 1 | 1.11mi |
| 213 Wilson St NE Unit 4 Decatur, AL | 2.0 | 1.0 | 975 | $700 | $0.72 | 25d | 1 | 1.11mi |
| 604 Alma St NW Decatur, AL | 3.0 | 2.0 | 1350 | $1,325 | $0.98 | 22d | 1 | 1.12mi |
| 1050 Harborview Dr NE Decatur, AL | 1.0–2.0 | 1.0–2.0 | 790 | $1,305 | $1.65 | 15d | 7 | 1.16mi |
| 1018 Grant St SE Unit 1018-4 Decatur, AL | 2.0 | 1.0 | 890 | $775 | $0.87 | 45d | 1 | 1.24mi |
| 1018 Grant St SE Unit 1026-4 Decatur, AL | 2.0 | 1.0 | 890 | $800 | $0.90 | 45d | 1 | 1.24mi |
| 102 Elm Ct NE Decatur, AL | 3.0 | 1.0 | 1216 | $1,450 | $1.19 | 25d | 1 | 1.46mi |
Listing history 14 events
-
2026-06-14days on market $95,000 Active 52 DOM
-
2026-06-13days on market $95,000 Active 51 DOM
-
2026-06-10days on market $95,000 Active 49 DOM
-
2026-06-09days on market $95,000 Active 48 DOM
-
2026-06-08days on market $95,000 Active 47 DOM
-
2026-06-07days on market $95,000 Active 46 DOM
-
2026-06-05days on market $95,000 Active 43 DOM
-
2026-06-03days on market $95,000 Active 42 DOM
-
2026-06-02days on market $95,000 Active 41 DOM
-
2026-06-01days on market $95,000 Active 40 DOM
-
2026-05-31days on market $95,000 Active 39 DOM
-
2026-05-30days on market $95,000 Active 38 DOM
-
2026-04-22$95,000 Active 575-char remark
-
2006-04-07soldstatus $10,900
ⓘ Source: listings_history table (triggers on properties + properties_extension) + one-shot
backfill from property_details.listing_events for pre-trigger history.
Climate risk First Street
- Flood 5/10 Major FEMA zone X (unshaded) · 27% chance over 30 yrs
- Wildfire 1/10 Low
- Heat 5/10 Major 7 d/yr ≥106°F today · 19 d/yr by 30 yrs out
- Wind 4/10 Moderate 22% chance of damaging wind over 30 yrs
- Air quality 2/10 Low 1 unhealthy d/yr today · 1 by 30 yrs out
Nearby sold comps map
Loading sold comps map…
Walkable amenities ~0.75 mi
Loading nearby amenities…
Taxation est. · year 1
- Rental income
- $16,108
- − Mortgage interest
- −$5,321
- − Property taxes
- −$1,425
- − Insurance
- −$475
- − Repairs & maintenance
- −$1,289
- − Management
- −$1,289
- − Depreciation
- −$2,764
- Taxable income
- $3,546
- Est. tax owed @ 24.0%
- −$851
- After-tax cash flow
- $3,996/yr
For passive investors: Depreciation is non-cash, so a rental often shows a tax loss while cash-flowing — sheltering income. Rental losses are passive: they offset passive income freely, and up to $25,000/yr can offset ordinary (W-2) income if you actively participate and your MAGI is under $100k (phasing out to $0 by $150k); unused losses carry forward. On sale, claimed depreciation is recaptured at up to 25%, and gains may owe capital-gains tax (a 1031 exchange can defer both). Figures are a year-1 estimate at your 24.0% rate — not tax advice; consult a CPA.
Schools (NCES district)
- District
- Decatur City
- NCES district ID
- 0101170
- Math proficiency
- 22% ▼ -27.00%
- Reading proficiency
- 40% ▼ -1.00%
- Median HH income
- $42,170
- Composite
- 26.21/100
- National rank
- #7261
- State rank
- #66 of 129 in AL
Livability — Decatur
- Score
- 72/100
- State rank
- #28
- US rank
- #5989
Category grades
Schools grade is shown separately in the Schools card above.
Census & demographics
- Census place
- Decatur, AL
- County
- Morgan County · 67,628 people
- City population
- 67,628
- Metro
- Decatur, AL
- Population (ZIP)
- 35,449
- Household income
- $51,429
- Rent vs Own
- Severe rent burden
- 1386.0
Population outlook (Morgan County) Hauer SSP2
- Today (2025)
- 118,775 people
- By 2030
- 116,979 · -1.5%
- By 2040
- 111,800 · -5.9%
- By 2050
- 105,181 · -11.4%
- By 2075
- 87,736 · -26.1%
- By 2100
- 67,624 · -43.1%
Race, ethnicity, and origin ACS 2023
- Neighborhood character
- Diverse neighborhood (Simpson 0.66)
- Race & ethnicity
- White 47% Hispanic / Latino 24% Black 24% Two or more races 10% Native American 2%
- Hispanic origin (detail)
- Mexican 15% Puerto Rican 2%
- Common ancestry
- Slovak 1% Italian 1% Lithuanian 1%
- Foreign-born
- 10% · Canada
- Languages at home
- 81% English-only · Spanish 18%
Political lean MEDSL · Morgan
- 2024 margin
- Solid R (+52.6) · D 23.2% · R 75.8%
- 2008→2024 swing
- -8.8pp toward R · 2008: -43.8pp · 2024: -52.6pp
- All cycles
- 2024: R+52.6 2020: R+49.2 2016: R+52.4 2012: R+44.5 2008: R+43.8
Not yet ingested
- Civics
- —
Market trends
- HPI YoY
- ▼ -89.26%
- Current HPI
- 247.8437
- Rent YoY
- ▲ 4.67%
- Metro
- Decatur, AL
- State GDP YoY
- ▲ 2.94%
- F500 in state
- 4
Industry mix (Fortune 500 HQ in AL)
| Industry | F500 HQs | Revenue |
|---|---|---|
| Financial Services | 1 | $8B |
|
||
| Healthcare | 1 | $5B |
|
||
Price history
+771.6% since first listed2 events — show timeline
- 2026-04-22 Listed $95,000 VMLS
- 2006-04-07 Sold (Public Records) $10,900 Public Records
Property tax history
+3.8%/yrLatest (2025): $148 · +24.3% YoY. Source: county tax records.
Cash-flow waterfall
monthlySold comps — $/sqft
last 12 mo · ≤1 miLoading sold comps…