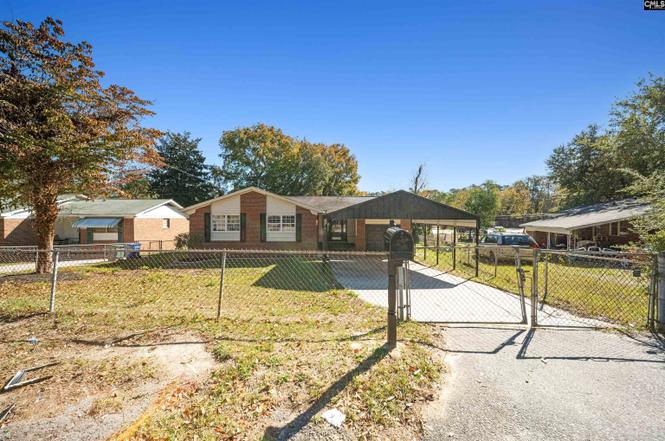
6913 Carmel St · Columbia, SC
Flood risk 1/10 · Minimal
- FEMA flood zone
- X (unshaded)
- Chance of flooding over 30 yrs
- 0.0%
- Est. flood insurance / yr
- $507 – $1,088
Fire risk 3/10 · Minor
- Est. fire insurance / yr
- $783 – $1,453
Heat risk 6/10 · Moderate
- Hot days now (above 108°F)
- 7 days/yr
- Hot days in 30 yrs
- 16 days/yr
Wind risk 6/10 · Moderate
- Chance of severe wind over 30 yrs
- 64.0%
Air-quality risk 3/10 · Minor
- Unhealthy air days now
- 2 days/yr
- Unhealthy air days in 30 yrs
- 2 days/yr
Risk factors via First Street. Map © Google.
Why this score? — see what drove the C- grade
The composite is a weighted blend of 9 inputs, each scored 0–100. Each bar is that input's sub-score; the figure is the points it added to the 100-point composite (weight × sub-score).
- Cash flow +20.6/30.0
- ARV discount +7.5/15.0
- DSCR +6.5/10.0
- 1% rule +4.1/10.0
- Livability +3.9/5.0
- Rent growth +3.1/5.0
- Schools +2.6/10.0
- Condition / age +2.5/5.0
- Appreciation +0.0/10.0
$164,500
🖨 Deal sheet 📄 Offer letter ✓ Due diligence
Listing remarks
This home has a brand-new roof installed in April 2026!!! Looking for an affordable, all-brick home with plenty of space? Look no further! In an already established community that's conveniently located near I-20, 6913 Carmel Street is the perfect place to call home! This super cute 3 Bedroom, 1.5 Bathroom home packs a mighty punch! In the front of the home, you'll be greeted by an oversized carport in front of the garage! It has an inviting, spacious living room and a spacious eat-in kitchen. The kitchen has been updated with new vinyl flooring, a large stainless steel double-bowl sink, beautiful countertops, and newly painted cabinets with new hardware. Before making this your home, this
Key facts
- Oversized carport
- All brick home
- Updated kitchen
Tags
Property features AI
Exterior
- Parking: Attached garage with 1 garage space
- Utilities: Public sewer; Public water
- Home design: Single-family property (detached)
- Construction: Crawlspace foundation
- Exterior features: Brick exterior on all sides above foundation; Paved road access; Public water
Interior
- Bedrooms: Master bedroom on the main level
- Bathrooms: One full bathroom and one half bathroom
- Heating & cooling: Central heating; Central cooling
- Interior features: Central heating and central air conditioning
Neighborhood map
What this means for you Summary
Snapshot
- This is a 3-bed/2.0-bath single-family listed at $164k.
Deal economics
- At list price, monthly cash flow is $219 ($3k/yr) — positive.
- The deal already cash-flows at list — no discount required.
- To meet the 1% rule (rent ≥ 1% of price), the offer needs to be $149k (9.2% below list).
- Recommended offer: $145k (12.0% below list) — sets the bar for market timing.
- Cap rate 7.9% vs local median 5.0% in Columbia — top-decile yield for the area; either an underpriced asset or a hidden risk that comps aren't pricing in. Stress-test before assuming the spread holds.
Location & tenants
- Location reads 78/100 on livability (#18 in SC, #2,436 nationally) — a middle-class / working-renter tenant base. Strengths: amenities A+, commute A+, cost of living A+; Watch: employment D, crime F.
- Richland 01 (urban): math 26% / reading 36% proficiency, ranked #54 of 80 in SC (top 68%) — families likely to look elsewhere, expect single-tenant / working-renter base with shorter leases; 64% free/reduced lunch — lower-income household profile, screen leases tightly.
- Zoned schools: A. J. Lewis Greenview Elementary (math 12% / reading 17%, grade F, #553 of 597 statewide, top 95%, 375 students, 100% FRL); W.J. Keenan High (math 54% / reading 77%, grade B, #83 of 196 statewide, top 43%, 725 students, 100% FRL) — zoned schools average 100% FRL vs 64% district-wide (36 pts higher); higher-poverty schools than district average — tighter screening recommended.
- Market conditions: Rents rising (+2.5%/yr); 238 active listings in the ZIP; 6 comparable units currently listed for rent nearby; rentals at typical pace (median 23d on market — plan ~3-4 weeks tenant-placement turnaround); 3,472 units permitted in Richland County in 2024 (1,096 in 5+ unit buildings).
- This rent runs 39% of the median local income ($46k/yr) — at the standard rent-burdened threshold; future hikes will face affordability resistance.
Forward outlook
- Local home prices are declining (-3.0%/yr); year-one equity from $1k of loan paydown is wiped out by about $5k of value loss. Plan a longer hold.
- Richland County population projected at +30% by 2050 — long-run rental-demand tailwind backs the buy-and-hold thesis.
Negotiation context
- It's been on market 166 days — a 12% lower offer ($145k) is reasonable based on typical stale-listing flexibility.
- 5 sale attempts since 3y ago; this cycle's ask has dropped $20k (11%) from the opening price — seller is motivated, your offer sets the floor, not the list.
- Current owner paid $82k; list at $164k implies a 102% gain — meaningful room to come down on a strong offer.
Risks & watch-outs
- Climate carrying-cost: major wind risk, 64% chance of damaging wind over 30y; extreme-heat days projected 7→16/yr by 2055 (HVAC capex compounding) — expect insurance premiums to compound above CPI over the hold.
Questions for the listing agent
- It's been on market 166 days. Have you received any prior offers? Is the seller open to a 12% concession, seller financing, or rate buy-down credit?
- Built in 1967 — when were the roof, HVAC, electrical panel, plumbing, and water heater last replaced?
- Why hasn't it sold? Are there any deal-killer items the seller is aware of (foundation, flood, title, zoning, code violations)?
- Is there a deadline driving the sale (1031 exchange, divorce, estate, relocation)? That informs how much negotiation room exists.
- Schools are D-rated, which usually means shorter tenancies and higher turnover. Who's the typical renter profile here, and what's been the actual vacancy rate?
- Crime grade is F in this area — have there been break-ins, vandalism, or insurance claims at this property in the last 3 years? What carrier currently insures it and at what premium?
- What's the average days-on-market for RENTAL listings here right now (not sales)? A rising rental-DOM trend means longer vacancies and softer asking-rent achievability than the comps imply.
- What's the recent tenant-quality profile in this submarket — average credit score on applications, eviction rate, late-payment / NSF rate, and stable-employment percentage? A property-management company in the area should have these aggregated.
- How much new for-sale + rental construction is in the pipeline within 1–3 miles? Heavy new supply typically softens prices + rents 12–24 months out; constrained supply supports both.
Investment metrics
- 1% rule
- 0.91% ✗
- Cap rate
- 7.89%
- Cash-on-cash
- 5.72%
- DSCR
- 1.25
- GRM
- 9.2
CMA / ARV
No comps found within radius.
Projected returns pro-forma
-3.0% appreciation · 2.5% rent growth · sell at horizon
- IRR
- -8.0%
- Equity multiple
- 0.71×
- Total profit
- $-13,516
- Equity at exit
- $24,527
- IRR
- 0.9%
- Equity multiple
- 1.06×
- Total profit
- $2,837
- Equity at exit
- $14,223
Cash invested: $46,060 (down + closing). Projections, not guarantees.
Landlord ↔ Tenant lean methodology
- Overall (STATE)
- 90 Strongly Landlord-Friendly
- State South Carolina
- 90 Strongly Landlord-Friendly · R+6
- County
- — inherits STATE
- City
- — inherits STATE
ZIP-level market 29203
- Home prices YoY
- -31.6%
- Rents YoY
- 2.5%
- Active inventory
- 238
- Price-to-rent
- 9.2×
Monthly cashflow live
- Estimated rent
- $1,494 high interval (Pro) →
- Mortgage (P&I)
- −$863
- Tax from tax record
- −$30 /mo · $358/yr
- Insurance
- −$69
- HOA
- −$0
- Vacancy / Maint / Mgmt
- −$314
- Net cashflow
- $219
Break-even live
UW: 25.0% down · 7.5% · 30yr · 1.5% tax · 5.0% vac · 8.0% maint · 8.0% mgmt
Financing live
Cash to close
- Down payment
- $41,125
- Closing costs
- $4,935
- Reserves months
- —
- Total cash needed
- —
Loan-product check · same deal, 3 products live
Conventional
25% down · 7.5% · 30yr
- Down + closing
- —
- Monthly P&I
- —
- Monthly cashflow
- —
- DSCR
- —
- Eligible?
- —
Personal DTI + credit; lowest rate.
DSCR
20% down · 8.5% · 30yr
- Down + closing
- —
- Monthly P&I
- —
- Monthly cashflow
- —
- DSCR
- —
- Eligible?
- —
No personal income docs; deal must DSCR.
Hard money
10% down · 12.0% · 12mo
- Down + closing
- —
- Monthly P&I
- —
- Monthly cashflow
- —
- DSCR
- —
- Eligible?
- —
Short-term bridge; refi at stabilization.
Rent comps 6 comps
| Address | Beds | Baths | Sqft | Rent | $/sqft | DOM | Units | Dist |
|---|---|---|---|---|---|---|---|---|
| 201 Redwood Ct Columbia, SC | 3.0 | 1.5 | 1050 | $1,300 | $1.24 | 14d | 1 | 0.33mi |
| 320 Charwood Dr Columbia, SC | 3.0 | 2.0 | 1325 | $1,750 | $1.32 | 23d | 1 | 0.65mi |
| 5867 Ames Rd Columbia, SC | 3.0 | 1.0 | 802 | $1,200 | $1.50 | 14d | 1 | 1.26mi |
| 5437 Ransom Dr Columbia, SC | 3.0 | 1.0 | 1056 | $1,531 | $1.45 | 23d | 1 | 1.26mi |
| 1931 Chaney St Columbia, SC | 2.0 | 1.0 | 1034 | $1,600 | $1.55 | 23d | 1 | 1.39mi |
| 250 Springtree Dr Columbia, SC | 1.0–2.0 | 1.0 | 839 | $1,090 | $1.30 | 3d | 8 | 1.40mi |
Listing history 27 events
-
2026-06-18days on market $164,500 Active 166 DOM
-
2026-06-17days on market $164,500 Active 165 DOM
-
2026-06-16days on market $164,500 Active 164 DOM
-
2026-06-15days on market $164,500 Active 163 DOM
-
2026-06-14pricedays on market $164,500 Active 161 DOM
-
2026-06-10days on market $169,500 Active 158 DOM
-
2026-06-09days on market $169,500 Active 157 DOM
-
2026-06-08days on market $169,500 Active 156 DOM
-
2026-06-07days on market $169,500 Active 155 DOM
-
2026-06-03days on market $169,500 Active 151 DOM
-
2026-06-03days on market $169,500 Active 150 DOM
-
2026-06-01days on market $169,500 Active 149 DOM
-
2026-05-31days on market $169,500 Active 148 DOM
-
2026-05-01price $169,500
-
2026-05-01status Active
-
2026-03-04status Pending
-
2026-03-02price $164,900
-
2026-03-01status Active
-
2026-03-01historical
-
2026-02-20price $169,900
-
2026-01-26price $174,900
-
2025-11-29price $179,900
-
2025-11-05$185,000 Active
-
2025-08-05soldstatus $81,500
-
2025-06-03status Pending
-
2025-05-30$86,000 Active
-
2023-04-07$86,000 Active
ⓘ Source: listings_history table (triggers on properties + properties_extension) + one-shot
backfill from property_details.listing_events for pre-trigger history.
Tax reassessment forecast SC · Resets to sale price
- Current annual tax
- $358 · $30/mo
- Projected year-2 tax
- $938 · $78/mo
- Expected delta
- +$580/yr (+$48/mo · 161.9%)
ⓘ Screening estimate from a state-policy table — verify with the county assessor before closing.
Climate risk First Street
- Flood 1/10 Low FEMA zone X (unshaded) · 0% chance over 30 yrs
- Wildfire 3/10 Moderate
- Heat 6/10 Major 7 d/yr ≥108°F today · 16 d/yr by 30 yrs out
- Wind 6/10 Major 64% chance of damaging wind over 30 yrs
- Air quality 3/10 Moderate 2 unhealthy d/yr today · 2 by 30 yrs out
Nearby sold comps map
Loading sold comps map…
Walkable amenities ~0.75 mi
Loading nearby amenities…
Taxation est. · year 1
- Rental income
- $17,931
- − Mortgage interest
- −$9,215
- − Property taxes
- −$358
- − Insurance
- −$822
- − Repairs & maintenance
- −$1,434
- − Management
- −$1,434
- − Depreciation
- −$4,785
- Taxable loss
- −$119
- Est. tax savings @ 24.0%
- +$29
- After-tax cash flow
- $2,661/yr
For passive investors: Depreciation is non-cash, so a rental often shows a tax loss while cash-flowing — sheltering income. Rental losses are passive: they offset passive income freely, and up to $25,000/yr can offset ordinary (W-2) income if you actively participate and your MAGI is under $100k (phasing out to $0 by $150k); unused losses carry forward. On sale, claimed depreciation is recaptured at up to 25%, and gains may owe capital-gains tax (a 1031 exchange can defer both). Figures are a year-1 estimate at your 24.0% rate — not tax advice; consult a CPA.
Schools (NCES district)
- District
- Richland 01
- NCES district ID
- 4503360
- Math proficiency
- 26% ▼ -7.00%
- Reading proficiency
- 36% ▼ -5.00%
- Median HH income
- $38,931
- Composite
- 25.94/100
- National rank
- #7335
- State rank
- #54 of 80 in SC
Livability — Columbia
- Score
- 78/100
- State rank
- #18
- US rank
- #2436
Category grades
Schools grade is shown separately in the Schools card above.
Census & demographics
- Census place
- Columbia, SC
- County
- Richland County · 389,530 people
- City population
- 335,994
- Metro
- Columbia, SC
- Population (ZIP)
- 40,653
- Household income
- $46,054
- Rent vs Own
- Severe rent burden
- 1980.0
Population outlook (Richland County) Hauer SSP2
- Today (2025)
- 459,667 people
- By 2030
- 487,524 · +6.1%
- By 2040
- 542,035 · +17.9%
- By 2050
- 595,371 · +29.5%
- By 2075
- 732,998 · +59.5%
- By 2100
- 820,415 · +78.5%
Race, ethnicity, and origin ACS 2023
- Neighborhood character
- Predominantly Black (80%)
- Race & ethnicity
- Black 80% White 13% Hispanic / Latino 5% Two or more races 2%
- Common ancestry
- Serbian 1%
- Foreign-born
- 3% · Canada
- Languages at home
- 93% English-only · Spanish 5%
Political lean MEDSL · Richland
- 2024 margin
- Solid D (+34.6) · D 66.4% · R 31.8% · Other 1.8%
- 2008→2024 swing
- +5.7pp toward D · 2008: 28.9pp · 2024: 34.6pp
- All cycles
- 2024: D+34.6 2020: D+38.3 2016: D+32.9 2012: D+33.3 2008: D+28.9
Not yet ingested
- Civics
- —
Market trends
- HPI YoY
- ▼ -77.52%
- Current HPI
- 168.2114
- Rent YoY
- ▲ 2.50%
- Metro
- Columbia, SC
- State GDP YoY
- ▲ 4.51%
- F500 in state
- 2
Industry mix (Fortune 500 HQ in SC)
| Industry | F500 HQs | Revenue |
|---|---|---|
| Packaging | 1 | $7B |
|
||
Price history
+97.1% since first listed14 events — show timeline
- 2026-05-01 Price Changed $169,500 Consolidated MLS
- 2026-05-01 Relisted — Consolidated MLS
- 2026-03-04 Pending — Consolidated MLS
- 2026-03-02 Price Changed $164,900 Consolidated MLS
- 2026-03-01 Relisted — Consolidated MLS
- 2026-03-01 Delisted — Consolidated MLS
- 2026-02-20 Price Changed $169,900 Consolidated MLS
- 2026-01-26 Price Changed $174,900 Consolidated MLS
- 2025-11-29 Price Changed $179,900 Consolidated MLS
- 2025-11-05 Listed $185,000 Consolidated MLS
- 2025-08-05 Sold (Public Records) $81,500 Public Records
- 2025-06-03 Pending — Consolidated MLS
- 2025-05-30 Listed $86,000 Consolidated MLS
- 2023-04-07 Listed $86,000 Consolidated MLS
Property tax history
+14.4%/yrLatest (2025): $358 · +3.8% YoY. Source: county tax records.
Cash-flow waterfall
monthlySold comps — $/sqft
last 12 mo · ≤1 miLoading sold comps…