 🌊 Lakefront
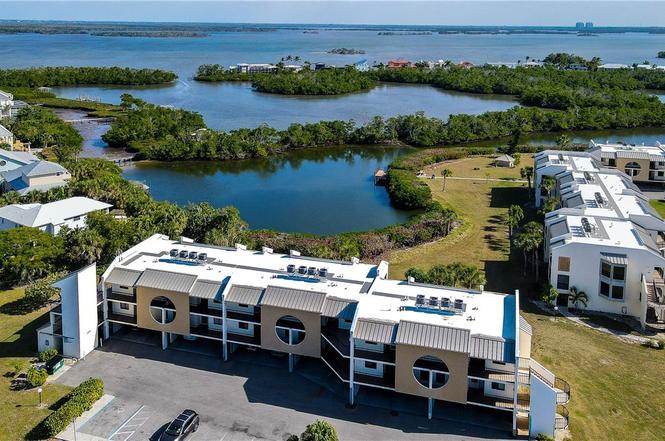
21490 Bay Village Dr #264 · Fort Myers Beach, FL
Flood risk 9/10 · Severe
- FEMA flood zone
- AE
- Chance of flooding over 30 yrs
- 0.99%
- Est. flood insurance / yr
- $1,737 – $8,500
Fire risk 1/10 · Minimal
- Est. fire insurance / yr
- $947 – $1,759
Heat risk 9/10 · Severe
- Hot days now (above 107°F)
- 7 days/yr
- Hot days in 30 yrs
- 28 days/yr
Wind risk 10/10 · Severe
- Chance of severe wind over 30 yrs
- 99.0%
Air-quality risk 3/10 · Minor
- Unhealthy air days now
- 2 days/yr
- Unhealthy air days in 30 yrs
- 2 days/yr
Risk factors via First Street. Map © Google.
Why this score? — see what drove the C+ grade
The composite is a weighted blend of 9 inputs, each scored 0–100. Each bar is that input's sub-score; the figure is the points it added to the 100-point composite (weight × sub-score).
- Cash flow +25.8/30.0
- 1% rule +10.0/10.0
- DSCR +8.7/10.0
- ARV discount +7.5/15.0
- Schools +4.1/10.0
- Livability +3.5/5.0
- Rent growth +2.5/5.0
- Condition / age +2.5/5.0
- Appreciation +0.0/10.0
$229,900
🖨 Deal sheet (PDF) 📄 Offer letter ✓ Due diligence
Listing remarks
PRICE REDUCTION!!!. .. .Live the Fort Myers Beach Lifestyle at Bay Village Condos, a charming waterfront community ideally located on Fort Myers Beach. This 2-bedroom, 2-bath condo offers 881 square feet of comfortable living space and is situated on the top floor of a low-rise, elevator-accessible building, providing added privacy and peaceful surroundings. Offered TURNKEY, this condo is ready for immediate enjoyment. Approximately two years ago, the unit received several significant updates, including a roof, HVAC system, kitchen cabinets, kitchen Corian countertops, drywall, flooring, some electrical, ceiling fans, a tray ceiling in the kitchen, and an undercounter kitchen sink. The micr
Key facts
- Kitchen cabinets
- Elevator accessible
- Top floor
Tags
Property features AI
Finance
- Financial info: Pets not allowed
- HOA & community: Homeowners association with quarterly fee; Association fee covers insurance, legal/accounting, grounds maintenance, pest control, road maintenance, sewer, street lights, trash and water; Community amenities include beach rights, beach access, pier, bocce, pickleball, pickleball/tennis courts, pool, barbecue/picnic area, sidewalks, trails, storage and management; Community has 108 units; Elevator in community; Street lights in community
Exterior
- Parking: Assigned underground parking; Guest parking; One assigned space
- Security: Smoke detectors
- Utilities: Public water; Public sewer
- Home design: Single-story; Entry level: 3; Faces west; Has a view; Resale property
- Construction: Built with insulated concrete forms and stucco; Built-up and flat roof; Pillar/post/pier foundation
- Exterior features: Outdoor grill; Storage; Tennis courts (community); Water feature; Balcony (screened); Gazebo; Community pool; Pond on lot; Is waterfront with basin, bay front, canal access, intersecting canal and mangrove
Interior
- Kitchen: Electric cooktop; Range; Self-cleaning oven; Microwave; Dishwasher; Disposal; Refrigerator; Freezer
- Bedrooms: Primary bedroom on the main level
- Flooring: Tile; Vinyl
- Bathrooms: 2 full bathrooms
- Heating & cooling: Central heating (electric); Central air conditioning (electric); Ceiling fans
- Interior features: Breakfast bar; Built-in features; Tray ceilings; Kitchen island; Living/dining room; Main-level primary bedroom; Shower only in at least one bathroom; Separate shower; Window treatments; High-speed internet; Split bedroom floorplan; Impact glass windows; Single-hung windows; Window coverings; Furnished
- Laundry & utility: Washer hookup; Dryer hookup; Washer included; Dryer included; Laundry area inside
Neighborhood map
What this means for you Summary
Snapshot
- This is a 2-bed/2.0-bath condo listed at $230k.
Deal economics
- At list price, monthly cash flow is $135 ($2k/yr) — positive.
- The deal already cash-flows at list — no discount required.
- Meets the 1% rule at list price ($4k rent vs $230k).
- Recommended offer: $202k (12.0% below list) — sets the bar for market timing.
- Cap rate 9.2% vs local median 0.3% in Fort Myers Beach — top-decile yield for the area; either an underpriced asset or a hidden risk that comps aren't pricing in. Stress-test before assuming the spread holds.
Location & tenants
- Location reads 69/100 on livability (#489 in FL) — a middle-class / working-renter tenant base. Strengths: crime A+, employment A+, schools A-; Watch: amenities F, commute F, cost of living F.
- Lee (suburban): math 47% / reading 50% proficiency, ranked #42 of 73 in FL (top 58%) — families likely to look elsewhere, expect single-tenant / working-renter base with shorter leases.
- Market conditions: 876 active listings in the ZIP; 8 comparable units currently listed for rent nearby; rentals at typical pace (median 24d on market — plan ~3-4 weeks tenant-placement turnaround); solid renter incomes; 15,411 units permitted in Lee County in 2024 (4,686 in 5+ unit buildings).
- At $3,802/mo this rent would consume 58% of the median local household income ($79k/yr) (locally 145% of renters already pay >50% of income on rent) — very limited rent-growth headroom before tenants either downsize or default.
Forward outlook
- Local home prices are declining (-3.0%/yr); year-one equity from $2k of loan paydown is wiped out by about $7k of value loss. Plan a longer hold.
- Lee County population projected at +44% by 2050 — long-run rental-demand tailwind backs the buy-and-hold thesis.
Negotiation context
- It's been on market 134 days — a 12% lower offer ($202k) is reasonable based on typical stale-listing flexibility.
- 3 sale attempts; this cycle's ask has dropped $59k (20%) from the opening price — seller is motivated, your offer sets the floor, not the list.
- Current owner paid $79k; list at $230k implies a 191% gain — meaningful room to come down on a strong offer.
Risks & watch-outs
- Watch-outs: flood insurance adds $427/mo; HOA is 23% of rent.
- Climate carrying-cost: in FEMA flood zone AE (mandatory federal flood insurance); severe wind risk, 99% chance of damaging wind over 30y; extreme-heat days projected 7→28/yr by 2055 (HVAC capex compounding) — expect insurance premiums to compound above CPI over the hold.
Questions for the listing agent
- It's been on market 134 days. Have you received any prior offers? Is the seller open to a 12% concession, seller financing, or rate buy-down credit?
- What's the actual annual flood-insurance premium (NFIP or private), and is the property in a SFHA with mandatory coverage?
- What does the HOA fee cover, when was the last increase, and are there any pending special assessments or reserve-fund shortfalls?
- Any open or pending special assessments — roof, HVAC, plumbing, elevator, façade? What's the per-unit balance and payoff schedule, and is the seller paying it off at close or rolling it to the buyer?
- Why hasn't it sold? Are there any deal-killer items the seller is aware of (foundation, flood, title, zoning, code violations)?
- Is there a deadline driving the sale (1031 exchange, divorce, estate, relocation)? That informs how much negotiation room exists.
- Schools are A-rated — typically a magnet for longer-tenancy family renters. What's the average tenant stay here, and is there a school-zone premium baked into asking?
- This sits on a lake — are riparian / water-frontage rights deeded with the parcel? Any dock permits, shoreline easements, or HOA water-use restrictions?
- What's the documented flood / surge / shoreline-erosion history here (FEMA AND non-FEMA — e.g., storm surge, creek backup, septic-field saturation)?
- Any water-quality or seasonal algae-bloom issues that affect tenant satisfaction or short-term-rental demand?
- What's the average days-on-market for RENTAL listings here right now (not sales)? A rising rental-DOM trend means longer vacancies and softer asking-rent achievability than the comps imply.
- What's the recent tenant-quality profile in this submarket — average credit score on applications, eviction rate, late-payment / NSF rate, and stable-employment percentage? A property-management company in the area should have these aggregated.
- How much new apartment / multifamily construction is in the pipeline within 1–3 miles? Heavy new supply (>2% of stock underway) typically softens rents 12–24 months out; light construction supports rent growth.
Investment metrics
- 1% rule
- 1.65% ✓
- Cap rate
- 9.22%
- Cash-on-cash
- 10.46%
- DSCR
- 1.47
- GRM
- 5.0
CMA / ARV
No comps found within radius.
Projected returns pro-forma
-3.0% appreciation · 3.0% rent growth · sell at horizon
- IRR
- -11.9%
- Equity multiple
- 0.57×
- Total profit
- $-27,837
- Equity at exit
- $34,279
- IRR
- -2.2%
- Equity multiple
- 0.85×
- Total profit
- $-9,771
- Equity at exit
- $19,878
Cash invested: $64,372 (down + closing). Projections, not guarantees.
Landlord ↔ Tenant lean methodology
- Overall (STATE)
- 87 Strongly Landlord-Friendly
- State Florida
- 87 Strongly Landlord-Friendly · R+3
- County
- — inherits STATE
- City
- — inherits STATE
ZIP-level market 33931
- Home prices YoY
- -18.8%
- Active inventory
- 876
- Price-to-rent
- 5.0×
Monthly cashflow live
- Estimated rent
- $3,802 high interval (Pro) →
- Mortgage (P&I)
- −$1,206
- Tax from tax record
- −$274 /mo · $3,292/yr
- Insurance
- −$96
- Flood insurance flood zone
- −$427 /mo · $5,118/yr
- HOA
- −$867
- Vacancy / Maint / Mgmt
- −$798
- Net cashflow
- $135
Break-even live
Sensitivity live
| Price | -10% $265 | -5% $200 | +0% $135 | +5% $70 | +10% $4 |
|---|---|---|---|---|---|
| Rent | -10% $-166 | -5% $-16 | +0% $135 | +5% $285 | +10% $435 |
| Rate | -1.0pp $250 | -0.5pp $193 | base $135 | +0.5pp $75 | +1.0pp $14 |
UW: 25.0% down · 7.5% · 30yr · 1.5% tax · 5.0% vac · 8.0% maint · 8.0% mgmt
Financing live
Cash to close
- Down payment
- $57,475
- Closing costs
- $6,897
- Reserves months
- —
- Total cash needed
- —
Loan-product check · same deal, 3 products live
Conventional
25% down · 7.5% · 30yr
- Down + closing
- —
- Monthly P&I
- —
- Monthly cashflow
- —
- DSCR
- —
- Eligible?
- —
Personal DTI + credit; lowest rate.
DSCR
20% down · 8.5% · 30yr
- Down + closing
- —
- Monthly P&I
- —
- Monthly cashflow
- —
- DSCR
- —
- Eligible?
- —
No personal income docs; deal must DSCR.
Hard money
10% down · 12.0% · 12mo
- Down + closing
- —
- Monthly P&I
- —
- Monthly cashflow
- —
- DSCR
- —
- Eligible?
- —
Short-term bridge; refi at stabilization.
Rent comps 8 comps
| Address | Beds | Baths | Sqft | Rent | $/sqft | DOM | Units | Dist |
|---|---|---|---|---|---|---|---|---|
| 427 Lazy Way Unit 1 Fort Myers Beach, FL | 3.0 | 1.0 | 1000 | $2,100 | $2.10 | 24d | 1 | 0.35mi |
| 4811 Coquina Rd Fort Myers Beach, FL | 2.0 | 2.0 | 1083 | $3,800 | $3.51 | 24d | 1 | 0.86mi |
| 6897 Estero Blvd #125 Fort Myers Beach, FL | 2.0 | 2.0 | 778 | $4,500 | $5.78 | 24d | 1 | 1.01mi |
| 22652 Island Pines Way #155 Fort Myers Beach, FL | 2.0 | 2.0 | 811 | $3,800 | $4.69 | 24d | 1 | 1.05mi |
| 6891 Estero Blvd #331 Fort Myers Beach, FL | 2.0 | 2.0 | 832 | $4,500 | $5.41 | 24d | 1 | 1.08mi |
| 7390 Estero Blvd Unit 203b Fort Myers Beach, FL | 1.0 | 1.0 | 600 | $3,200 | $5.33 | 16d | 1 | 1.38mi |
| 4421 Bay Beach Ln #643 Fort Myers Beach, FL | 2.0 | 2.0 | 1040 | $4,500 | $4.33 | 24d | 1 | 1.41mi |
| 7400 Estero Blvd Fort Myers Beach, FL | 2.0 | 2.0 | 930 | $8,042 | $8.65 | 12d | 2 | 1.43mi |
HOA detail condo
- Monthly dues
- $867 · $10,404/yr
- Likely covers
- waterelectric
- Assessments
- None detected in remarks — confirm with the listing agent.
Listing history 11 events
-
2026-05-14status Pending
-
2026-05-11status Active
-
2026-05-06status Pending
-
2026-04-28price $229,900
-
2026-04-24status Active
-
2026-04-23historical
-
2026-04-03price $259,000
-
2026-01-15price $269,000
-
2025-12-18$289,000 Active
-
1990-01-22soldstatus $79,000
-
1983-12-01soldstatus $81,900
ⓘ Source: listings_history table (triggers on properties + properties_extension) + one-shot
backfill from property_details.listing_events for pre-trigger history.
Tax reassessment forecast FL · Resets to sale price
- Current annual tax
- $3,292 · $274/mo
- Projected year-2 tax
- $3,292 · $274/mo
- Expected delta
- $0/yr ($0/mo · 0.0%)
ⓘ Screening estimate from a state-policy table — verify with the county assessor before closing.
Climate risk First Street
- Flood 9/10 Extreme FEMA zone AE · 99% chance over 30 yrs
- Wildfire 1/10 Low
- Heat 9/10 Extreme 7 d/yr ≥107°F today · 28 d/yr by 30 yrs out
- Wind 10/10 Extreme 99% chance of damaging wind over 30 yrs
- Air quality 3/10 Moderate 2 unhealthy d/yr today · 2 by 30 yrs out
Nearby sold comps map
Loading sold comps map…
Walkable amenities ~0.75 mi
Loading nearby amenities…
Taxation est. · year 1
- Rental income
- $45,629
- − Mortgage interest
- −$12,878
- − Property taxes
- −$3,292
- − Insurance
- −$6,268
- − Repairs & maintenance
- −$3,650
- − Management
- −$3,650
- − HOA
- −$10,404
- − Depreciation
- −$6,688
- Taxable loss
- −$1,202
- Est. tax savings @ 24.0%
- +$288
- After-tax cash flow
- $1,904/yr
For passive investors: Depreciation is non-cash, so a rental often shows a tax loss while cash-flowing — sheltering income. Rental losses are passive: they offset passive income freely, and up to $25,000/yr can offset ordinary (W-2) income if you actively participate and your MAGI is under $100k (phasing out to $0 by $150k); unused losses carry forward. On sale, claimed depreciation is recaptured at up to 25%, and gains may owe capital-gains tax (a 1031 exchange can defer both). Figures are a year-1 estimate at your 24.0% rate — not tax advice; consult a CPA.
Schools (NCES district)
- District
- Lee
- NCES district ID
- 1201080
- Math proficiency
- 47% ▼ -11.00%
- Reading proficiency
- 50% ▼ -4.00%
- Median HH income
- $49,518
- Composite
- 41.49/100
- National rank
- #3458
- State rank
- #42 of 73 in FL
Livability — Fort Myers Beach
- Score
- 69/100
- State rank
- #489
- US rank
- #8995
Category grades
Schools grade is shown separately in the Schools card above.
Census & demographics
- Census place
- Fort Myers Beach, FL
- County
- Lee County · 788,662 people
- Metro
- Cape Coral-Fort Myers, FL
- Population (ZIP)
- 8,350
- Household income
- $79,018
- Rent vs Own
- Severe rent burden
- 145.0
Population outlook (Lee County) Hauer SSP2
- Today (2025)
- 871,946 people
- By 2030
- 955,468 · +9.6%
- By 2040
- 1,113,587 · +27.7%
- By 2050
- 1,256,891 · +44.1%
- By 2075
- 1,560,270 · +78.9%
- By 2100
- 1,726,848 · +98.0%
Race, ethnicity, and origin ACS 2023
- Neighborhood character
- Predominantly White (94%)
- Race & ethnicity
- White 94% Hispanic / Latino 4% Two or more races 4%
- Common ancestry
- Romanian 5% Portuguese 3% Lithuanian 3%
- Foreign-born
- 5% · Canada
- Languages at home
- 94% English-only · Spanish 2% German/W. Germanic 1% French/Haitian/Cajun 1%
Political lean MEDSL · Lee
- 2024 margin
- Strong R (+28.4) · D 35.5% · R 63.9%
- 2008→2024 swing
- -18.0pp toward R · 2008: -10.4pp · 2024: -28.4pp
- All cycles
- 2024: R+28.4 2020: R+19.2 2016: R+20.4 2012: R+16.6 2008: R+10.4
Not yet ingested
- Civics
- —
Market trends
- HPI YoY
- ▼ -194.12%
- Current HPI
- 837.37
- Rent YoY
- —
- Metro
- Cape Coral-Fort Myers, FL
- State GDP YoY
- ▲ 3.28%
- F500 in state
- 36
Industry mix (Fortune 500 HQ in FL)
| Industry | F500 HQs | Revenue |
|---|---|---|
| Industrial Technology | 2 | $29B |
|
||
| Insurance | 2 | $17B |
|
||
| Retail | 1 | $60B |
|
||
| Technology Distribution | 1 | $58B |
|
||
| Homebuilding | 1 | $35B |
|
||
| Technology Manufacturing | 1 | $35B |
|
||
Price history
+180.7% since first listed11 events — show timeline
- 2026-05-14 Pending — FORTMLS
- 2026-05-11 Relisted — FORTMLS
- 2026-05-06 Pending — FORTMLS
- 2026-04-28 Price Changed $229,900 FORTMLS
- 2026-04-24 Relisted — FORTMLS
- 2026-04-23 Listing Removed — FORTMLS
- 2026-04-03 Price Changed $259,000 FORTMLS
- 2026-01-15 Price Changed $269,000 FORTMLS
- 2025-12-18 Listed $289,000 FORTMLS
- 1990-01-22 Sold (Public Records) $79,000 Public Records
- 1983-12-01 Sold (Public Records) $81,900 Public Records
Property tax history
+2.9%/yrLatest (2025): $3,292 · +145.1% YoY. Source: county tax records.
Cash-flow waterfall
monthlySold comps — $/sqft
last 12 mo · ≤1 miLoading sold comps…