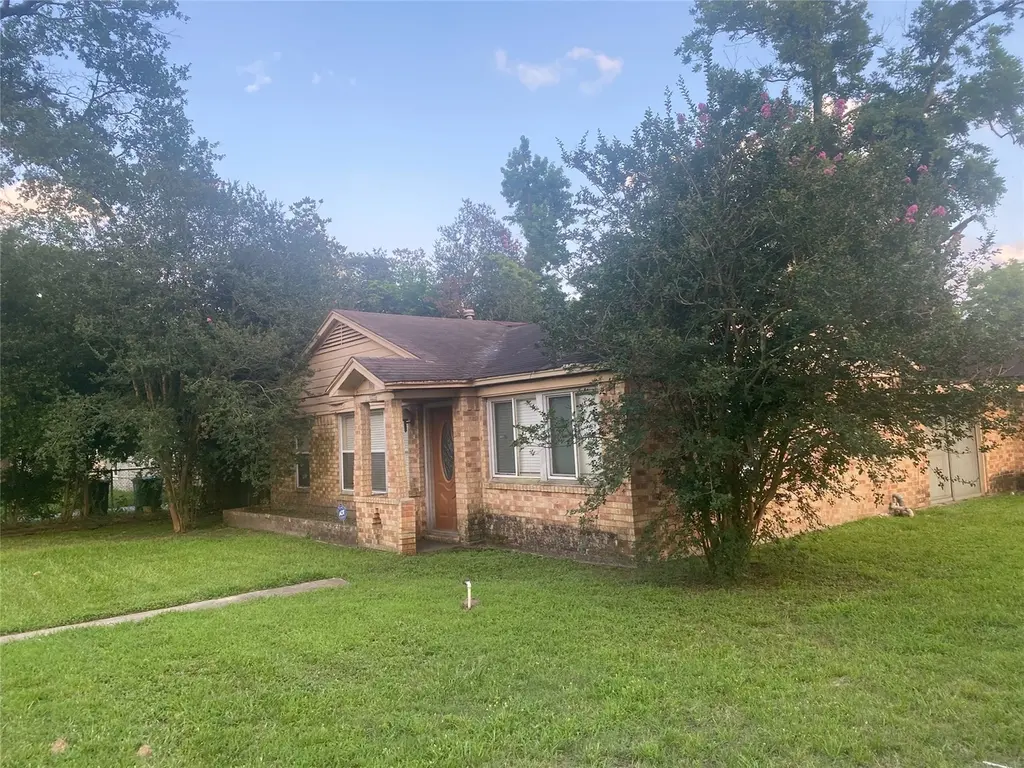
8402 Darlington Dr · Houston, TX
Flood risk 3/10 · Minor
- FEMA flood zone
- X (unshaded)
- Chance of flooding over 30 yrs
- 0.1%
- Est. flood insurance / yr
- $507 – $1,088
Fire risk 2/10 · Minimal
- Est. fire insurance / yr
- $1,222 – $2,270
Heat risk 9/10 · Severe
- Hot days now (above 111°F)
- 7 days/yr
- Hot days in 30 yrs
- 24 days/yr
Wind risk 9/10 · Severe
- Chance of severe wind over 30 yrs
- 99.0%
Air-quality risk 3/10 · Minor
- Unhealthy air days now
- 2 days/yr
- Unhealthy air days in 30 yrs
- 3 days/yr
Risk factors via First Street. Map © Google.
Why this score? — see what drove the A- grade
The composite is a weighted blend of 9 inputs, each scored 0–100. Each bar is that input's sub-score; the figure is the points it added to the 100-point composite (weight × sub-score).
- Cash flow +28.7/30.0
- ARV discount +15.0/15.0
- DSCR +10.0/10.0
- 1% rule +8.9/10.0
- Appreciation +7.6/10.0
- Livability +3.7/5.0
- Schools +2.7/10.0
- Condition / age +2.5/5.0
- Rent growth +2.1/5.0
$139,900
🖨 Deal sheet (PDF) 📄 Offer letter ✓ Due diligence
Listing remarks
This home offers rare space and flexibility in a rapidly improving area of Northeast Houston. Featuring a 4-bedroom, 2-bath layout, a functional floor plan, and solid bones, it provides an excellent opportunity for both homebuyers and investors. The home is ready for updates, giving buyers the chance to choose their own finishes and personalize the interior to match their vision. For investors, the potential is clear, with strong upside after reasonable repairs. Conveniently located just minutes from I-610, US-90, and the transformative East River development, the property also offers easy access to nearby parks and community amenities, including Herman Brown Park, Tidwell Park.
Key facts
- Easy access
- Community amenities
- Nearby parks
Tags
Property features AI
Finance
- Other: Living area reported as 2,077 (unit omitted per instructions)
- Financial info: Lease not considered
Exterior
- Utilities: Public water; Public sewer
- Home design: Residential property; Built in 1950; Slab foundation; Composition roof
- Construction: Construction materials: Unknown
- Exterior features: Corner lot in a subdivision
Interior
- Flooring: Tile; Wood
- Bathrooms: 2 full bathrooms
- Heating & cooling: Central heating (electric); Central air conditioning (electric)
- Interior features: Tile and wood flooring; 8 total rooms
Neighborhood map
What this means for you Summary
Snapshot
- This is a 4-bed/2.0-bath single-family listed at $140k.
Deal economics
- At list price, monthly cash flow is $467 ($6k/yr) — positive.
- The deal already cash-flows at list — no discount required.
- Meets the 1% rule at list price ($2k rent vs $140k).
- Recommended offer: $138k (1.5% below list) — sets the bar for market timing.
Location & tenants
- Location reads 74/100 on livability (#184 in TX, #4,771 nationally) — a middle-class / working-renter tenant base. Strengths: amenities A+, cost of living A+, housing A+; Watch: crime F.
- Houston ISD (urban): math 27% / reading 35% proficiency, ranked #593 of 826 in TX (top 72%) — families likely to look elsewhere, expect single-tenant / working-renter base with shorter leases; 71% free/reduced lunch — lower-income household profile, screen leases tightly.
- Zoned schools: Hilliard El (math 12% / reading 17%, grade F, #4,048 of 4,322 statewide, top 95%, 546 students, 99% FRL); Forest Brook Middle (math 12% / reading 14%, grade F, #1,609 of 1,662 statewide, top 97%, 613 students, 98% FRL); North Forest H S (math 13% / reading 18%, grade F, #1,505 of 1,632 statewide, top 92%, 974 students, 97% FRL) — zoned schools average 98% FRL vs 71% district-wide (27 pts higher); higher-poverty schools than district average — tighter screening recommended.
- Zoned-school proficiency averages 14% at this address vs 31% district-wide (-17 pts) — the specific schools serving this property underperform the Houston ISD average; the district grade overstates school quality for this exact location.
- Market conditions: Rents soft (-1.6%/yr); 355 active listings in the ZIP; 21 comparable units currently listed for rent nearby; rentals at typical pace (median 26d on market — plan ~3-4 weeks tenant-placement turnaround); 48% of comp listings sitting > 30 days — soft ceiling on asking rent; lower-income renter base — watch delinquency; 29,883 units permitted in Harris County in 2024 (8,621 in 5+ unit buildings).
Forward outlook
- In year one you build about $8k of equity ($967 loan paydown + $7k appreciation (5.2% local appreciation)).
- Harris County population projected at +47% by 2050 — long-run rental-demand tailwind backs the buy-and-hold thesis.
- At projected returns (5.2% appreciation + 0.0% rent growth), your $39k cash investment doubles in ~3 years — after that, you're playing with house money.
- By year 5, paydown + projected appreciation supports a ~$36k cash-out refi (75% LTV) — recoverable capital for the next deal without selling this one.
Negotiation context
- It's been on market 15 days — a 2% lower offer ($138k) is reasonable based on typical stale-listing flexibility.
- 3 sale attempts with the ask held roughly flat each time — persistent listings suggest the price (not the market) is what's stuck; bring a comps-based counter.
Risks & watch-outs
- Watch-outs: built in 1950 — expect roof / HVAC / electrical / plumbing capex.
- Climate carrying-cost: severe wind risk, 99% chance of damaging wind over 30y; extreme-heat days projected 7→24/yr by 2055 (HVAC capex compounding) — expect insurance premiums to compound above CPI over the hold.
Questions for the listing agent
- Built in 1950 — when were the roof, HVAC, electrical panel, plumbing, and water heater last replaced?
- Is there a deadline driving the sale (1031 exchange, divorce, estate, relocation)? That informs how much negotiation room exists.
- Schools are D-rated, which usually means shorter tenancies and higher turnover. Who's the typical renter profile here, and what's been the actual vacancy rate?
- Crime grade is F in this area — have there been break-ins, vandalism, or insurance claims at this property in the last 3 years? What carrier currently insures it and at what premium?
- What's the average days-on-market for RENTAL listings here right now (not sales)? A rising rental-DOM trend means longer vacancies and softer asking-rent achievability than the comps imply.
- What's the recent tenant-quality profile in this submarket — average credit score on applications, eviction rate, late-payment / NSF rate, and stable-employment percentage? A property-management company in the area should have these aggregated.
- How much new for-sale + rental construction is in the pipeline within 1–3 miles? Heavy new supply typically softens prices + rents 12–24 months out; constrained supply supports both.
Investment metrics
- 1% rule
- 1.39% ✓
- Cap rate
- 10.30%
- Cash-on-cash
- 14.32%
- DSCR
- 1.64
- GRM
- 6.0
CMA / ARV
- ARV (median comp)
- $230,786
- List price
- $139,900
- Delta
- -39.38%
- Verdict
- UNDERPRICED
- Comps
- 20 within 1.0 mi
Show comp detail 8 sales within ~0.75 mi
| Address | Dist | Beds/Ba | Sqft | Sold | Price | $/sf | Match |
|---|---|---|---|---|---|---|---|
| 8410 Homewood Ln | 0.55mi | 4/2.0 | 2,035 (-2%) | 2mo | $230,000 | $113 | 70 |
| 7812 Denton St | 0.24mi | 3/2.5 (-1) | 1,774 (-15%) | 2mo | $295,000 | $166 | 56 |
| 8405 Green River Dr | 0.04mi | 3/2.0 (-1) | 1,830 (-12%) | 22mo | $335,000 | $183 | 55 |
| 8120 Safebuy St | 0.57mi | 3/2.5 (-1) | 1,868 (-10%) | 4mo | $200,000 | $107 | 46 |
| 6824 Bacher St | 0.64mi | 3/2.0 (-1) | 1,890 (-9%) | 15mo | $234,900 | $124 | 38 |
| 7921 Oak Knoll Ln | 0.71mi | 5/2.0 (+1) | 2,327 (+12%) | 11mo | $225,000 | $97 | 33 |
| 7810 N Wayside Dr | 0.64mi | 4/3.0 | 1,876 (-10%) | 21mo | $255,000 | $136 | 33 |
| 8029 Ritz St | 0.66mi | 3/2.5 (-1) | 2,300 (+11%) | 22mo | $230,000 | $100 | 26 |
Match score weights: distance 35% · size 25% · config 20% · recency 20%. Top-matched comps best support the ARV.
Projected returns pro-forma
5.25% appreciation · 0.0% rent growth · sell at horizon
- IRR
- 23.9%
- Equity multiple
- 2.49×
- Total profit
- $58,384
- Equity at exit
- $81,370
- IRR
- 21.6%
- Equity multiple
- 4.58×
- Total profit
- $140,337
- Equity at exit
- $142,193
Cash invested: $39,172 (down + closing). Projections, not guarantees.
Landlord ↔ Tenant lean methodology
- Overall (STATE)
- 87 Strongly Landlord-Friendly
- State Texas
- 87 Strongly Landlord-Friendly · R+5
- County
- — inherits STATE
- City
- — inherits STATE
ZIP-level market 77028
- Home prices YoY
- 2.0%
- Rents YoY
- -1.6%
- Active inventory
- 355
- Price-to-rent
- 6.0×
Monthly cashflow live
- Estimated rent
- $1,938 high interval (Pro) →
- Mortgage (P&I)
- −$734
- Tax from tax record
- −$272 /mo · $3,264/yr
- Insurance
- −$58
- HOA
- −$0
- Vacancy / Maint / Mgmt
- −$407
- Net cashflow
- $467
Break-even live
Sensitivity live
| Price | -10% $547 | -5% $507 | +0% $467 | +5% $428 | +10% $388 |
|---|---|---|---|---|---|
| Rent | -10% $314 | -5% $391 | +0% $467 | +5% $544 | +10% $620 |
| Rate | -1.0pp $538 | -0.5pp $503 | base $467 | +0.5pp $431 | +1.0pp $394 |
UW: 25.0% down · 7.5% · 30yr · 1.5% tax · 5.0% vac · 8.0% maint · 8.0% mgmt
Financing live
Cash to close
- Down payment
- $34,975
- Closing costs
- $4,197
- Reserves months
- —
- Total cash needed
- —
Loan-product check · same deal, 3 products live
Conventional
25% down · 7.5% · 30yr
- Down + closing
- —
- Monthly P&I
- —
- Monthly cashflow
- —
- DSCR
- —
- Eligible?
- —
Personal DTI + credit; lowest rate.
DSCR
20% down · 8.5% · 30yr
- Down + closing
- —
- Monthly P&I
- —
- Monthly cashflow
- —
- DSCR
- —
- Eligible?
- —
No personal income docs; deal must DSCR.
Hard money
10% down · 12.0% · 12mo
- Down + closing
- —
- Monthly P&I
- —
- Monthly cashflow
- —
- DSCR
- —
- Eligible?
- —
Short-term bridge; refi at stabilization.
Rent comps 21 comps
| Address | Beds | Baths | Sqft | Rent | $/sqft | DOM | Units | Dist |
|---|---|---|---|---|---|---|---|---|
| 8102 Crestview Dr Unit A Houston, TX | 3.0 | 2.5 | 1800 | $1,900 | $1.06 | 23d | 1 | 0.47mi |
| 8102 Crestview Dr Unit B Houston, TX | 3.0 | 2.5 | 1600 | $1,900 | $1.19 | 45d | 1 | 0.47mi |
| 8117 Richland Dr Houston, TX | 5.0 | 2.0 | 1671 | $1,983 | $1.19 | 3d | 1 | 0.48mi |
| 8203 Woodlyn Rd Unit C Houston, TX | 3.0 | 2.5 | 1650 | $1,650 | $1.00 | 9d | 1 | 0.58mi |
| 8238 Homewood Ln Houston, TX | 3.0 | 2.0 | 1696 | $1,695 | $1.00 | 0d | 1 | 0.58mi |
| 8238 Homewood Ln Houston, TX | 3.0 | 2.0 | 1696 | $1,695 | $1.00 | 26d | 1 | 0.58mi |
| 8638 Doris Oaks Cir Houston, TX | 3.0 | 3.0 | 1777 | $1,975 | $1.11 | 45d | 1 | 0.65mi |
| 7914 Laura Koppe Rd Houston, TX | 3.0 | 2.0 | 1400 | $1,850 | $1.32 | 45d | 1 | 0.76mi |
| 8625 Homewood Ln Unit B Houston, TX | 3.0 | 3.0 | 1500 | $1,850 | $1.23 | 45d | 1 | 0.79mi |
| 8627 Homewood Ln Unit B Houston, TX | 3.0 | 2.5 | 1500 | $1,850 | $1.23 | 45d | 1 | 0.80mi |
| 8631 Homewood Ln Unit B Houston, TX | 3.0 | 3.0 | 1500 | $1,850 | $1.23 | 45d | 1 | 0.81mi |
| 8631 Homewood Ln Unit A Houston, TX | 3.0 | 2.5 | 1500 | $1,850 | $1.23 | 45d | 1 | 0.81mi |
| 9222 Hillis St Houston, TX | 3.0 | 2.0 | 1498 | $1,850 | $1.23 | 45d | 1 | 0.91mi |
| 7966 Henson St Unit B Houston, TX | 3.0 | 2.0 | 1608 | $1,410 | $0.88 | 45d | 1 | 0.92mi |
| 8006 Lynette St Houston, TX | 3.0 | 1.0 | 1400 | $1,475 | $1.05 | 26d | 1 | 0.92mi |
| 8135 Chateau St Houston, TX | 3.0 | 3.0 | 1610 | $1,645 | $1.02 | 12d | 1 | 0.97mi |
| 7805 Woodlyn Rd Houston, TX | 4.0 | 2.0 | 1946 | $1,800 | $0.92 | 0d | 1 | 0.98mi |
| 9137 Woodlyn Rd Houston, TX | 3.0 | 1.0 | 1568 | $1,550 | $0.99 | 22d | 1 | 1.21mi |
| 9334 Crestview Dr Houston, TX | 4.0 | 2.5 | 1899 | $1,745 | $0.92 | 7d | 1 | 1.22mi |
| 8235 Locksley Rd Unit A Houston, TX | 3.0 | 2.5 | 1608 | $1,525 | $0.95 | 9d | 1 | 1.30mi |
| 9702 Hillis St Houston, TX | 3.0 | 2.0 | 1612 | $1,550 | $0.96 | 45d | 1 | 1.32mi |
Listing history 14 events
-
2026-06-13statusdays on market $139,900 Pending 15 DOM
-
2026-06-09days on market $139,900 Active 12 DOM
-
2026-06-08days on market $139,900 Active 11 DOM
-
2026-06-07days on market $139,900 Active 10 DOM
-
2026-06-04days on market $139,900 Active 7 DOM
-
2026-06-03days on market $139,900 Active 6 DOM
-
2026-06-02days on market $139,900 Active 5 DOM
-
2026-06-01days on market $139,900 Active 4 DOM
-
2026-05-31days on market $139,900 Active 3 DOM
-
2026-04-10price $139,900 687-char remark
-
2026-04-07status Active 687-char remark
-
2026-02-03status Pending 687-char remark
-
2025-11-25$149,900 Active 687-char remark
-
1988-01-02soldstatus
ⓘ Source: listings_history table (triggers on properties + properties_extension) + one-shot
backfill from property_details.listing_events for pre-trigger history.
Tax reassessment forecast TX · Resets to sale price
- Current annual tax
- $3,264 · $272/mo
- Projected year-2 tax
- $3,264 · $272/mo
- Expected delta
- $0/yr ($0/mo · 0.0%)
ⓘ Screening estimate from a state-policy table — verify with the county assessor before closing.
Climate risk First Street
- Flood 3/10 Moderate FEMA zone X (unshaded) · 10% chance over 30 yrs
- Wildfire 2/10 Low
- Heat 9/10 Extreme 7 d/yr ≥111°F today · 24 d/yr by 30 yrs out
- Wind 9/10 Extreme 99% chance of damaging wind over 30 yrs
- Air quality 3/10 Moderate 2 unhealthy d/yr today · 3 by 30 yrs out
Nearby sold comps map
Loading sold comps map…
Walkable amenities ~0.75 mi
Loading nearby amenities…
Taxation est. · year 1
- Rental income
- $23,260
- − Mortgage interest
- −$7,837
- − Property taxes
- −$3,264
- − Insurance
- −$700
- − Repairs & maintenance
- −$1,861
- − Management
- −$1,861
- − Depreciation
- −$4,070
- Taxable income
- $3,669
- Est. tax owed @ 24.0%
- −$880
- After-tax cash flow
- $4,728/yr
For passive investors: Depreciation is non-cash, so a rental often shows a tax loss while cash-flowing — sheltering income. Rental losses are passive: they offset passive income freely, and up to $25,000/yr can offset ordinary (W-2) income if you actively participate and your MAGI is under $100k (phasing out to $0 by $150k); unused losses carry forward. On sale, claimed depreciation is recaptured at up to 25%, and gains may owe capital-gains tax (a 1031 exchange can defer both). Figures are a year-1 estimate at your 24.0% rate — not tax advice; consult a CPA.
Schools (NCES district)
- District
- Houston ISD
- NCES district ID
- 4823640
- Math proficiency
- 27% ▼ -18.00%
- Reading proficiency
- 35% ▼ -6.00%
- Median HH income
- $46,054
- Composite
- 26.63/100
- National rank
- #7173
- State rank
- #593 of 826 in TX
Livability — Houston
- Score
- 74/100
- State rank
- #184
- US rank
- #4771
Category grades
Schools grade is shown separately in the Schools card above.
Census & demographics
- Census place
- Houston, TX
- County
- Harris County · 4,702,590 people
- City population
- 3,226,434
- Metro
- Houston-The Woodlands-Sugar Land, TX
- Population (ZIP)
- 19,109
- Household income
- $38,357
- Rent vs Own
- Severe rent burden
- 1177.0
Population outlook (Harris County) Hauer SSP2
- Today (2025)
- 5,571,493 people
- By 2030
- 6,089,821 · +9.3%
- By 2040
- 7,142,806 · +28.2%
- By 2050
- 8,185,864 · +46.9%
- By 2075
- 10,574,329 · +89.8%
- By 2100
- 12,109,958 · +117.4%
Race, ethnicity, and origin ACS 2023
- Neighborhood character
- Majority Black (57%)
- Race & ethnicity
- Black 57% Hispanic / Latino 41% Two or more races 15% White 2%
- Hispanic origin (detail)
- Mexican 36%
- Foreign-born
- 13% · Canada
- Languages at home
- 61% English-only · Spanish 38%
Political lean MEDSL · Harris
- 2024 margin
- Lean D (+5.5) · D 52.0% · R 46.4% · Other 1.6%
- 2008→2024 swing
- +3.9pp toward D · 2008: 1.6pp · 2024: 5.5pp
- All cycles
- 2024: D+5.5 2020: D+13.3 2016: D+12.4 2012: D+0.1 2008: D+1.6
Not yet ingested
- Civics
- —
Market trends
- HPI YoY
- ▲ 5.25%
- Current HPI
- 267.7798
- Rent YoY
- ▼ -1.55%
- Metro
- Houston-The Woodlands-Sugar Land, TX
- State GDP YoY
- ▲ 3.95%
- F500 in state
- 110
Industry mix (Fortune 500 HQ in TX)
| Industry | F500 HQs | Revenue |
|---|---|---|
| Energy | 16 | $1,198B |
|
||
| Technology | 5 | $198B |
|
||
| Engineering / Construction | 4 | $72B |
|
||
| Energy Services | 3 | $60B |
|
||
| Utilities | 3 | $41B |
|
||
| Healthcare | 2 | $330B |
|
||
Price history
-6.7% since first listed8 events — show timeline
- 2026-06-12 Pending — HARMLS
- 2026-05-28 Listed $139,900 HARMLS
- 2026-05-22 Listing Removed — HARMLS
- 2026-04-10 Price Changed $139,900 HARMLS
- 2026-04-07 Relisted — HARMLS
- 2026-02-03 Pending — HARMLS
- 2025-11-25 Listed $149,900 HARMLS
- 1988-01-02 Sold (Public Records) — Public Records
Property tax history
+3.0%/yrLatest (2025): $3,264 · +21.9% YoY. Source: county tax records.
Cash-flow waterfall
monthlySold comps — $/sqft
last 12 mo · ≤1 miLoading sold comps…