5327 Broadway St · Ross, WI
Flood risk 1/10 · Minimal
- FEMA flood zone
- X (unshaded)
- Chance of flooding over 30 yrs
- 0.0%
- Est. flood insurance / yr
- $473 – $860
Fire risk 3/10 · Minor
- Est. fire insurance / yr
- $636 – $1,182
Heat risk 1/10 · Minimal
- Hot days now (above 92°F)
- 7 days/yr
- Hot days in 30 yrs
- 13 days/yr
Wind risk 1/10 · Minimal
- Chance of severe wind over 30 yrs
- —
Air-quality risk 1/10 · Minimal
- Unhealthy air days now
- 0 days/yr
- Unhealthy air days in 30 yrs
- 0 days/yr
Risk factors via First Street. Map © Google.
Why this score? — see what drove the D+ grade
The composite is a weighted blend of 9 inputs, each scored 0–100. Each bar is that input's sub-score; the figure is the points it added to the 100-point composite (weight × sub-score).
- Cash flow +12.5/30.0
- Appreciation +9.9/10.0
- ARV discount +7.5/15.0
- Schools +4.2/10.0
- DSCR +3.7/10.0
- 1% rule +2.7/10.0
- Rent growth +2.5/5.0
- Livability +2.5/5.0
- Condition / age +2.5/5.0
$142,500
🖨 Deal sheet 📄 Offer letter ✓ Due diligence
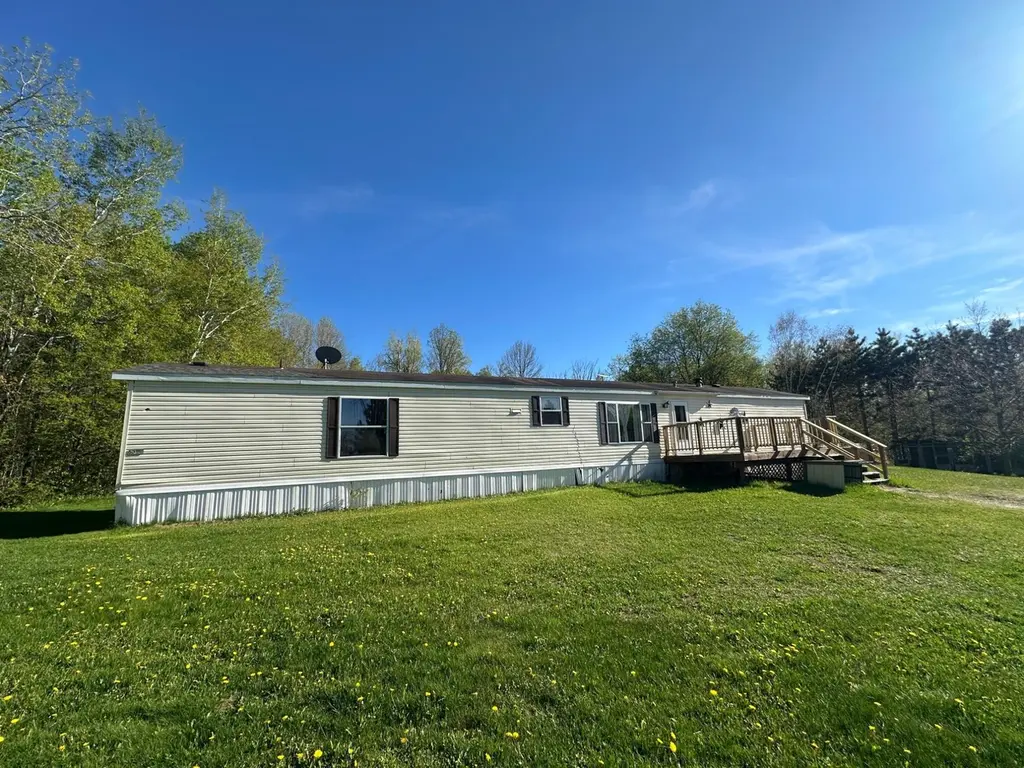
Listing remarks
Tucked away on 1.84 acres off Broadway Street in Newald, this 1996 single wide manufactured home offers the perfect Northwoods getaway with direct access to year-round outdoor recreation. Featuring 3 bedrooms and 2 full baths, the home includes a newer 12x30 deck overlooking the spacious yard. The detached 30x32 garage offers approximately 400 sq ft loft storage, providing plenty of room for recreational gear and equipment. Additional features include a chicken coop, storage shed, and a 20x50 enclosed dog run with privacy fencing and four wooden dog kennels. Located directly across Hwy 139 from thousands of acres of National Forest land and right on the ATV and snowmobile trails, this prope
Key facts
- Newer 12x30 deck
- Storage shed
- Chicken coop
Tags
Property features AI
Finance
- Other: Lot is private and secluded; Zoned residential
- Financial info: Financial details not provided
- HOA & community: No HOA information provided
Exterior
- Parking: 2-car garage; Shared driveway
- Security: No security features listed
- Utilities: Electricity available
- Home design: Residential mobile home; One level
- Construction: Vinyl siding; Composition/shingle roof; Built year not specified; No basement
- Exterior features: Other exterior features; Shed(s)
Interior
- Kitchen: Appliances not specified beyond water heater
- Bedrooms: Details not provided
- Flooring: Carpet; Laminate
- Bathrooms: 2 full bathrooms
- Heating & cooling: Forced air heating; Propane heating
- Interior features: Electric water heater; No fireplace
- Laundry & utility: Laundry on main level
Neighborhood map
What this means for you Summary
Snapshot
- This is a 3-bed/2.0-bath other listed at $142k.
Deal economics
- At list price, monthly cash flow is $-21 ($-249/yr) — negative.
- To cash-flow at today's rent, offer at most $139k (2.6% below list).
- To meet the 1% rule (rent ≥ 1% of price), the offer needs to be $109k (23.5% below list).
- Recommended offer: $109k (23.5% below list) — sets the bar for 1% rule.
Location & tenants
- Location reads: area grade D — affects rentability + tenant quality, not the cash-flow math above.
- Laona School District (rural): math 50% / reading 45% proficiency, ranked #154 of 426 in WI (top 36%) — families likely to look elsewhere, expect single-tenant / working-renter base with shorter leases.
- Market conditions: 24 active listings in the ZIP; 69 units permitted in Forest County in 2024 (0 in 5+ unit buildings).
Forward outlook
- In year one you build about $15k of equity ($985 loan paydown + $14k appreciation (9.9% local appreciation)).
- Forest County population projected at -28% by 2050 — secular population decline; favor cash flow + early exit over multi-decade hold.
- At projected returns (9.9% appreciation + 3.0% rent growth), your $40k cash investment doubles in ~3 years — after that, you're playing with house money.
- By year 3, paydown + projected appreciation supports a ~$38k cash-out refi (75% LTV) — recoverable capital for the next deal without selling this one.
Negotiation context
- It's been on market 27 days — a 2% lower offer ($140k) is reasonable based on typical stale-listing flexibility.
Questions for the listing agent
- What do current leases actually rent for vs. the listed asking? Can we see a recent rent roll and the last 12 months of T-12 income?
- Is there a deadline driving the sale (1031 exchange, divorce, estate, relocation)? That informs how much negotiation room exists.
- The area grade is low — what's the realistic commute time and amenity access for the typical tenant pool here? Any planned neighborhood developments (good or bad) we should know about?
- What's the average days-on-market for RENTAL listings here right now (not sales)? A rising rental-DOM trend means longer vacancies and softer asking-rent achievability than the comps imply.
- What's the recent tenant-quality profile in this submarket — average credit score on applications, eviction rate, late-payment / NSF rate, and stable-employment percentage? A property-management company in the area should have these aggregated.
- How much new for-sale + rental construction is in the pipeline within 1–3 miles? Heavy new supply typically softens prices + rents 12–24 months out; constrained supply supports both.
Investment metrics
- 1% rule
- 0.77% ✗
- Cap rate
- 6.12%
- Cash-on-cash
- -0.62%
- DSCR
- 0.97
- GRM
- 10.9
CMA / ARV
No comps found within radius.
Projected returns pro-forma
9.86% appreciation · 3.0% rent growth · sell at horizon
- IRR
- 23.5%
- Equity multiple
- 2.88×
- Total profit
- $74,822
- Equity at exit
- $126,867
- IRR
- 20.9%
- Equity multiple
- 6.54×
- Total profit
- $220,910
- Equity at exit
- $272,003
Cash invested: $39,900 (down + closing). Projections, not guarantees.
Landlord ↔ Tenant lean methodology
- Overall (STATE)
- 73 Landlord-Friendly
- State Wisconsin
- 73 Landlord-Friendly · R+2
- County
- — inherits STATE
- City
- — inherits STATE
ZIP-level market 54511
- Home prices YoY
- 5.4%
- Active inventory
- 24
- Price-to-rent
- 10.9×
Monthly cashflow live
- Estimated rent
- $1,091 medium interval (Pro) →
- Mortgage (P&I)
- −$747
- Tax from tax record
- −$76 /mo · $910/yr
- Insurance
- −$59
- HOA
- −$0
- Vacancy / Maint / Mgmt
- −$229
- Net cashflow
- $-21
Break-even live
UW: 25.0% down · 7.5% · 30yr · 1.5% tax · 5.0% vac · 8.0% maint · 8.0% mgmt
Financing live
Cash to close
- Down payment
- $35,625
- Closing costs
- $4,275
- Reserves months
- —
- Total cash needed
- —
Loan-product check · same deal, 3 products live
Conventional
25% down · 7.5% · 30yr
- Down + closing
- —
- Monthly P&I
- —
- Monthly cashflow
- —
- DSCR
- —
- Eligible?
- —
Personal DTI + credit; lowest rate.
DSCR
20% down · 8.5% · 30yr
- Down + closing
- —
- Monthly P&I
- —
- Monthly cashflow
- —
- DSCR
- —
- Eligible?
- —
No personal income docs; deal must DSCR.
Hard money
10% down · 12.0% · 12mo
- Down + closing
- —
- Monthly P&I
- —
- Monthly cashflow
- —
- DSCR
- —
- Eligible?
- —
Short-term bridge; refi at stabilization.
Listing history 16 events
-
2026-06-18days on market $142,500 Active 27 DOM
-
2026-06-17days on market $142,500 Active 26 DOM
-
2026-06-16days on market $142,500 Active 25 DOM
-
2026-06-15days on market $142,500 Active 24 DOM
-
2026-06-15days on market $142,500 Active 23 DOM
-
2026-06-13days on market $142,500 Active 22 DOM
-
2026-06-12days on market $142,500 Active 21 DOM
-
2026-06-09days on market $142,500 Active 18 DOM
-
2026-06-08days on market $142,500 Active 17 DOM
-
2026-06-08days on market $142,500 Active 16 DOM
-
2026-06-07days on market $142,500 Active 15 DOM
-
2026-06-03days on market $142,500 Active 12 DOM
-
2026-06-02days on market $142,500 Active 11 DOM
-
2026-06-01days on market $142,500 Active 10 DOM
-
2026-05-31days on market $142,500 Active 9 DOM
-
2026-05-22$142,500 Active
ⓘ Source: listings_history table (triggers on properties + properties_extension) + one-shot
backfill from property_details.listing_events for pre-trigger history.
Tax reassessment forecast WI · Partial reset (capped growth)
- Current annual tax
- $910 · $76/mo
- Projected year-2 tax
- $1,773 · $148/mo
- Expected delta
- +$863/yr (+$72/mo · 94.8%)
ⓘ Screening estimate from a state-policy table — verify with the county assessor before closing.
Climate risk First Street
- Flood 1/10 Low FEMA zone X (unshaded) · 0% chance over 30 yrs
- Wildfire 3/10 Moderate
- Heat 1/10 Low 7 d/yr ≥92°F today · 13 d/yr by 30 yrs out
- Wind 1/10 Low
- Air quality 1/10 Low 0 unhealthy d/yr today · 0 by 30 yrs out
Nearby sold comps map
Loading sold comps map…
Walkable amenities ~0.75 mi
Loading nearby amenities…
Taxation est. · year 1
- Rental income
- $13,090
- − Mortgage interest
- −$7,982
- − Property taxes
- −$910
- − Insurance
- −$712
- − Repairs & maintenance
- −$1,047
- − Management
- −$1,047
- − Depreciation
- −$4,145
- Taxable loss
- −$2,755
- Est. tax savings @ 24.0%
- +$661
- After-tax cash flow
- $412/yr
For passive investors: Depreciation is non-cash, so a rental often shows a tax loss while cash-flowing — sheltering income. Rental losses are passive: they offset passive income freely, and up to $25,000/yr can offset ordinary (W-2) income if you actively participate and your MAGI is under $100k (phasing out to $0 by $150k); unused losses carry forward. On sale, claimed depreciation is recaptured at up to 25%, and gains may owe capital-gains tax (a 1031 exchange can defer both). Figures are a year-1 estimate at your 24.0% rate — not tax advice; consult a CPA.
Schools (NCES district)
- District
- Laona School District
- NCES district ID
- 5507830
- Math proficiency
- 50% ▲ 5.00%
- Reading proficiency
- 45% ▬ 0.00%
- Median HH income
- $42,576
- Composite
- 42.14/100
- National rank
- #7029
- State rank
- #154 of 426 in WI
Livability — Ross
No livability data for this city. (Only ~50 U.S. cities are tracked.)
Census & demographics
- Census place
- Newald, WI
- Population (ZIP)
- 1,375
Population outlook (Forest County) Hauer SSP2
- Today (2025)
- 8,449 people
- By 2030
- 8,032 · -4.9%
- By 2040
- 7,064 · -16.4%
- By 2050
- 6,119 · -27.6%
- By 2075
- 4,592 · -45.7%
- By 2100
- 3,630 · -57.0%
Race, ethnicity, and origin ACS 2023
- Neighborhood character
- Predominantly White (91%)
- Race & ethnicity
- White 91% Two or more races 4% Native American 2% Hispanic / Latino 1%
- Common ancestry
- Romanian 6% Portuguese 4% Iranian 2%
- Foreign-born
- 0%
- Languages at home
- 98% English-only · Spanish 1%
Political lean MEDSL · Forest
- 2024 margin
- Solid R (+33.4) · D 33.0% · R 66.4%
- 2008→2024 swing
- -48.5pp toward R · 2008: 15.2pp · 2024: -33.4pp
- All cycles
- 2024: R+33.4 2020: R+30.9 2016: R+26.7 2012: D+5.4 2008: D+15.2
Not yet ingested
- Civics
- —
Market trends
- HPI YoY
- ▲ 9.86%
- Current HPI
- 191.1009
- Rent YoY
- —
- Metro
- —
- State GDP YoY
- ▲ 2.10%
- F500 in state
- 20
Industry mix (Fortune 500 HQ in WI)
| Industry | F500 HQs | Revenue |
|---|---|---|
| Industrial Machinery | 4 | $23B |
|
||
| Industrial Technology | 2 | $36B |
|
||
| Insurance | 1 | $36B |
|
||
| Professional Services | 1 | $19B |
|
||
| Utilities | 1 | $9B |
|
||
| Consumer Goods | 1 | $3B |
|
||
Price history
1 event — show timeline
- 2026-05-22 Listed $142,500 GNMLS
Property tax history
-3.1%/yrLatest (2025): $910 · -3.3% YoY. Source: county tax records.
Cash-flow waterfall
monthlySold comps — $/sqft
last 12 mo · ≤1 miLoading sold comps…