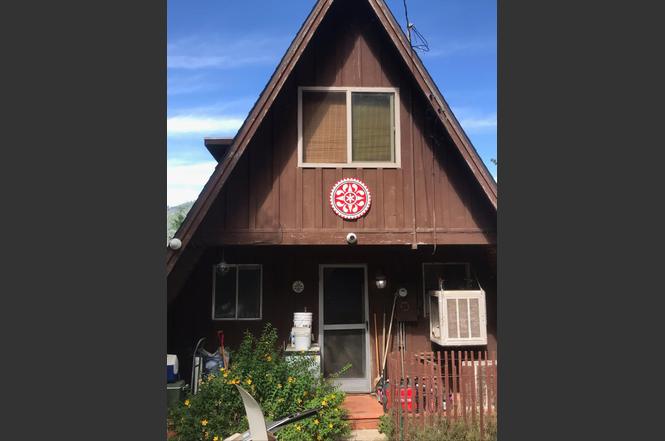
5886 Meadows Ln · Bootjack, CA
Flood risk 1/10 · Minimal
- FEMA flood zone
- X (unshaded)
- Chance of flooding over 30 yrs
- 0.0%
- Est. flood insurance / yr
- $507 – $1,088
Fire risk 8/10 · Major
- Est. fire insurance / yr
- $659 – $1,223
Heat risk 4/10 · Minor
- Hot days now (above 99°F)
- 9 days/yr
- Hot days in 30 yrs
- 22 days/yr
Wind risk 1/10 · Minimal
- Chance of severe wind over 30 yrs
- —
Air-quality risk 10/10 · Severe
- Unhealthy air days now
- 48 days/yr
- Unhealthy air days in 30 yrs
- 55 days/yr
Risk factors via First Street. Map © Google.
Why this score? — see what drove the B+ grade
The composite is a weighted blend of 9 inputs, each scored 0–100. Each bar is that input's sub-score; the figure is the points it added to the 100-point composite (weight × sub-score).
- Cash flow +30.0/30.0
- ARV discount +15.0/15.0
- 1% rule +10.0/10.0
- DSCR +10.0/10.0
- Schools +3.0/10.0
- Rent growth +2.5/5.0
- Condition / age +2.5/5.0
- Livability +2.4/5.0
- Appreciation +0.0/10.0
$199,000
🖨 Deal sheet 📄 Offer letter ✓ Due diligence
Listing remarks MLS
PRICE REDUCTION! Come to your Vacation Home, Retreat, or your Getaway Home. What a cute & cozy home tucked in the Lush Meadows Mountain Estates. Lushmeadows Estates has 2 beautiful lakes in neighborhood - Dawn and Mallard Lakes. They are both available for the enjoyment of members and their guests. Mallard Lake is located next to the Clubhouse, near the entrance to Lushmeadows. Picnic tables are available next to the Clubhouse. No license is required for fishing at Mallard Lake.
Key facts
- Mature fruit trees
- Access to dawn lake
- Private clubhouse
Tags
Property features AI
Finance
- Other: Living area source: Public records
- HOA & community: Homeowners association with annual fee of $125; Association amenities include clubhouse, green area, and lake/pond
Exterior
- Parking: Open parking with potential RV parking
- Utilities: Electric service connected; Public sewer; Public utilities
- Home design: Single family residence; Two-story
- Construction: Wood siding; Composition roof; Concrete foundation with wood subfloor; Built with methods recorded in public records
- Exterior features: Foothill lot setting; Mature landscaping; No solar
Interior
- Bedrooms: Two levels (home has two stories)
- Flooring: Tile
- Bathrooms: 1 bathroom
- Heating & cooling: Evaporative cooling
- Interior features: Tile flooring; Inside laundry; Wood-burning fireplace
- Laundry & utility: Laundry inside the home
Neighborhood map
What this means for you Summary
Snapshot
- This is a 2-bed/1.0-bath single-family listed at $199k.
Deal economics
- At list price, monthly cash flow is $2k ($18k/yr) — positive.
- The deal already cash-flows at list — no discount required.
- Meets the 1% rule at list price ($4k rent vs $199k).
- Cap rate 15.4% vs local median 3.4% in Bootjack — top-decile yield for the area; either an underpriced asset or a hidden risk that comps aren't pricing in. Stress-test before assuming the spread holds.
Location & tenants
- Location reads 48/100 on livability (#1,203 in CA) — a working-class tenant base; expect higher turnover. Strengths: housing B; Watch: employment C-, crime F, amenities F.
- Mariposa County Unified (rural): math 27% / reading 42% proficiency, ranked #282 of 517 in CA (top 54%) — families likely to look elsewhere, expect single-tenant / working-renter base with shorter leases.
- Zoned schools: Woodland Elementary (math 25% / reading 42%, grade F, #764 of 1,571 statewide, top 49%, 423 students, 62% FRL); Mariposa County High (math 47% / reading 57%, grade D+, #296 of 1,170 statewide, top 27%, 448 students, 61% FRL).
- Market conditions: 167 active listings in the ZIP; 1 comparable units currently listed for rent nearby; 89 units permitted in Mariposa County in 2024 (0 in 5+ unit buildings).
Forward outlook
- Local home prices are declining (-3.0%/yr); year-one equity from $1k of loan paydown is wiped out by about $6k of value loss. Plan a longer hold.
- Mariposa County population projected at -23% by 2050 — secular population decline; favor cash flow + early exit over multi-decade hold.
- At projected returns (-3.0% appreciation + 3.0% rent growth), your $56k cash investment doubles in ~4 years — after that, you're playing with house money.
Negotiation context
- Only 9 days on market — expect competitive offers; lowballing is unlikely to land.
- 3 sale attempts since 11y ago with the ask held roughly flat each time — persistent listings suggest the price (not the market) is what's stuck; bring a comps-based counter.
- Current owner paid $125k; list at $199k implies a 59% gain — meaningful room to come down on a strong offer.
Risks & watch-outs
- Climate carrying-cost: severe wildfire risk — expect insurance premiums to compound above CPI over the hold.
Questions for the listing agent
- Built in 1968 — when were the roof, HVAC, electrical panel, plumbing, and water heater last replaced?
- What does the HOA fee cover, when was the last increase, and are there any pending special assessments or reserve-fund shortfalls?
- Is there a deadline driving the sale (1031 exchange, divorce, estate, relocation)? That informs how much negotiation room exists.
- Crime grade is F in this area — have there been break-ins, vandalism, or insurance claims at this property in the last 3 years? What carrier currently insures it and at what premium?
- What's the average days-on-market for RENTAL listings here right now (not sales)? A rising rental-DOM trend means longer vacancies and softer asking-rent achievability than the comps imply.
- What's the recent tenant-quality profile in this submarket — average credit score on applications, eviction rate, late-payment / NSF rate, and stable-employment percentage? A property-management company in the area should have these aggregated.
- How much new for-sale + rental construction is in the pipeline within 1–3 miles? Heavy new supply typically softens prices + rents 12–24 months out; constrained supply supports both.
Investment metrics
- 1% rule
- 1.76% ✓
- Cap rate
- 15.38%
- Cash-on-cash
- 32.44%
- DSCR
- 2.44
- GRM
- 4.7
CMA / ARV
- ARV (on-the-fly)
- $306,900
- Comps found
- 1
Show comp detail 1 sale within ~0.75 mi
| Address | Dist | Beds/Ba | Sqft | Sold | Price | $/sf | Match |
|---|---|---|---|---|---|---|---|
| 5826 Half Dome | 0.65mi | 2/2.0 | 1,037 (-7%) | 10mo | $285,000 | $275 | 46 |
Match score weights: distance 35% · size 25% · config 20% · recency 20%. Top-matched comps best support the ARV.
Projected returns pro-forma
-3.0% appreciation · 3.0% rent growth · sell at horizon
- IRR
- 27.5%
- Equity multiple
- 2.14×
- Total profit
- $63,679
- Equity at exit
- $29,672
- IRR
- 35.0%
- Equity multiple
- 4.21×
- Total profit
- $178,918
- Equity at exit
- $17,206
Cash invested: $55,720 (down + closing). Projections, not guarantees.
Landlord ↔ Tenant lean methodology
- Overall (STATE)
- 18 Strongly Tenant-Friendly
- State California
- 18 Strongly Tenant-Friendly · D+13
- County
- — inherits STATE
- City
- — inherits STATE
ZIP-level market 95338
- Active inventory
- 167
- Price-to-rent
- 4.7×
Monthly cashflow live
- Estimated rent
- $3,500 medium interval (Pro) →
- Mortgage (P&I)
- −$1,044
- Tax from tax record
- −$122 /mo · $1,465/yr
- Insurance
- −$83
- HOA
- −$10
- Vacancy / Maint / Mgmt
- −$735
- Net cashflow
- $1,506
Break-even live
UW: 25.0% down · 7.5% · 30yr · 1.5% tax · 5.0% vac · 8.0% maint · 8.0% mgmt
Financing live
Cash to close
- Down payment
- $49,750
- Closing costs
- $5,970
- Reserves months
- —
- Total cash needed
- —
Loan-product check · same deal, 3 products live
Conventional
25% down · 7.5% · 30yr
- Down + closing
- —
- Monthly P&I
- —
- Monthly cashflow
- —
- DSCR
- —
- Eligible?
- —
Personal DTI + credit; lowest rate.
DSCR
20% down · 8.5% · 30yr
- Down + closing
- —
- Monthly P&I
- —
- Monthly cashflow
- —
- DSCR
- —
- Eligible?
- —
No personal income docs; deal must DSCR.
Hard money
10% down · 12.0% · 12mo
- Down + closing
- —
- Monthly P&I
- —
- Monthly cashflow
- —
- DSCR
- —
- Eligible?
- —
Short-term bridge; refi at stabilization.
Rent comps 1 comps
| Address | Beds | Baths | Sqft | Rent | $/sqft | DOM | Units | Dist |
|---|---|---|---|---|---|---|---|---|
| 6106 Smither Rd Mariposa, CA | 2.0 | 2.0 | 1474 | $3,500 | $2.37 | 44d | 1 | 1.32mi |
HOA detail
- Monthly dues
- $10 · $120/yr
Listing history 8 events
-
2026-06-19days on market $199,000 Active 9 DOM
-
2026-06-18days on market $199,000 Active 8 DOM
-
2026-06-17days on market $199,000 Active 7 DOM
-
2026-06-16days on market $199,000 Active 6 DOM
-
2026-06-15days on market $199,000 Active 5 DOM
-
2026-06-14days on market $199,000 Active 3 DOM
-
2026-06-13remarks 699-char remark
-
2026-06-13$199,000 Active 2 DOM
ⓘ Source: listings_history table (triggers on properties + properties_extension) + one-shot
backfill from property_details.listing_events for pre-trigger history.
Tax reassessment forecast CA · Resets to sale price
- Current annual tax
- $1,465 · $122/mo
- Projected year-2 tax
- $1,512 · $126/mo
- Expected delta
- +$47/yr (+$4/mo · 3.2%)
ⓘ Screening estimate from a state-policy table — verify with the county assessor before closing.
Climate risk First Street
- Flood 1/10 Low FEMA zone X (unshaded) · 0% chance over 30 yrs
- Wildfire 8/10 Severe
- Heat 4/10 Moderate 9 d/yr ≥99°F today · 22 d/yr by 30 yrs out
- Wind 1/10 Low
- Air quality 10/10 Extreme 48 unhealthy d/yr today · 55 by 30 yrs out
Nearby sold comps map
Loading sold comps map…
Walkable amenities ~0.75 mi
Loading nearby amenities…
Taxation est. · year 1
- Rental income
- $42,000
- − Mortgage interest
- −$11,147
- − Property taxes
- −$1,465
- − Insurance
- −$995
- − Repairs & maintenance
- −$3,360
- − Management
- −$3,360
- − HOA
- −$120
- − Depreciation
- −$5,789
- Taxable income
- $15,764
- Est. tax owed @ 24.0%
- −$3,783
- After-tax cash flow
- $14,294/yr
For passive investors: Depreciation is non-cash, so a rental often shows a tax loss while cash-flowing — sheltering income. Rental losses are passive: they offset passive income freely, and up to $25,000/yr can offset ordinary (W-2) income if you actively participate and your MAGI is under $100k (phasing out to $0 by $150k); unused losses carry forward. On sale, claimed depreciation is recaptured at up to 25%, and gains may owe capital-gains tax (a 1031 exchange can defer both). Figures are a year-1 estimate at your 24.0% rate — not tax advice; consult a CPA.
Schools (NCES district)
- District
- Mariposa County Unified
- NCES district ID
- 0623940
- Math proficiency
- 27% ▼ -12.00%
- Reading proficiency
- 42% ▼ -5.00%
- Median HH income
- $48,669
- Composite
- 29.75/100
- National rank
- #6438
- State rank
- #282 of 517 in CA
Livability — Bootjack
- Score
- 48/100
- State rank
- #1203
- US rank
- #26092
Category grades
Schools grade is shown separately in the Schools card above.
Census & demographics
- Population (ZIP)
- 10,164
Population outlook (Mariposa County) Hauer SSP2
- Today (2025)
- 15,956 people
- By 2030
- 15,078 · -5.5%
- By 2040
- 13,413 · -15.9%
- By 2050
- 12,232 · -23.3%
- By 2075
- 11,143 · -30.2%
- By 2100
- 10,187 · -36.2%
Race, ethnicity, and origin ACS 2023
- Neighborhood character
- Predominantly White (81%)
- Race & ethnicity
- White 81% Two or more races 9% Hispanic / Latino 9% Native American 2% Asian 2%
- Hispanic origin (detail)
- Mexican 7%
- Common ancestry
- Lithuanian 5% Italian 4% Russian 2%
- Foreign-born
- 4% · Canada, China
- Languages at home
- 95% English-only · Spanish 2% French/Haitian/Cajun 1% Chinese 1%
Political lean MEDSL · Mariposa
- 2024 margin
- Strong R (+21.1) · D 38.1% · R 59.1% · Other 2.8%
- 2008→2024 swing
- -8.6pp toward R · 2008: -12.4pp · 2024: -21.1pp
- All cycles
- 2024: R+21.1 2020: R+18.1 2016: R+23.2 2012: R+17.4 2008: R+12.4
Not yet ingested
- Civics
- —
Market trends
- HPI YoY
- ▼ -151.82%
- Current HPI
- 140.3045
- Rent YoY
- —
- Metro
- —
- State GDP YoY
- ▲ 3.21%
- F500 in state
- 116
Industry mix (Fortune 500 HQ in CA)
| Industry | F500 HQs | Revenue |
|---|---|---|
| Technology | 27 | $1,492B |
|
||
| Financial Services | 3 | $174B |
|
||
| Retail | 3 | $44B |
|
||
| Insurance | 3 | $26B |
|
||
| Media / Entertainment | 2 | $115B |
|
||
| Pharmaceuticals / Biotech | 2 | $62B |
|
||
Price history
+59.2% since first listed6 events — show timeline
- 2026-06-09 Listed $199,000 FRESNOMLS
- 2015-11-24 Sold (Public Records) $125,000 Public Records
- 2015-11-24 Sold (MLS) $125,000 bridgeMLS, Bay East AOR, or Contra Costa AOR
- 2015-11-24 Sold (MLS) $125,000 MLSListings
- 2015-04-06 Listed $125,000 bridgeMLS, Bay East AOR, or Contra Costa AOR
- 2015-04-06 Listed $125,000 MLSListings
Property tax history
+5.3%/yrLatest (2025): $1,465 · +2.7% YoY. Source: county tax records.
Cash-flow waterfall
monthlySold comps — $/sqft
last 12 mo · ≤1 miLoading sold comps…