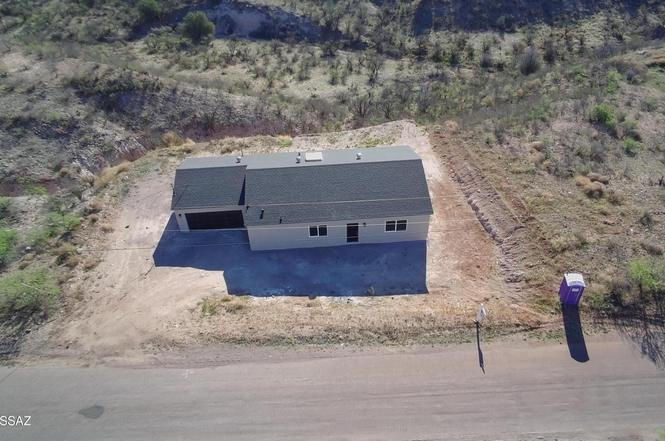
383 Via Aloe Vera · Rio Rico, AZ
Flood risk 1/10 · Minimal
- FEMA flood zone
- X (unshaded)
- Chance of flooding over 30 yrs
- 0.0%
- Est. flood insurance / yr
- $507 – $1,088
Fire risk 7/10 · Major
- Est. fire insurance / yr
- $610 – $1,132
Heat risk 7/10 · Major
- Hot days now (above 99°F)
- 7 days/yr
- Hot days in 30 yrs
- 20 days/yr
Wind risk 1/10 · Minimal
- Chance of severe wind over 30 yrs
- —
Air-quality risk 1/10 · Minimal
- Unhealthy air days now
- 0 days/yr
- Unhealthy air days in 30 yrs
- 0 days/yr
Risk factors via First Street. Map © Google.
Why this score? — see what drove the D- grade
The composite is a weighted blend of 9 inputs, each scored 0–100. Each bar is that input's sub-score; the figure is the points it added to the 100-point composite (weight × sub-score).
- Appreciation +10.0/10.0
- ARV discount +7.5/15.0
- Cash flow +5.8/30.0
- Schools +4.4/10.0
- Livability +3.2/5.0
- Rent growth +2.5/5.0
- Condition / age +2.5/5.0
- 1% rule +1.2/10.0
- DSCR +0.2/10.0
$271,250
🖨 Deal sheet (PDF) 📄 Offer letter ✓ Due diligence
Listing remarks
Seller will accept or counter offers between $258,240 and $275,995. Spacious 3-bedroom, 2-bath home offering over 1,500 sq ft of comfortable living space on a flat, usable 0.8+ acre lot. This property provides endless potential with ample room to add an ADU, pool, workshop, RV garage, or additional outbuildings. Enjoy privacy, flexibility, and room to grow--all while having the convenience of a 2-car garage and expansive outdoor space. A rare opportunity to own nearly an acre with room to create your ideal setup.
Key facts
- Flat usable lot
- 0.89 acre lot
- 2 garage spots
Tags
Property features AI
Exterior
- Parking: 2-car garage; 2 covered parking spaces; Garage door opener
- Utilities: Water from a water company; Septic tank sewer
- Home design: Single family residence; One story
- Construction: Frame construction with stucco exterior; Shingle roof
- Exterior features: Covered patio/porch; Decorative gravel landscaping; North/South exposure; Paved city-maintained road
Interior
- Kitchen: Dishwasher; Electric range; Electric cooktop
- Flooring: Ceramic tile
- Bathrooms: 2 full bathrooms
- Heating & cooling: Electric heating; Central air conditioning; Ceiling fans
- Interior features: Ceiling fans
- Laundry & utility: Dedicated laundry room
Neighborhood map
What this means for you Summary
Snapshot
- This is a 3-bed/2.0-bath land listed at $271k.
Deal economics
- At list price, monthly cash flow is $-543 ($-7k/yr) — negative.
- To cash-flow at today's rent, offer at most $193k (29.0% below list).
- To meet the 1% rule (rent ≥ 1% of price), the offer needs to be $169k (37.9% below list).
- Recommended offer: $169k (37.9% below list) — sets the bar for 1% rule.
Location & tenants
- Location reads 63/100 on livability (#115 in AZ) — a middle-class / working-renter tenant base. Strengths: cost of living A+, housing A+; Watch: health & safety C-, employment D+, crime F.
- Santa Cruz Elementary District (4459) (rural): math 45% / reading 55% proficiency, ranked #129 of 501 in AZ (top 26%) — acceptable for families but not a draw, mixed tenant base, ~2y average lease.
- Zoned schools: Little Red Schoolhouse (math 27% / reading 42%, grade F, #471 of 1,109 statewide, top 44%, 183 students, 70% FRL) — zoned schools average 70% FRL vs 24% district-wide (46 pts higher); higher-poverty schools than district average — tighter screening recommended.
- Zoned-school proficiency averages 34% at this address vs 50% district-wide (-16 pts) — the specific schools serving this property underperform the Santa Cruz Elementary District (4459) average; the district grade overstates school quality for this exact location.
- Market conditions: 414 active listings in the ZIP; 340 units permitted in Santa Cruz County in 2024 (0 in 5+ unit buildings).
- This rent runs 33% of the median local income ($62k/yr) — at the standard rent-burdened threshold; future hikes will face affordability resistance.
Forward outlook
- In year one you build about $29k of equity ($2k loan paydown + $27k appreciation (10.0% local appreciation)).
- Santa Cruz County population projected at -22% by 2050 — secular population decline; favor cash flow + early exit over multi-decade hold.
- By year 2, paydown + projected appreciation supports a ~$47k cash-out refi (75% LTV) — recoverable capital for the next deal without selling this one.
Negotiation context
- It's been on market 119 days — a 9% lower offer ($247k) is reasonable based on typical stale-listing flexibility.
- Current owner paid $8k; list at $271k implies a 3291% gain — meaningful room to come down on a strong offer.
Risks & watch-outs
- Climate carrying-cost: major wildfire risk; extreme-heat days projected 7→20/yr by 2055 (HVAC capex compounding) — expect insurance premiums to compound above CPI over the hold.
Questions for the listing agent
- What do current leases actually rent for vs. the listed asking? Can we see a recent rent roll and the last 12 months of T-12 income?
- It's been on market 119 days. Have you received any prior offers? Is the seller open to a 38% concession, seller financing, or rate buy-down credit?
- Why hasn't it sold? Are there any deal-killer items the seller is aware of (foundation, flood, title, zoning, code violations)?
- Is there a deadline driving the sale (1031 exchange, divorce, estate, relocation)? That informs how much negotiation room exists.
- Schools are F-rated, which usually means shorter tenancies and higher turnover. Who's the typical renter profile here, and what's been the actual vacancy rate?
- Crime grade is F in this area — have there been break-ins, vandalism, or insurance claims at this property in the last 3 years? What carrier currently insures it and at what premium?
- The area grade is low — what's the realistic commute time and amenity access for the typical tenant pool here? Any planned neighborhood developments (good or bad) we should know about?
- What's the average days-on-market for RENTAL listings here right now (not sales)? A rising rental-DOM trend means longer vacancies and softer asking-rent achievability than the comps imply.
- What's the recent tenant-quality profile in this submarket — average credit score on applications, eviction rate, late-payment / NSF rate, and stable-employment percentage? A property-management company in the area should have these aggregated.
- How much new for-sale + rental construction is in the pipeline within 1–3 miles? Heavy new supply typically softens prices + rents 12–24 months out; constrained supply supports both.
Investment metrics
- 1% rule
- 0.62% ✗
- Cap rate
- 3.89%
- Cash-on-cash
- -8.58%
- DSCR
- 0.62
- GRM
- 13.4
CMA / ARV
No comps found within radius.
Projected returns pro-forma
10.0% appreciation · 3.0% rent growth · sell at horizon
- IRR
- 18.2%
- Equity multiple
- 2.49×
- Total profit
- $113,172
- Equity at exit
- $244,363
- IRR
- 17.0%
- Equity multiple
- 5.75×
- Total profit
- $360,519
- Equity at exit
- $526,979
Cash invested: $75,950 (down + closing). Projections, not guarantees.
Landlord ↔ Tenant lean methodology
- Overall (STATE)
- 87 Strongly Landlord-Friendly
- State Arizona
- 87 Strongly Landlord-Friendly · R+3
- County
- — inherits STATE
- City
- — inherits STATE
ZIP-level market 85648
- Home prices YoY
- 21.0%
- Active inventory
- 414
- Price-to-rent
- 13.4×
Monthly cashflow live
- Estimated rent
- $1,686 medium interval (Pro) →
- Mortgage (P&I)
- −$1,422
- Tax est. 1.5%
- −$339 /mo · $4,069/yr
- Insurance
- −$113
- HOA
- −$0
- Vacancy / Maint / Mgmt
- −$354
- Net cashflow
- $-543
Break-even live
Sensitivity live
| Price | -10% $-356 | -5% $-449 | +0% $-543 | +5% $-637 | +10% $-730 |
|---|---|---|---|---|---|
| Rent | -10% $-676 | -5% $-610 | +0% $-543 | +5% $-476 | +10% $-410 |
| Rate | -1.0pp $-406 | -0.5pp $-474 | base $-543 | +0.5pp $-613 | +1.0pp $-685 |
UW: 25.0% down · 7.5% · 30yr · 1.5% tax · 5.0% vac · 8.0% maint · 8.0% mgmt
Financing live
Cash to close
- Down payment
- $67,812
- Closing costs
- $8,138
- Reserves months
- —
- Total cash needed
- —
Loan-product check · same deal, 3 products live
Conventional
25% down · 7.5% · 30yr
- Down + closing
- —
- Monthly P&I
- —
- Monthly cashflow
- —
- DSCR
- —
- Eligible?
- —
Personal DTI + credit; lowest rate.
DSCR
20% down · 8.5% · 30yr
- Down + closing
- —
- Monthly P&I
- —
- Monthly cashflow
- —
- DSCR
- —
- Eligible?
- —
No personal income docs; deal must DSCR.
Hard money
10% down · 12.0% · 12mo
- Down + closing
- —
- Monthly P&I
- —
- Monthly cashflow
- —
- DSCR
- —
- Eligible?
- —
Short-term bridge; refi at stabilization.
Listing history 21 events
-
2026-06-22days on market $271,250 Active 119 DOM
-
2026-06-19days on market $271,250 Active 116 DOM
-
2026-06-18days on market $271,250 Active 115 DOM
-
2026-06-17days on market $271,250 Active 114 DOM
-
2026-06-16days on market $271,250 Active 113 DOM
-
2026-06-15days on market $271,250 Active 112 DOM
-
2026-06-14days on market $271,250 Active 110 DOM
-
2026-06-12days on market $271,250 Active 109 DOM
-
2026-06-09days on market $271,250 Active 106 DOM
-
2026-06-08days on market $271,250 Active 105 DOM
-
2026-06-07days on market $271,250 Active 104 DOM
-
2026-06-05days on market $271,250 Active 102 DOM
-
2026-06-04days on market $271,250 Active 100 DOM
-
2026-06-02days on market $271,250 Active 99 DOM
-
2026-06-01days on market $271,250 Active 98 DOM
-
2026-05-31days on market $271,250 Active 97 DOM
-
2026-05-31days on market $271,250 Active 96 DOM
-
2026-05-17price $271,250
-
2026-03-13price $273,250
-
2026-02-23$279,250 Active
-
2024-09-04soldstatus $8,000
ⓘ Source: listings_history table (triggers on properties + properties_extension) + one-shot
backfill from property_details.listing_events for pre-trigger history.
Climate risk First Street
- Flood 1/10 Low FEMA zone X (unshaded) · 0% chance over 30 yrs
- Wildfire 7/10 Severe
- Heat 7/10 Severe 7 d/yr ≥99°F today · 20 d/yr by 30 yrs out
- Wind 1/10 Low
- Air quality 1/10 Low 0 unhealthy d/yr today · 0 by 30 yrs out
Nearby sold comps map
Loading sold comps map…
Walkable amenities ~0.75 mi
Loading nearby amenities…
Taxation est. · year 1
- Rental income
- $20,226
- − Mortgage interest
- −$15,194
- − Property taxes
- −$4,069
- − Insurance
- −$1,356
- − Repairs & maintenance
- −$1,618
- − Management
- −$1,618
- − Depreciation
- −$7,891
- Taxable loss
- −$11,520
- Est. tax savings @ 24.0%
- +$2,765
- After-tax cash flow
- $-3,751/yr
For passive investors: Depreciation is non-cash, so a rental often shows a tax loss while cash-flowing — sheltering income. Rental losses are passive: they offset passive income freely, and up to $25,000/yr can offset ordinary (W-2) income if you actively participate and your MAGI is under $100k (phasing out to $0 by $150k); unused losses carry forward. On sale, claimed depreciation is recaptured at up to 25%, and gains may owe capital-gains tax (a 1031 exchange can defer both). Figures are a year-1 estimate at your 24.0% rate — not tax advice; consult a CPA.
Schools (NCES district)
- District
- Santa Cruz Elementary District (4459)
- NCES district ID
- 0407500
- Math proficiency
- 45% ▼ -5.00%
- Reading proficiency
- 55% ▬ 0.00%
- Median HH income
- $44,772
- Composite
- 44.28/100
- National rank
- #6166
- State rank
- #129 of 501 in AZ
Livability — Rio Rico
- Score
- 63/100
- State rank
- #115
- US rank
- #15321
Category grades
Schools grade is shown separately in the Schools card above.
Census & demographics
- Census place
- Rio Rico, AZ
- County
- Santa Cruz County · 22,118 people
- City population
- 22,118
- Metro
- Nogales, AZ
- Population (ZIP)
- 22,118
- Household income
- $61,519
- Rent vs Own
- Severe rent burden
- 407.0
Population outlook (Santa Cruz County) Hauer SSP2
- Today (2025)
- 43,796 people
- By 2030
- 42,097 · -3.9%
- By 2040
- 38,235 · -12.7%
- By 2050
- 34,224 · -21.9%
- By 2075
- 26,014 · -40.6%
- By 2100
- 18,165 · -58.5%
Race, ethnicity, and origin ACS 2023
- Neighborhood character
- Predominantly Hispanic (86%)
- Race & ethnicity
- Hispanic / Latino 86% Two or more races 48% White 12%
- Hispanic origin (detail)
- Mexican 83%
- Common ancestry
- Lithuanian 1% Slovak 1% Iranian 1%
- Foreign-born
- 30% · Canada
- Languages at home
- 21% English-only · Spanish 79%
Political lean MEDSL · Santa Cruz
- 2024 margin
- D (+18.6) · D 58.9% · R 40.3%
- 2008→2024 swing
- -12.7pp toward R · 2008: 31.3pp · 2024: 18.6pp
- All cycles
- 2024: D+18.6 2020: D+35.5 2016: D+47.1 2012: D+37.8 2008: D+31.3
Not yet ingested
- Civics
- —
Market trends
- HPI YoY
- ▲ 72.18%
- Current HPI
- 415.2167
- Rent YoY
- —
- Metro
- Nogales, AZ
- State GDP YoY
- ▲ 4.54%
- F500 in state
- 20
Industry mix (Fortune 500 HQ in AZ)
| Industry | F500 HQs | Revenue |
|---|---|---|
| Technology | 2 | $13B |
|
||
| Mining / Metals | 1 | $23B |
|
||
| Environmental Services | 1 | $16B |
|
||
| Metals / Steel | 1 | $14B |
|
||
| Technology Distribution | 1 | $9B |
|
||
| Homebuilding | 1 | $8B |
|
||
Price history
+3290.6% since first listed4 events — show timeline
- 2026-05-17 Price Changed $271,250 MLSSAZ
- 2026-03-13 Price Changed $273,250 MLSSAZ
- 2026-02-23 Listed $279,250 MLSSAZ
- 2024-09-04 Sold (Public Records) $8,000 Public Records
Property tax history
-0.9%/yrLatest (2025): $179 · +10.0% YoY. Source: county tax records.
Cash-flow waterfall
monthlySold comps — $/sqft
last 12 mo · ≤1 miLoading sold comps…