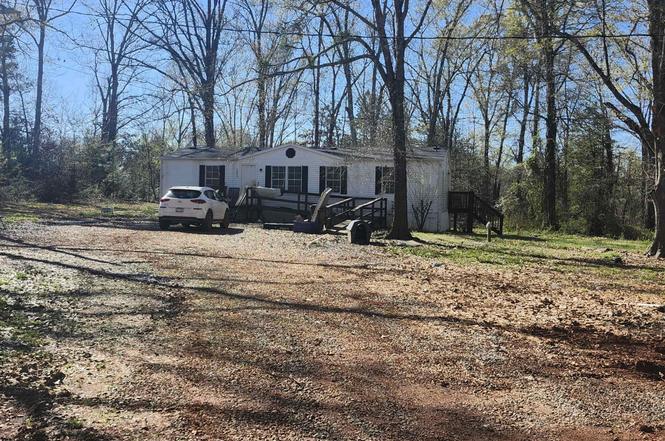
2003 Old Denver School Rd · Sandy Springs, SC
Flood risk No data
- FEMA flood zone
- —
- Chance of flooding over 30 yrs
- —
- Est. flood insurance / yr
- —
Fire risk No data
- Est. fire insurance / yr
- —
Heat risk No data
- Hot days now (above threshold)
- —
- Hot days in 30 yrs
- —
Wind risk No data
- Chance of severe wind over 30 yrs
- —
Air-quality risk No data
- Unhealthy air days now
- —
- Unhealthy air days in 30 yrs
- —
Risk factors via First Street. Map © Google.
Why this score? — see what drove the C- grade
The composite is a weighted blend of 9 inputs, each scored 0–100. Each bar is that input's sub-score; the figure is the points it added to the 100-point composite (weight × sub-score).
- Cash flow +20.5/30.0
- ARV discount +8.4/15.0
- DSCR +6.5/10.0
- 1% rule +5.4/10.0
- Schools +4.9/10.0
- Rent growth +2.7/5.0
- Livability +2.5/5.0
- Condition / age +2.5/5.0
- Appreciation +0.0/10.0
$165,000
🖨 Deal sheet 📄 Offer letter ✓ Due diligence
Listing remarks
Beautiful 4 BR/ 2 Bath manufactured home with laminate and wood flooring throughout and stainless steel appliances. Home has a large, and secluded lot that's perfect for outdoor entertaining. If square footage is important please verify.
Key facts
- Large secluded lot
- Outdoor entertaining
- 0.42 acre lot
Tags
Property features AI
Exterior
- Parking: No designated parking
- Security: Smoke detector(s)
- Utilities: Private water; Septic tank
- Home design: Residential mobile home (double wide); One story
- Construction: Composition roof
- Exterior features: Deck; Porch; Level, wooded lot
Interior
- Kitchen: Electric cooktop; Dishwasher; Electric water heater
- Flooring: Laminate
- Bathrooms: 2 full bathrooms
- Heating & cooling: Electric heating; Central air conditioning
- Interior features: Tray ceilings; Open floor plan
- Laundry & utility: Laundry on main level
Neighborhood map
What this means for you Summary
Snapshot
- This is a 4-bed/2.0-bath manufactured listed at $165k.
Deal economics
- At list price, monthly cash flow is $217 ($3k/yr) — positive.
- The deal already cash-flows at list — no discount required.
- Meets the 1% rule at list price ($2k rent vs $165k).
- Recommended offer: $150k (9.0% below list) — sets the bar for market timing.
- Cap rate 7.9% vs local median 1.5% in Sandy Springs — top-decile yield for the area; either an underpriced asset or a hidden risk that comps aren't pricing in. Stress-test before assuming the spread holds.
Location & tenants
- Location reads: area grade C — affects rentability + tenant quality, not the cash-flow math above.
- Anderson 04 (rural): math 56% / reading 60% proficiency, ranked #4 of 80 in SC (top 5%) — acceptable for families but not a draw, mixed tenant base, ~2y average lease.
- Zoned schools: Riverside Middle (math 48% / reading 55%, grade C, #34 of 229 statewide, top 15%, 426 students, 63% FRL) — zoned schools average 63% FRL vs 46% district-wide (17 pts higher); higher-poverty schools than district average — tighter screening recommended.
- Market conditions: Rents flat; 328 active listings in the ZIP; 1,255 units permitted in Anderson County in 2024 (0 in 5+ unit buildings).
- This rent runs 33% of the median local income ($62k/yr) — at the standard rent-burdened threshold; future hikes will face affordability resistance.
Forward outlook
- Local home prices are declining (-3.0%/yr); year-one equity from $1k of loan paydown is wiped out by about $5k of value loss. Plan a longer hold.
- Anderson County population projected at +14% by 2050 — modest demand growth; plan on rents tracking national, not racing it.
Negotiation context
- It's been on market 96 days — a 9% lower offer ($150k) is reasonable based on typical stale-listing flexibility.
- 8 sale attempts since 3y ago; this cycle's ask has dropped $10k (6%) from the opening price — seller is motivated, your offer sets the floor, not the list.
- Current owner paid $140k; 18% above their basis — modest negotiation headroom, anchor on the comps not their cost.
Questions for the listing agent
- It's been on market 96 days. Have you received any prior offers? Is the seller open to a 9% concession, seller financing, or rate buy-down credit?
- Why hasn't it sold? Are there any deal-killer items the seller is aware of (foundation, flood, title, zoning, code violations)?
- Is there a deadline driving the sale (1031 exchange, divorce, estate, relocation)? That informs how much negotiation room exists.
- What's the average days-on-market for RENTAL listings here right now (not sales)? A rising rental-DOM trend means longer vacancies and softer asking-rent achievability than the comps imply.
- What's the recent tenant-quality profile in this submarket — average credit score on applications, eviction rate, late-payment / NSF rate, and stable-employment percentage? A property-management company in the area should have these aggregated.
- How much new for-sale + rental construction is in the pipeline within 1–3 miles? Heavy new supply typically softens prices + rents 12–24 months out; constrained supply supports both.
Investment metrics
- 1% rule
- 1.04% ✓
- Cap rate
- 7.87%
- Cash-on-cash
- 5.63%
- DSCR
- 1.25
- GRM
- 8.0
CMA / ARV
- ARV (on-the-fly)
- $168,192
- Comps found
- 2
Show comp detail 2 sales within ~0.75 mi
| Address | Dist | Beds/Ba | Sqft | Sold | Price | $/sf | Match |
|---|---|---|---|---|---|---|---|
| 439 Oak Shores Rd | 0.31mi | 3/2.0 (-1) | 1,237 (+7%) | 4mo | $180,000 | $146 | 65 |
| 2221 Roach Cir | 0.67mi | 3/1.0 (-1) | 1,000 (-13%) | 3mo | $64,900 | $65 | 35 |
Match score weights: distance 35% · size 25% · config 20% · recency 20%. Top-matched comps best support the ARV.
Projected returns pro-forma
-3.0% appreciation · 0.75% rent growth · sell at horizon
- IRR
- -10.1%
- Equity multiple
- 0.64×
- Total profit
- $-16,701
- Equity at exit
- $24,602
- IRR
- -4.2%
- Equity multiple
- 0.75×
- Total profit
- $-11,570
- Equity at exit
- $14,266
Cash invested: $46,200 (down + closing). Projections, not guarantees.
Landlord ↔ Tenant lean methodology
- Overall (STATE)
- 90 Strongly Landlord-Friendly
- State South Carolina
- 90 Strongly Landlord-Friendly · R+6
- County
- — inherits STATE
- City
- — inherits STATE
ZIP-level market 29625
- Rents YoY
- 0.8%
- Active inventory
- 328
- Price-to-rent
- 8.0×
Monthly cashflow live
- Estimated rent
- $1,718 medium interval (Pro) →
- Mortgage (P&I)
- −$865
- Tax est. 1.5%
- −$206 /mo · $2,475/yr
- Insurance
- −$69
- HOA
- −$0
- Vacancy / Maint / Mgmt
- −$361
- Net cashflow
- $217
Break-even live
UW: 25.0% down · 7.5% · 30yr · 1.5% tax · 5.0% vac · 8.0% maint · 8.0% mgmt
Financing live
Cash to close
- Down payment
- $41,250
- Closing costs
- $4,950
- Reserves months
- —
- Total cash needed
- —
Loan-product check · same deal, 3 products live
Conventional
25% down · 7.5% · 30yr
- Down + closing
- —
- Monthly P&I
- —
- Monthly cashflow
- —
- DSCR
- —
- Eligible?
- —
Personal DTI + credit; lowest rate.
DSCR
20% down · 8.5% · 30yr
- Down + closing
- —
- Monthly P&I
- —
- Monthly cashflow
- —
- DSCR
- —
- Eligible?
- —
No personal income docs; deal must DSCR.
Hard money
10% down · 12.0% · 12mo
- Down + closing
- —
- Monthly P&I
- —
- Monthly cashflow
- —
- DSCR
- —
- Eligible?
- —
Short-term bridge; refi at stabilization.
Listing history 33 events
-
2026-06-18days on market $165,000 Active 96 DOM
-
2026-06-17days on market $165,000 Active 95 DOM
-
2026-06-16days on market $165,000 Active 94 DOM
-
2026-06-15days on market $165,000 Active 93 DOM
-
2026-06-13days on market $165,000 Active 91 DOM
-
2026-06-13days on market $165,000 Active 90 DOM
-
2026-06-10days on market $165,000 Active 88 DOM
-
2026-06-09days on market $165,000 Active 87 DOM
-
2026-06-08days on market $165,000 Active 86 DOM
-
2026-06-07days on market $165,000 Active 85 DOM
-
2026-06-05days on market $165,000 Active 82 DOM
-
2026-06-03days on market $165,000 Active 81 DOM
-
2026-06-03days on market $165,000 Active 80 DOM
-
2026-06-01days on market $165,000 Active 79 DOM
-
2026-05-31days on market $165,000 Active 78 DOM
-
2026-04-01price $165,000
-
2026-03-11$175,000 Active
-
2025-10-03historical
-
2025-09-30status Active
-
2025-09-30status Active
-
2025-08-01historical
-
2025-07-28$164,900 Active
-
2025-07-28$164,900 Active
-
2023-06-15status Active
-
2023-06-15soldstatus $140,000 Sold
-
2023-06-15soldstatus $140,000 Sold CO-OP Member
-
2023-04-26status Pending
-
2023-04-26status Pending
-
2023-04-11price $160,000
-
2023-04-11price $160,000
-
2023-04-10$150,000 Active
-
2023-04-10$150,000 Active
-
1998-02-10soldstatus $8,000
ⓘ Source: listings_history table (triggers on properties + properties_extension) + one-shot
backfill from property_details.listing_events for pre-trigger history.
Nearby sold comps map
Loading sold comps map…
Walkable amenities ~0.75 mi
Loading nearby amenities…
Taxation est. · year 1
- Rental income
- $20,615
- − Mortgage interest
- −$9,243
- − Property taxes
- −$2,475
- − Insurance
- −$825
- − Repairs & maintenance
- −$1,649
- − Management
- −$1,649
- − Depreciation
- −$4,800
- Taxable loss
- −$26
- Est. tax savings @ 24.0%
- +$6
- After-tax cash flow
- $2,609/yr
For passive investors: Depreciation is non-cash, so a rental often shows a tax loss while cash-flowing — sheltering income. Rental losses are passive: they offset passive income freely, and up to $25,000/yr can offset ordinary (W-2) income if you actively participate and your MAGI is under $100k (phasing out to $0 by $150k); unused losses carry forward. On sale, claimed depreciation is recaptured at up to 25%, and gains may owe capital-gains tax (a 1031 exchange can defer both). Figures are a year-1 estimate at your 24.0% rate — not tax advice; consult a CPA.
Schools (NCES district)
- District
- Anderson 04
- NCES district ID
- 4500870
- Math proficiency
- 56% ▼ -5.00%
- Reading proficiency
- 60% ▼ -1.00%
- Median HH income
- $48,338
- Composite
- 49.25/100
- National rank
- #2030
- State rank
- #4 of 80 in SC
Livability — Sandy Springs
No livability data for this city. (Only ~50 U.S. cities are tracked.)
Census & demographics
- County
- Anderson County · 99,076 people
- Metro
- Greenville-Anderson, SC
- Population (ZIP)
- 28,012
- Household income
- $61,960
- Rent vs Own
- Severe rent burden
- 773.0
Population outlook (Anderson County) Hauer SSP2
- Today (2025)
- 210,546 people
- By 2030
- 217,791 · +3.4%
- By 2040
- 230,643 · +9.5%
- By 2050
- 240,220 · +14.1%
- By 2075
- 259,518 · +23.3%
- By 2100
- 258,696 · +22.9%
Race, ethnicity, and origin ACS 2023
- Neighborhood character
- Predominantly White (75%)
- Race & ethnicity
- White 75% Black 15% Two or more races 6% Hispanic / Latino 4% Asian 1%
- Common ancestry
- Serbian 3% Slovak 2% Romanian 1%
- Foreign-born
- 4% · Canada, South Korea
- Languages at home
- 96% English-only · Spanish 2%
Political lean MEDSL · Anderson
- 2024 margin
- Solid R (+47.4) · D 25.7% · R 73.1% · Other 1.2%
- 2008→2024 swing
- -14.1pp toward R · 2008: -33.3pp · 2024: -47.4pp
- All cycles
- 2024: R+47.4 2020: R+42.0 2016: R+43.7 2012: R+36.4 2008: R+33.3
Not yet ingested
- Civics
- —
Market trends
- HPI YoY
- ▼ -186.36%
- Current HPI
- 307.3451
- Rent YoY
- ▲ 0.75%
- Metro
- Greenville-Anderson, SC
- State GDP YoY
- ▲ 4.51%
- F500 in state
- 2
Industry mix (Fortune 500 HQ in SC)
| Industry | F500 HQs | Revenue |
|---|---|---|
| Packaging | 1 | $7B |
|
||
Price history
+1962.5% since first listed18 events — show timeline
- 2026-04-01 Price Changed $165,000 SPMLS
- 2026-03-11 Listed $175,000 SPMLS
- 2025-10-03 Listing Removed — Greater Greenville MLS
- 2025-09-30 Relisted — SPMLS
- 2025-09-30 Relisted — Greater Greenville MLS
- 2025-08-01 Listing Removed — Greater Greenville MLS
- 2025-07-28 Listed $164,900 Greater Greenville MLS
- 2025-07-28 Listed $164,900 SPMLS
- 2023-06-15 Relisted — Greater Greenville MLS
- 2023-06-15 Sold (MLS) $140,000 SPMLS
- 2023-06-15 Sold (MLS) $140,000 Greater Greenville MLS
- 2023-04-26 Pending — Greater Greenville MLS
- 2023-04-26 Pending — SPMLS
- 2023-04-11 Price Changed $160,000 Greater Greenville MLS
- 2023-04-11 Price Changed $160,000 SPMLS
- 2023-04-10 Listed $150,000 SPMLS
- 2023-04-10 Listed $150,000 Greater Greenville MLS
- 1998-02-10 Sold (Public Records) $8,000 Public Records
Property tax history
-9.1%/yrLatest (2022): $59 · +5.0% YoY. Source: county tax records.
Cash-flow waterfall
monthlySold comps — $/sqft
last 12 mo · ≤1 miLoading sold comps…